When application performance degrades due to slow queries, connection timeouts, or rising error rates, identifying the root cause at the database level is often the first step. The Database tab in Managed Service for OpenTelemetry surfaces database call metrics, slow query patterns, and exception details so you can pinpoint bottlenecks without switching between tools.
The database analysis page is organized into three layers:
Database overview -- filter, chart, and list all databases your application calls. Identify which database has the highest error rate or slowest response time.
Database details -- drill into a single database to analyze SQL performance, exceptions, request sources, and traces.
Alerts -- create alert rules to detect database issues before they affect users.
Prerequisites
Before you begin, make sure that you have:
An application reporting data to Managed Service for OpenTelemetry. For setup instructions, see Connection Description
Open the database analysis page
Log on to the Managed Service for OpenTelemetry console.
In the left-side navigation pane, click Applications.
On the Applications page, select a region in the top navigation bar, then click the application name.
In the top navigation bar, click Database.
Filter and explore database metrics
Quick filters
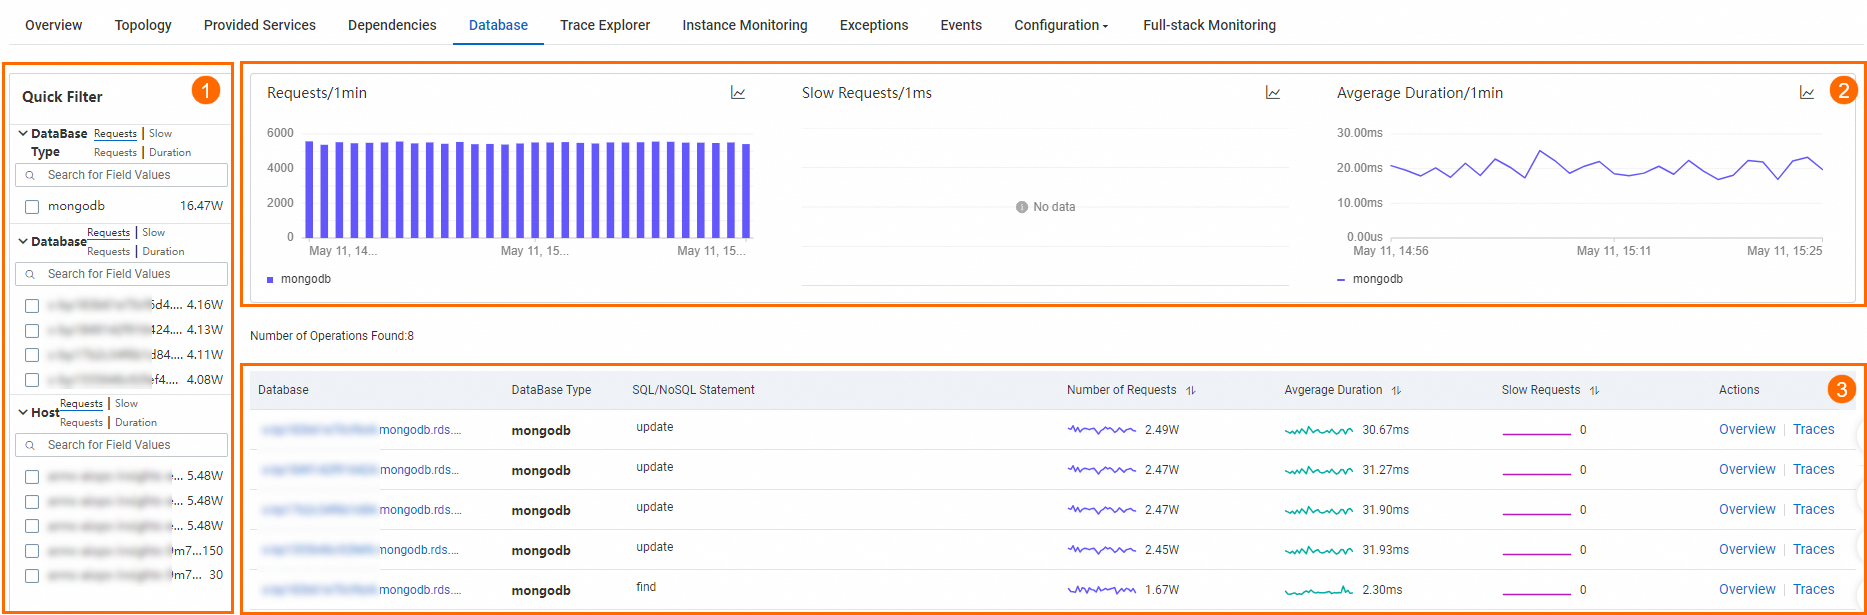
Use the Quick Filter section (labeled 1 in the preceding figure) to narrow charts and the database list by:
| Filter | Description |
|---|---|
| database type | Database engine, such as MySQL, PostgreSQL, or Redis |
| database name | Specific database instance name |
| host | Server hosting the database |
Trend charts
The trend chart section (labeled 2) displays time-series data for three metrics:
| Metric | Description |
|---|---|
| Requests | Total number of database calls |
| Errors | Number of failed calls |
| Average response time | Mean latency per call |
Click the  icon to view metrics for a specific time range or compare the same period across different dates. Click the
  icon to switch between a column chart and a trend chart.
Database list
The database list (labeled 3) shows the following columns:
| Column | Description |
|---|---|
| Database name | Name of the database |
| Database type | Database engine (for example, MySQL, PostgreSQL, or Redis) |
| Statement | Database statement or query |
| Requests | Total number of calls |
| Errors | Number of failed calls |
| Avg response time | Mean response time per call |
From the database list, you can perform the following actions:
View details -- click the database name to open the database details page. See Database details.
View overview -- click Overview in the Actions column to open a summary panel with request counts, slow calls, average response time, and call distribution.
View traces -- click Traces in the Actions column to inspect individual trace records. See Trace analysis.
Database details
Click a database name in the database list to open its details page. The details page contains five tabs:
| Tab | Purpose |
|---|---|
| Overview | Assess overall database health at a glance |
| SQL analysis | Find and investigate slow or problematic queries |
| Exceptions | Identify recurring database errors |
| Source of Request | Trace calls back to the upstream operations that triggered them |
| Trace Explorer | Build custom queries across multiple dimensions for deep diagnostics |
Overview
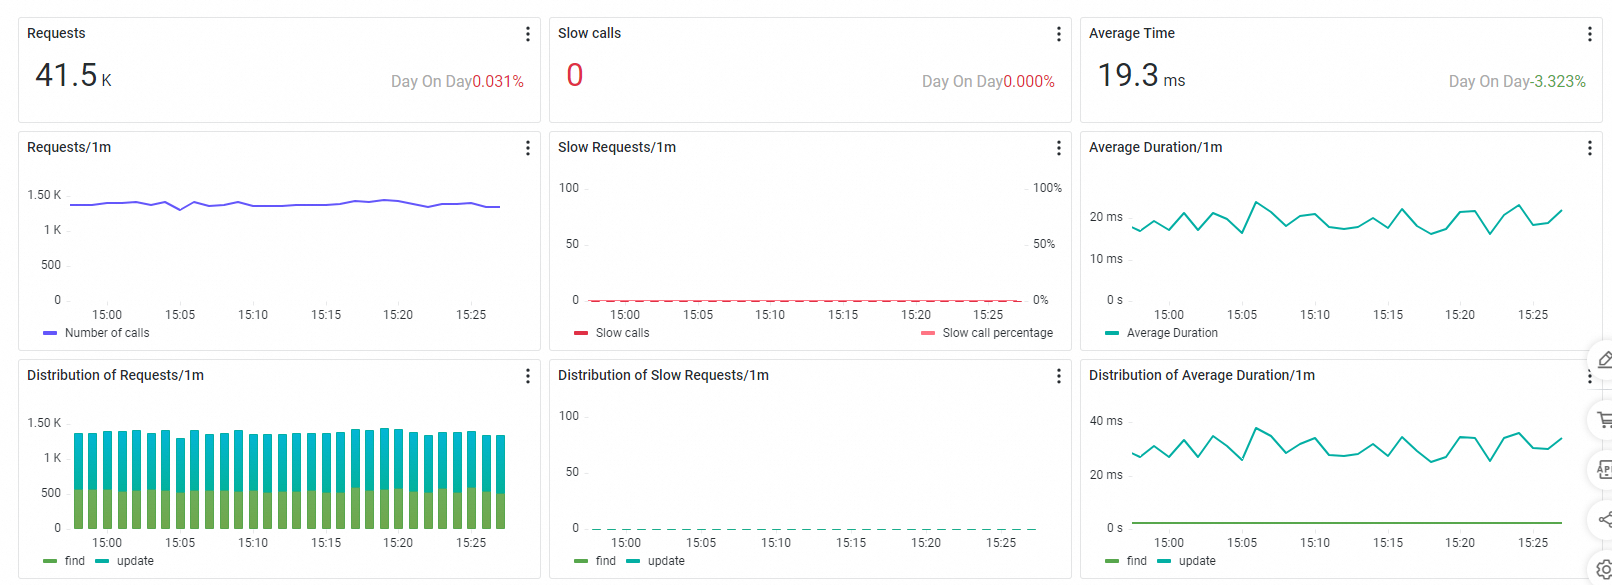
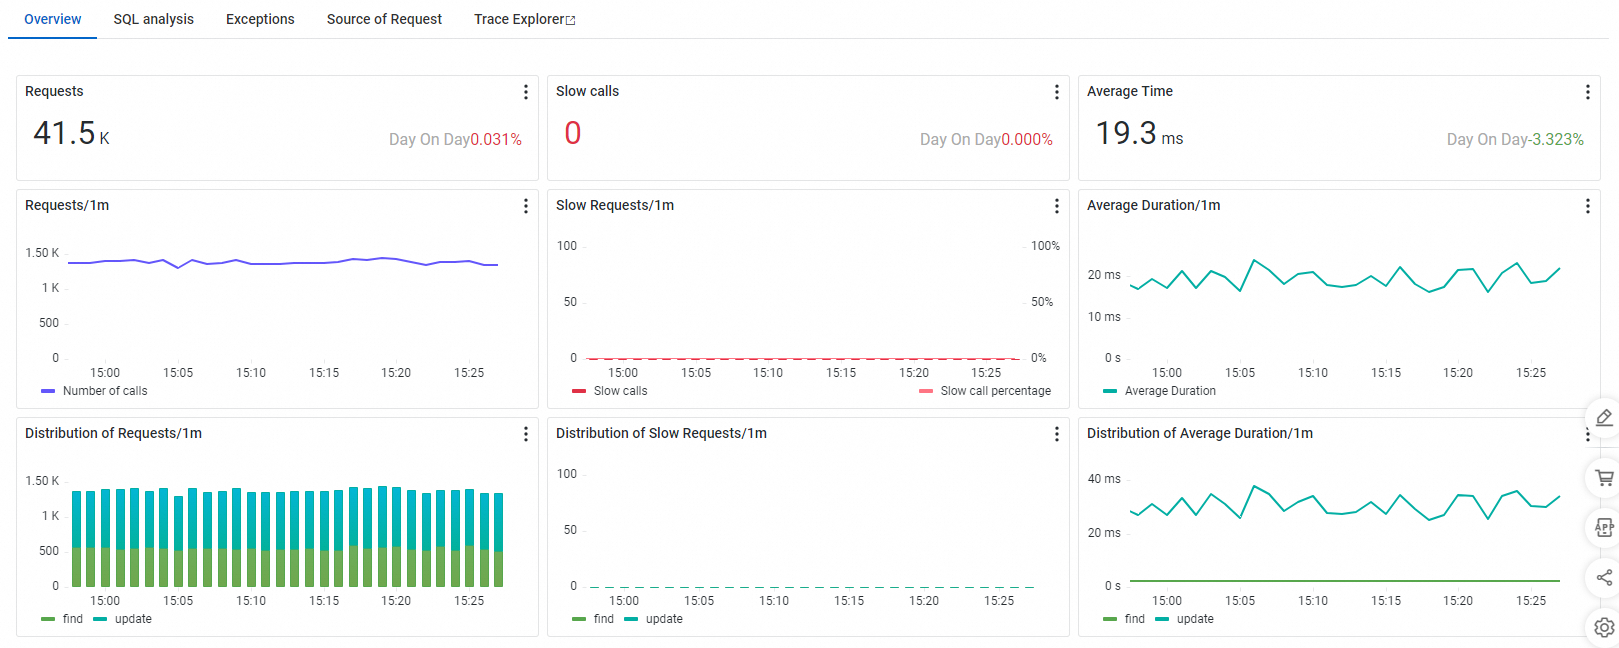
The Overview tab shows time-series curves and distribution breakdowns for:
Number of requests
Number of slow calls
Average response time
Use this tab to quickly assess whether a database is healthy or experiencing degraded performance. A sudden spike in slow calls or a rising average response time indicates a bottleneck worth investigating in the SQL analysis or Exceptions tabs.
SQL analysis
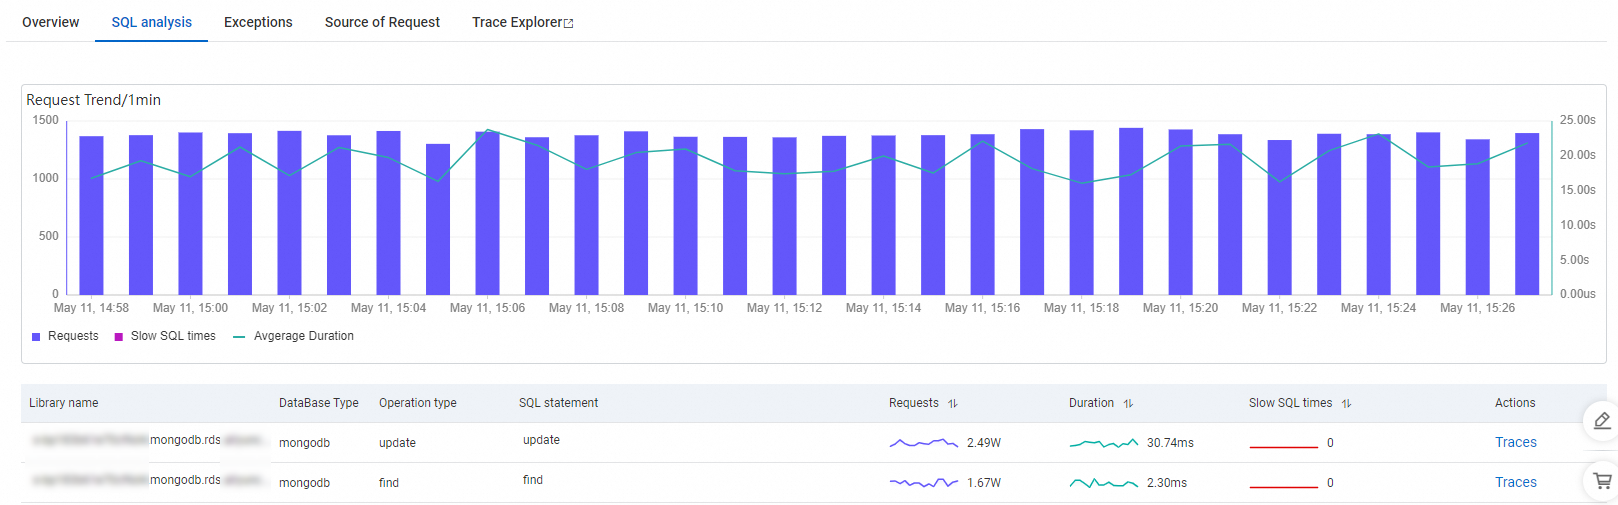
The SQL analysis tab helps you find and investigate slow or problematic queries. It displays:
Request trends for the selected database instance, including the number of requests, slow SQL queries, and average response time.
A detailed table of SQL query statistics.
To trace a specific SQL statement, click Traces in the Actions column. See Trace Explorer.
Typical workflow:
Sort the SQL statistics table by Avg response time (descending) to surface the slowest queries.
Compare a slow query's request count with its average response time to assess impact -- a slow query called thousands of times has greater impact than one called occasionally.
Click Traces to inspect individual executions and identify whether slowness is consistent or intermittent.
Exceptions
The Exceptions tab lists all exceptions reported when your application calls the selected database instance. Each entry shows the exception count and details for the specified time range.
Use this tab to identify recurring database errors and investigate their root causes. For example, if a connection timeout exception spikes at a specific time, correlate it with the Overview tab's request volume to determine whether the issue stems from traffic overload or a configuration problem.
For more details, see Exception analysis.

Source of request
The Source of Request tab shows which upstream operations are calling this database. It displays time-series curves for:
Response time
Number of requests
Number of errors
This tab helps you trace performance issues back to the specific service or operation that triggers the database calls. For example, if a database shows elevated response times, the Source of Request tab reveals whether the load comes from a single high-volume API endpoint or is distributed across multiple services, guiding where to focus optimization.
Trace Explorer
Trace Explorer lets you analyze trace details by combining filter conditions and aggregation dimensions in real time. Use it to diagnose specific requests or build custom queries across multiple dimensions.
For details, see Trace Explorer.

Set up alerts
To prevent errors from being diagnosed only after they occur, you can create alert rules for one or all operations. When a condition is met, the system sends notifications to your operations team automatically.
For instructions, see Create an alert rule.