Evaluates a clustering model's performance using raw data and clustering results to generate evaluation metrics.
Limitations
This component's visualization reports are available only in the original Machine Learning Studio.
Background information
The Calinski-Harabasz index, also known as the Variance Ratio Criterion (VRC), is an evaluation metric calculated using the following formula.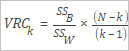
|
Parameter |
Description |
|
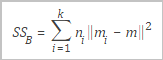
SSB |
The variance between clusters, defined as follows.
|
|
SSW |
The variance within clusters, defined as follows.
|
|
N |
The total number of records. |
|
k |
The number of cluster centers. |
 Where:
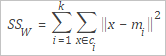 Where:
Component configuration
You can configure the clustering model evaluation component by using either of the following methods.
Method 1: GUI
Configure the component parameters on the Machine Learning Designer pipeline page.
|
Tab |
Parameter |
Description |
|
Field Settings |
Evaluation Columns |
The columns to evaluate. |
|
Input is Sparse Format |
Specifies whether the input data is in a sparse key-value (KV) format. |
|
|
Key-Value Pair Delimiter |
Defaults to a comma (,). |
|
|
Key-Value Inner Delimiter |
Defaults to a colon (:). |
|
|
Execution Tuning |
Number of Cores |
Use with Memory per Core. Must be a positive integer. |
|
Memory per Core |
Use with Number of Cores. Unit: MB. |
Method 2: PAI command
Run a PAI command in the SQL Script component to configure the component parameters. For more information, see SQL Script.
PAI -name cluster_evaluation
    -project algo_public
    -DinputTableName=pai_cluster_evaluation_test_input
    -DselectedColNames=f0,f3
    -DmodelName=pai_kmeans_test_model
-DoutputTableName=pai_ft_cluster_evaluation_out;|
Parameter |
Required |
Description |
Default |
|
inputTableName |
Yes |
The name of the input table. |
None |
|
selectedColNames |
No |
The columns in the input table to evaluate. To specify multiple columns, separate their names with commas (,). |
All columns |
|
inputTablePartitions |
No |
The partitions of the input table to use for evaluation. The following formats are supported:
Note
If you specify multiple partitions, separate them with commas (,). |
The entire table |
|
enableSparse |
No |
Specifies whether the input data is in sparse format. Valid values: |
false |
|
itemDelimiter |
No |
The delimiter between key-value pairs in sparse format. |
A comma (,). |
|
kvDelimiter |
No |
The delimiter between a key and a value in sparse format. |
A colon (:). |
|
modelName |
Yes |
The input clustering model. |
None |
|
outputTableName |
Yes |
The output table. |
None |
|
lifecycle |
No |
The lifecycle of the output table. |
None |
Example
-
Use an SQL statement to generate test data.
create table if not exists pai_cluster_evaluation_test_input as select * from ( select 1 as id, 1 as f0,2 as f3 union all select 2 as id, 1 as f0,3 as f3 union all select 3 as id, 1 as f0,4 as f3 union all select 4 as id, 0 as f0,3 as f3 union all select 5 as id, 0 as f0,4 as f3 )tmp; -
Use a PAI command to create a clustering model. This example uses k-means clustering.
PAI -name kmeans -project algo_public -DinputTableName=pai_cluster_evaluation_test_input -DselectedColNames=f0,f3 -DcenterCount=3 -Dloop=10 -Daccuracy=0.00001 -DdistanceType=euclidean -DinitCenterMethod=random -Dseed=1 -DmodelName=pai_kmeans_test_model -DidxTableName=pai_kmeans_test_idx -
Use a PAI command to run the clustering model evaluation component.
PAI -name cluster_evaluation -project algo_public -DinputTableName=pai_cluster_evaluation_test_input -DselectedColNames=f0,f3 -DmodelName=pai_kmeans_test_model -DoutputTableName=pai_ft_cluster_evaluation_out; -
View the output table pai_ft_cluster_evaluation_out. After the component runs, the output table contains a
calinharavalue of3, acenterCountvalue of3, and acountvalue of5. The following table describes the fields in the output table.Field
Description
count
The total number of records.
centerCount
The number of cluster centers.
calinhara
The Calinski-Harabasz index.