A confusion matrix is used in supervised learning and corresponds to a matching matrix in unsupervised learning. In performance evaluation, a confusion matrix compares classification results with actual values and displays the classification accuracy in a matrix. This topic describes how to configure the Confusion Matrix component.
Limitations
The only supported computing engine is MaxCompute.
Component configuration
You can configure the Confusion Matrix component using one of the following methods.
Method 1: Use the UI
Configure the component parameters on the pipeline page in Machine Learning Designer.
|
Parameter |
Description |
|
Original Label Column |
Supports numeric data types. |
|
Prediction Result Label Column |
This parameter is required if Threshold is not specified. |
|
Threshold |
A sample is considered positive if its value is greater than this threshold. |
|
Prediction Result Detail Column |
This parameter cannot be used with the Prediction Result Label Column parameter. This parameter is required if Threshold is specified. |
|
Positive Sample Label |
This parameter is required if Threshold is specified. |
Method 2: Use a PAI command
You can use a PAI command to configure the component parameters. You can run PAI commands by using the SQL Script component. For more information, see SQL script.
-
Threshold not specified
pai -name confusionmatrix -project algo_public -DinputTableName=wpbc_pred -DoutputTableName=wpbc_confu -DlabelColName=label -DpredictionColName=prediction_result; -
Threshold specified
pai -name confusionmatrix -project algo_public
    -DinputTableName=wpbc_pred
    -DoutputTableName=wpbc_confu
    -DlabelColName=label
    -DpredictionDetailColName=prediction_detail
    -Dthreshold=0.8
    -DgoodValue=N;
|
Parameter |
Required |
Description |
Default |
|
inputTableName |
Yes |
The name of the input table, which is the output table from a prediction component. |
N/A |
|
inputTablePartition |
No |
The partition of the input table. |
The entire table |
|
outputTableName |
Yes |
The name of the output table to store the confusion matrix. |
N/A |
|
labelColName |
Yes |
The name of the original label column. |
N/A |
|
predictionColName |
No |
The name of the prediction result column. This parameter is required if threshold is not specified. |
N/A |
|
predictionDetailColName |
No |
The name of the prediction result detail column. This parameter is required if threshold is specified. |
N/A |
|
threshold |
No |
The threshold for classifying positive samples. |
0.5 |
|
goodValue |
No |
The label value that corresponds to a positive outcome in binary classification. This parameter is required if threshold is specified. |
N/A |
|
coreNum |
No |
The number of cores for computing. |
Automatically allocated |
|
memSizePerCore |
No |
The amount of memory for each core, in MB. |
Automatically allocated |
|
lifecycle |
No |
The lifecycle of the output table. |
N/A |
Example
-
Use a MaxCompute client to create a table named test_data with the following columns:
id bigint, label string, prediction_result string. To learn how to install and configure a MaxCompute client, see Connect by using a local client (odpscmd). To create a table, see Create a table. -
Import the following sample data into the test_data table. To learn how to import data, see Import data.
id
label
prediction_result
0
A
A
1
A
B
2
A
A
3
A
A
4
B
B
5
B
B
6
B
A
7
B
B
8
B
A
9
A
A
-
Build a pipeline and run the components. For more information, see Algorithm modeling.
-
In the component list on the left side of Machine Learning Designer, search for the Read Table and Confusion Matrix components, and drag them to the canvas.
-
Connect the components to build a pipeline.
-
Configure the component parameters.
-
Click the Read Table-1 component on the canvas. On the Select Table tab in the right-side pane, set Table Name to test_data.
-
Click the Confusion Matrix-1 component on the canvas. In the right pane, configure the parameters as shown in the following table. Leave the other parameters at their default values.
Parameter
Description
Original Label Column
Select the label column.
Prediction Result Label Column
Enter prediction_result.
-
-
After you configure the parameters, click the Run button
 to run the pipeline.
-
-
When the pipeline finishes, right-click the Confusion Matrix-1 component and select Visual Analysis from the shortcut menu to view the output.
-
Click the Confusion Matrix tab to view the resulting confusion matrix.
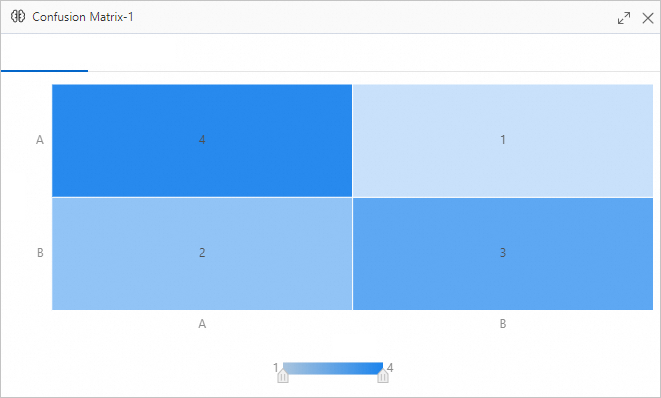
-
Click the Statistics tab to view the model statistics.
The statistics include TruePositive, FalsePositive, Accuracy, Precision, Recall, and F1 score. For example, for Model A, the respective metric values are 4, 2, 0.7, 0.6667, 0.8, and 0.7273. For Model B, the respective metric values are 3, 1, 0.7, 0.75, 0.6, and 0.6667.
-
Related Topics
-
For more information about components in Machine Learning Designer, see Overview of Machine Learning Designer.
-
Machine Learning Designer provides a variety of algorithm components. You can select the appropriate components for data processing based on your use case. For more information, see Component Reference.