As business data volumes surge, many enterprises face the core challenges of managing massive data storage costs and maintaining analytical efficiency. To address this, PolarDB for MySQL provides the X-Engine columnar table feature. This feature is built on columnar storage, efficient compression, and parallel computing to reduce your data storage cost to 10% of the original data size and improves analytical query performance by an order of magnitude. It enables low-cost, large-scale data archiving and high-performance, real-time analytics, all while maintaining full compatibility with the MySQL ecosystem.
Overview
X-Engine columnar tables use an architecture based on the separation of compute and storage. This allows compute and storage resources to scale independently and elastically, delivering petabyte-level data processing capabilities. The storage layer is built on a distributed file system and OSS. The compute layer delivers high-performance analytics by deeply optimizing the query optimizer, execution operators, and storage engine.
Technical architecture
PolarDB overall architecture
PolarDB uses an architecture with separation of compute and storage, built on a distributed storage layer. The system uses the ParallelRaft protocol to ensure multi-replica consistency and transparently supports OSS. Compute nodes consist of one read-write node (RW) and one or more read-only nodes (RO), supporting both the InnoDB and X-Engine engines. A database proxy acts as a bridge between applications and compute nodes, providing read/write splitting and load balancing.

Columnar table architecture
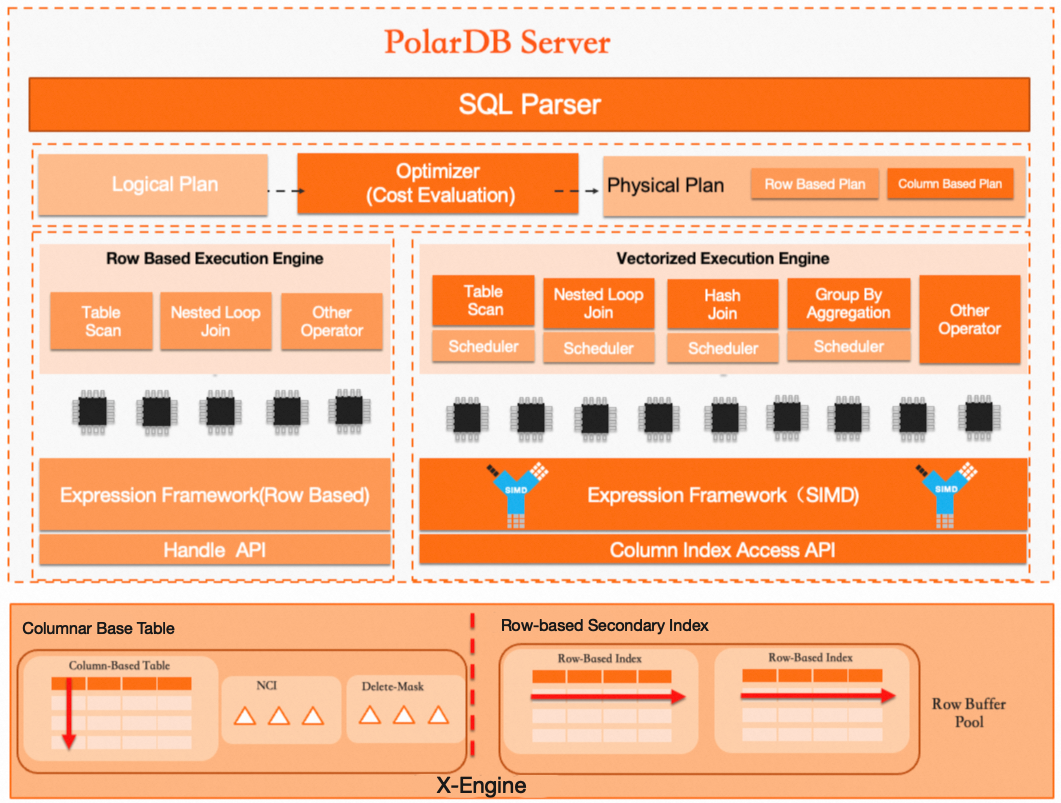
Its core technical components include:
Query optimizer: A built-in cost-based optimizer (CBO) for mixed row-column storage. It estimates the query cost and automatically selects the optimal execution plan, choosing between row or column storage.
Execution operator: Uses column-oriented vectorization and parallel execution techniques. Batch processing significantly accelerates analytical queries on both single tables and multi-table joins.
Storage engine: Supports real-time transactional updates. The main table uses columnar storage and leverages a Non-Clustered Index (NCI) component to provide fast update capabilities. A delete-mask mechanism flags data for deletion, allowing for efficient parallel queries without impacting real-time writes. Additionally, its row-store secondary indexes can quickly filter out irrelevant data, further improving query efficiency.
Comparison of table types
The following table compares the key differences between traditional row-oriented tables (such as InnoDB) and PolarDB columnar tables to help you choose the appropriate type:
Aspect | Row-oriented table (X-Engine) | Columnar table |
Data organization | Data is stored contiguously by row. All columns for a single row are stored together. | Data is stored contiguously by column. All values for a single column are stored together. |
Data compression ratio | Medium. Compared to InnoDB, data can be compressed to 3/10 of its original size. | High. With columnar storage and specialized encoding (such as dictionary encoding), data can be compressed to 1/10 of its original size compared to InnoDB. |
Query performance | Excellent for point lookups. Well-suited for Online Transaction Processing (OLTP) scenarios that involve reading single or few rows quickly based on a primary key or index. | Strong for analytics. Queries read only relevant columns, which significantly reduces I/O. Combined with vectorized parallel computing, analytical performance is an order of magnitude higher than that of row-oriented tables. |
Update and delete performance | High. Directly locates and modifies rows. | Relatively lower, but supports real-time updates. The NCI component helps quickly locate records to be modified. |
Use cases | Online Transaction Processing (OLTP), such as high-concurrency insert, delete, update, and query operations. | Online Analytical Processing (OLAP), such as data archiving, report generation, ad-hoc queries, and large-scale aggregate data analysis. |
Benefits
Cost-effectiveness: Reduces storage and processing costs for massive datasets by up to 90% through a combination of columnar storage, efficient encoding, high-compression algorithms, and low-cost storage media like OSS.
High-performance real-time analytics: Data is available for analytical queries immediately after being written. By leveraging multi-core parallelism, vectorization, and Massively Parallel Processing (MPP) technology, query performance is comparable to dedicated analytical databases, meeting strict real-time analysis demands.
100% MySQL compatible: Provides a data type system and protocol consistent with MySQL and supports flexible type conversions. You can connect your existing applications and tools without modification.
Independent elastic scaling: The separation of compute and storage enables independent, on-demand scaling of compute nodes and storage space to handle business peaks and data growth.
Powerful wide-table support: A single table can support up to 10,000 columns, meeting business requirements for wide-table storage and high-concurrency writes.
Excellent usability: Simplifies your technology stack and operational management by supporting both high-compression storage and high-performance analytics within a single database engine, with full support for DDL and DML operations.
Use cases
Low-cost data archiving
Pain point: As businesses grow, historical data such as past orders, logs, and transaction records can rapidly accumulate in core databases, consuming expensive storage space. While traditional data migration solutions can reduce costs, they often take data offline, making online access complex.
Solution: Use columnar tables for online data archiving. You can migrate cold data from row-oriented tables (InnoDB) or entire historical data tables to columnar tables within the same PolarDB cluster.
Core value:
Drastically lower costs: With a compression ratio of up to 10:1 and the use of low-cost storage media like OSS, storage costs can be reduced by up to 90%.
Online data availability: Archived data remains online and available. You can query and analyze it at any time using standard SQL without a complex data migration process.
Seamless application integration: From the application's perspective, a columnar table functions just like a regular MySQL table, requiring no code changes.
Dedicated data warehouse
Pain point: When building a dedicated data warehouse, enterprises often face high hardware costs, complex data synchronization pipelines (ETL), and a steep operational learning curve, especially when introducing new technologies like ClickHouse.
Solution: You can leverage the massive storage capacity of PolarStore to aggregate data from multiple upstream sources and store it uniformly in X-Engine columnar tables. This allows you to benefit from massive, low-cost storage and real-time aggregate analysis performance.
Core value:
Lower cost and complexity: Build a data warehouse within the familiar MySQL ecosystem without purchasing expensive dedicated hardware or introducing heterogeneous analytical systems. This approach simplifies your tech stack and reduces operational overhead.
Real-time data analysis: Supports real-time consolidation of upstream data into columnar tables for analysis, avoiding the T+1 data latency common in traditional ETL solutions.
Massive data processing capacity: The X-Engine storage architecture and efficient compression enable low-cost storage and processing of petabyte-scale data.
Federated query analysis
Pain point: Business data is often split across different systems. Some data resides in online databases like PolarDB, while other data is stored in open formats like Parquet or ORC on OSS. Analyzing these disparate datasets together typically requires a complex ETL process to import the OSS data into the database.
Solution: Use the PolarDB foreign table feature to directly query data on OSS.
Core value:
In-place analysis: Query data where it lives. Create a foreign table in PolarDB that points to your files on OSS, and then use standard SQL to query them directly without moving or importing the data.
Federated query: Easily perform
JOINoperations between local tables in PolarDB (either row-oriented or columnar) and OSS foreign tables to run unified analysis across online and offline data.
Performance
The following performance data was obtained in a specific test environment and serves as a reference for evaluating the benefits of columnar tables.
The TPC-H implementation in this topic is based on the TPC-H benchmark, but the results are not comparable to published TPC-H benchmark results because these tests do not fully comply with the TPC-H specification.
Data loading performance
The following data is based on a test environment with 32 cores and 256 GB of memory. It compares the data loading and storage performance of columnar tables with ClickHouse and Doris using the TPC-H and Airline datasets.
Loading speed
TPC-H dataset: The loading speed for columnar tables reached 5.71 million rows/second, with a write throughput of 50 GB/min, approximately 2.7 times that of ClickHouse.
Airline dataset: The loading speed for columnar tables reached 4.3 million rows/second, with a write throughput of 27 GB/min, approximately 2 times that of ClickHouse.
Dataset | ClickHouse (million rows/sec) | Doris (million rows/sec) | Columnar table (million rows/sec) |
TPC-H | 2.10 | 4.54 | 5.71 |
Airline | 1.40 | 2.15 | 4.30 |
Storage footprint
TPC-H dataset: With 100 GB of raw data, columnar tables achieved a 4x compression ratio.
Airline dataset: With 75 GB of raw data, columnar tables achieved an 18x compression ratio.
The following table compares the storage footprint for the 75 GB Airline dataset:
Type/Product | ClickHouse | Doris | Columnar table |
Storage footprint (GB) | 9.29 | 4.49 | 3.97 |
Compression ratio | Approx. 8x | Approx. 16x | Approx. 18x |
TPC-H query performance
In a performance test using the TPC-H 100 GB dataset, the total time for a columnar table to execute all 22 queries was 17.994 seconds, compared to 76.9 seconds for ClickHouse. The overall performance of the columnar table was approximately 4.3 times higher than that of ClickHouse.
Query
Columnar table (seconds)
ClickHouse (seconds)
Q1
1.175
2.2
Q2
0.178
0.9
Q3
0.577
1.6
Q4
0.433
1.3
Q5
0.522
3.3
Q6
0.366
0.32
Q7
0.633
1.7
Q8
0.528
1.8
Q9
2.817
12
Q10
0.935
2.3
Q11
0.218
0.66
Q12
0.535
1.4
Q13
1.255
4.4
Q14
0.442
0.3
Q15
0.889
0.42
Q16
0.553
0.6
Q17
0.738
4.2
Q18
2.381
4.3
Q19
0.759
2
Q20
0.453
0.6
Q21
1.308
29.6
Q22
0.299
1
Total
17.994
76.9
Multi-node parallel analysis: In a performance test with the TPC-H 1 TB dataset, columnar tables used multi-node parallel acceleration, reducing the total query time from 1,420.551 seconds on a single node to 167.948 seconds on six nodes.
Query
1 node (seconds)
2 nodes (seconds)
4 nodes (seconds)
6 nodes (seconds)
Q1
76.849
36.831
23.031
20.022
Q2
5.841
2.805
1.527
1.09
Q3
133.69
26.131
15.833
4.75
Q4
51.466
19.02
3.353
2.362
Q5
52.965
26.844
13.715
4.269
Q6
34.577
21.831
35.17
11.274
Q7
75.996
29.659
17.279
5.717
Q8
54.989
28.922
15.651
3.375
Q9
155.33
78.216
40.38
25.983
Q10
72.222
31.659
17.177
4.594
Q11
4.149
2.049
1.351
1.069
Q12
50.997
27.79
16.207
2.977
Q13
73.009
31.742
17.605
16.255
Q14
36.887
22.093
4.475
3.778
Q15
66.217
38.628
7.583
6.451
Q16
11.493
4.49
2.528
1.758
Q17
59.225
37.101
11.434
8.767
Q18
132.604
53.578
17.164
10.797
Q19
72.794
38.416
23.759
16.651
Q20
42.621
22.432
5.62
4.768
Q21
149.245
54.803
12.758
8.793
Q22
7.385
5.684
2.972
2.448
Total
1420.551
640.724
306.572
167.948