Enable SQL Audit
The SQL Audit feature is disabled by default. You can enable it in the PolarDB-X 1.0 console. By default, SQL Audit analyzes only the log data that is generated after the feature is enabled. You can also import historical data.
Prerequisites
- Log on to the Simple Log Service console and activate Simple Log Service as prompted.
- You have purchased a dedicated PolarDB-X 1.0 instance and created a database.
- By default, only an Alibaba Cloud account can enable and use the SQL Audit feature. To allow a RAM user to use this feature, you must grant the required Simple Log Service permissions to the RAM user. For more information, see Grant SQL Audit permissions to a RAM user.
Background information
The SQL Audit feature is disabled by default. Enabling this feature incurs additional fees. For more information, see Billing methods. You can disable this feature in the PolarDB-X 1.0 console. After the feature is disabled, new SQL audit logs are no longer generated. However, you can still view historical data. Storage and indexing fees continue to apply to this historical data. To stop incurring these fees, you can delete the historical data by deleting its Logstore in the Simple Log Service console.
Procedure
- Log on to the PolarDB-X console and select a region.
- On the Instance List page, click the instance name.
- In the navigation pane on the left, click SQL Audit and Analysis.
- Expand the drop-down list and select the database for which you want to enable SQL Audit and Analysis.
- Turn on the SQL Audit Log switch.

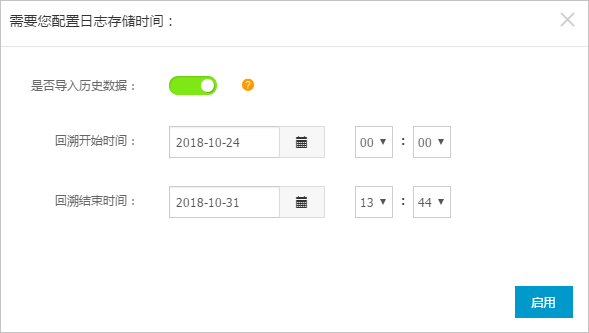
- Choose whether to import historical data and click Enable.
By default, SQL Audit analyzes only the log data that is generated after the feature is enabled.
- If you suspect that data in your PolarDB-X 1.0 database was tampered with before you enabled SQL Audit, you can import historical data when you enable the feature. This adds past log entries to the audit scope, which helps you trace the source of the data tampering. PolarDB-X 1.0 dynamically detects the range of importable historical data based on the logs stored on the instance nodes. You can import data from up to the last seven days.
- To import historical data, enable this feature, specify the backfill start and end times, and then click Enable. This feature dynamically checks the log timestamps on PolarDB-X 1.0 nodes, allowing you to import up to seven days of historical data. The import process involves file operations and may take some time to complete. You can monitor the log backfill progress in the task list in the upper-right corner of the console.
- If you do not need to import historical data, click Enable.
Results
The SQL Audit feature is enabled. Audit logs from PolarDB-X 1.0 databases in the same region are written to the same Logstore in Simple Log Service. Simple Log Service also creates the following default configurations.
| Default configuration | Configuration Content |
| Project | A Project named drds-audit-region_name-alibaba_cloud_account_id is created by default, for example, drds-audit-cn-qingdao-12345678. |
| Logstore | A Logstore named drds-audit-log is created by default. |
| Region | The audit logs of PolarDB-X 1.0 databases in the same region are written to the same Logstore in Simple Log Service. For example, the audit logs of all PolarDB-X 1.0 databases in all zones in the China (Hangzhou) region are written to the Logstore |
| Shard | By default, five shards are created and the Manage Shards feature is enabled. |
| Index | Simple Log Service automatically creates an index. Your index settings are automatically updated with feature upgrades. Do not manually modify or delete the index. |
| Log storage duration | By default, logs are stored for 30 days. Logs older than 30 days are automatically deleted. If you need a longer storage duration, you can customize this setting. For more information, see Advanced management. |
| Dashboard | Three default dashboards are created:
For more information about dashboards, see Log Reports. Note Do not modify the default dashboard configurations. The default dashboards are automatically updated with feature upgrades. You can also create custom dashboards. For more information, see Create a dashboard. |