Knative is a serverless application framework based on Kubernetes that provides a standard for cloud-native, serverless container orchestration. It helps you deploy and manage modern serverless workloads to build an enterprise-grade serverless container platform. Container Service for Kubernetes (ACK) has integrated Knative since its early versions and stays updated with the latest features from the Knative community. Combined with Alibaba Cloud products such as ACK, messaging, storage, networking, and monitoring, it delivers production-grade Knative capabilities. You can integrate Knative with Managed Service for Prometheus to monitor services and collect metrics, helping you improve service performance. This topic describes how to install the Knative component and enable monitoring for it with Managed Service for Prometheus.
Prerequisites
-
Managed Service for Prometheus is activated. For more information, see Prometheus instance billing.
-
A Kubernetes cluster is created. For more information, see Create an ACK managed cluster, Create an ACK dedicated cluster (discontinued), or Create an ACK Serverless cluster.
-
Knative is deployed. For more information, see Deploy and manage Knative components.
-
Resource Center is activated. For more information, see Activate Resource Center.
Procedure
Log on to the Managed Service for Prometheus console. In the left-side navigation pane, click Integration Center.
-
Click the Knative card and follow the on-screen instructions to complete the integration.
metrics collection interval (seconds):
The interval for collecting monitoring data. The default value is 15.
The installed component is displayed on the Integration Management page in the Managed Service for Prometheus console. The Integration Management page consists of the Integrated Environments, Integrated Addons, and Query Dashboards tabs, where you can view information such as targets, metrics, dashboards, and alerts.
The details page for the Knative observability add-on contains the Environment List, Dashboard List, and Alert List tabs. On the Dashboard List tab, select a target environment to view its dashboard, such as the Knative Serving dashboard.
View Knative dashboard data
On the Integrated Addons tab of the Integration Management page, click the Knative card to view detailed monitoring data.
The Knative dashboard in Managed Service for Prometheus displays metrics such as request count, pod count, response time, and concurrency.
-
Expand the Overview section to view data on request count, success rate, 4xx (client errors), and 5xx (server errors).
NoteThe
ops/secunit on the y-axis indicates requests per second.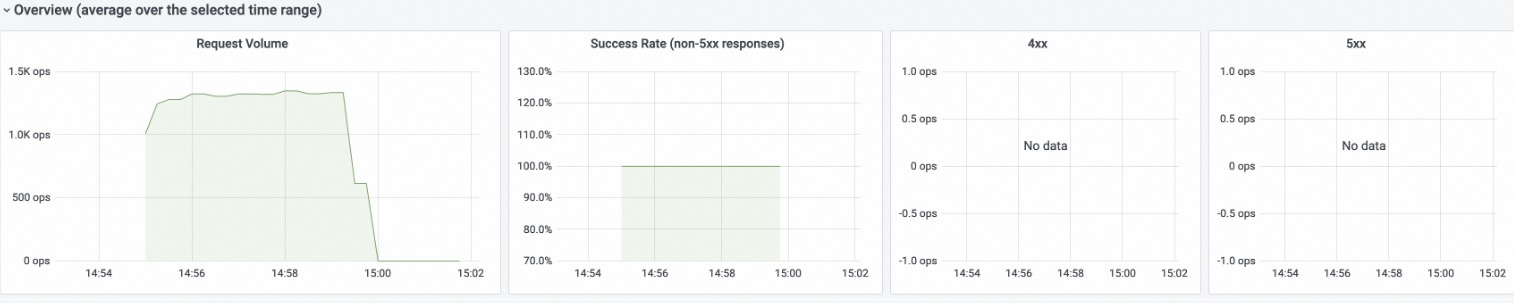
-
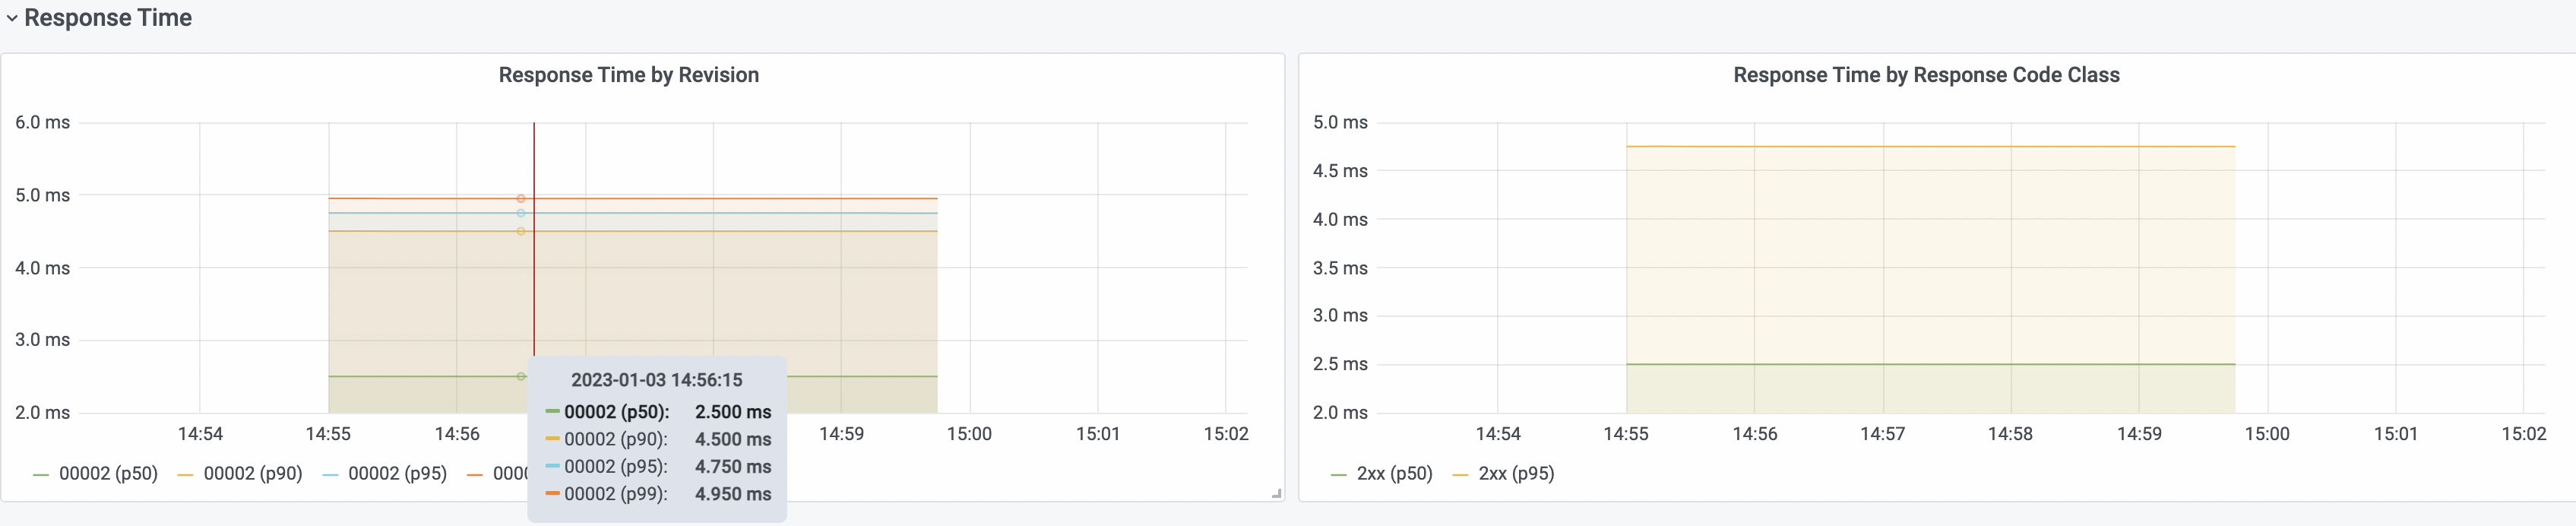
Expand the Response Time section to view response time data, including the P50, P90, P95, and P99 percentiles.
-
Expand the Autoscaler section to view data such as request concurrency.

-
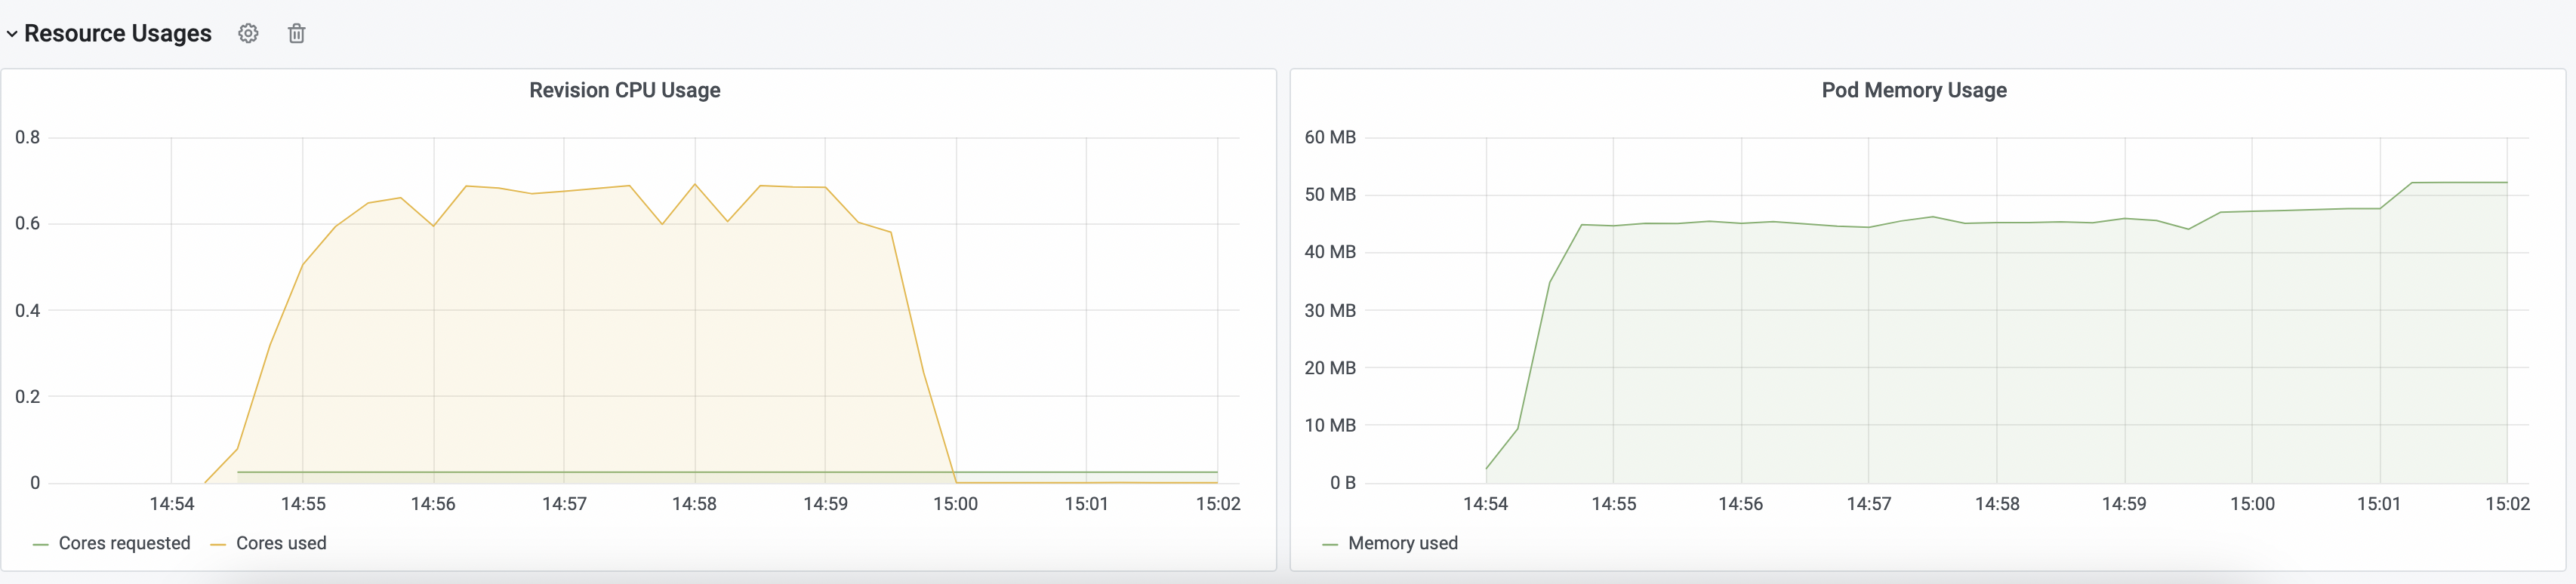
Expand the Resource Usages section to view resource usage information, including CPU and memory.
Key Knative metrics
|
Parameter |
Description |
|
|
The number of concurrent requests active in a pod at a given moment. |
|
|
The rate of requests per second for a pod. |
|
|
The latency of requests for a revision. |
|
|
The total number of requests made to a revision. |