Linkage, drill-down, and redirection
Data dashboards combine visualization with narrative storytelling. They provide linkage, drill-down, and redirection features to enable interactive analysis of multi-dimensional data. This topic describes the use cases and configuration methods for these three features.
Prerequisites
You have created a data dashboard. For more information, see Create a data dashboard.
You have created a dataset. For more information, see Create a dataset.
Limitations
Charts support interactive analysis, but layers do not.
The following charts do not support these features: Digital Flipper, Threshold Flipper, progress bar, circular progress bar.
Feature overview
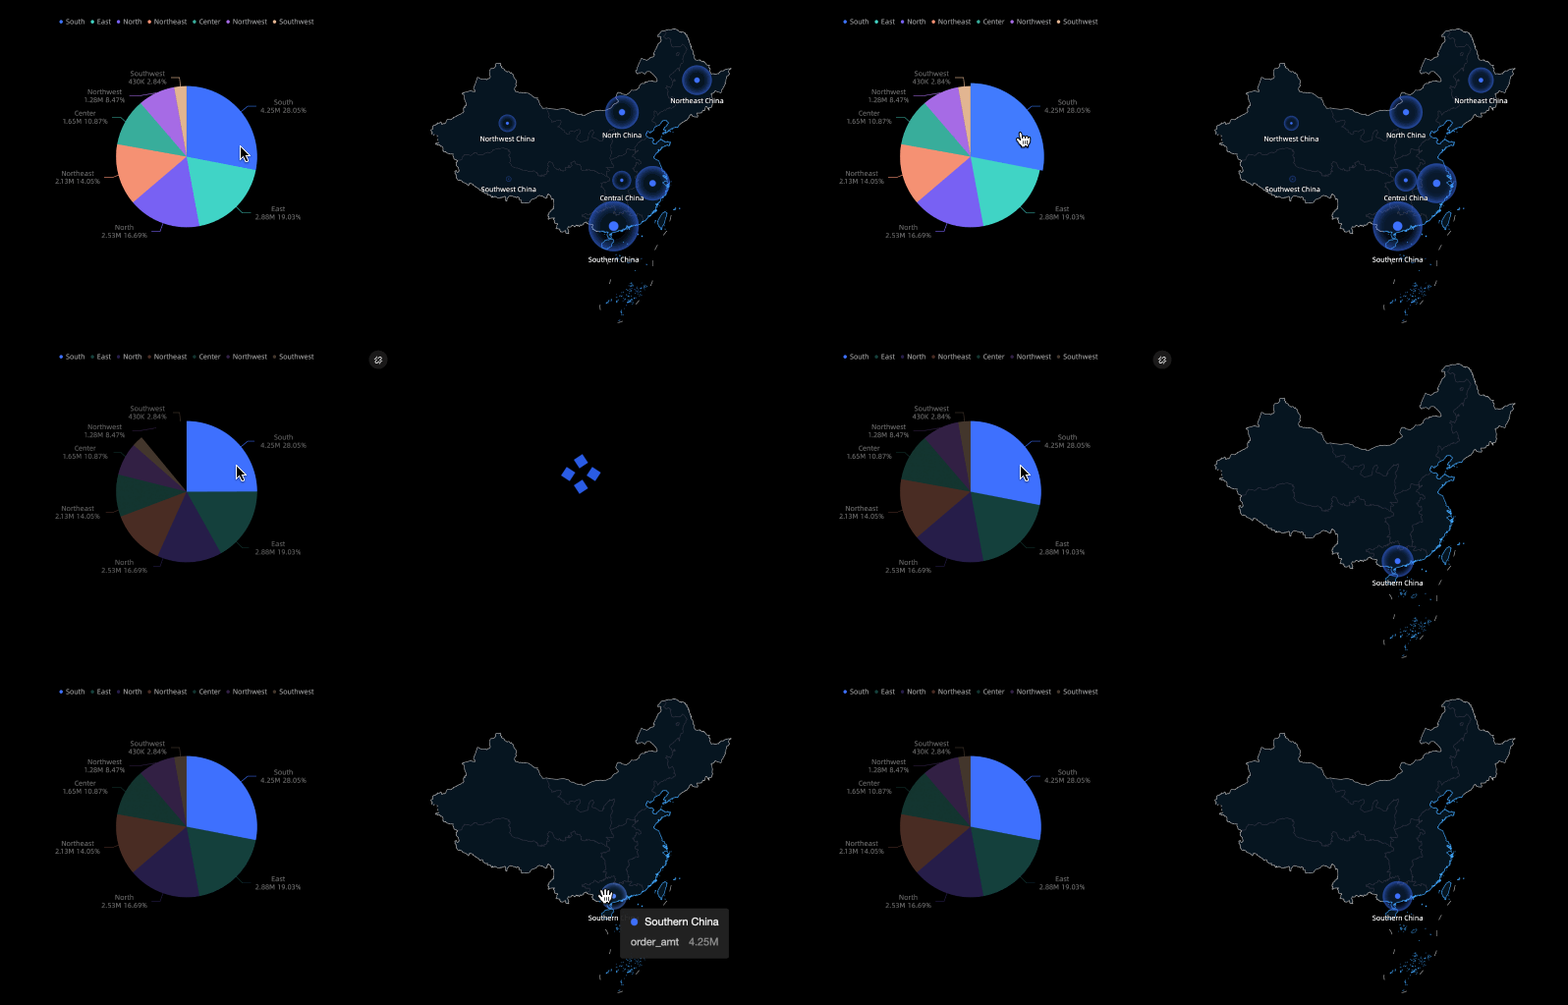
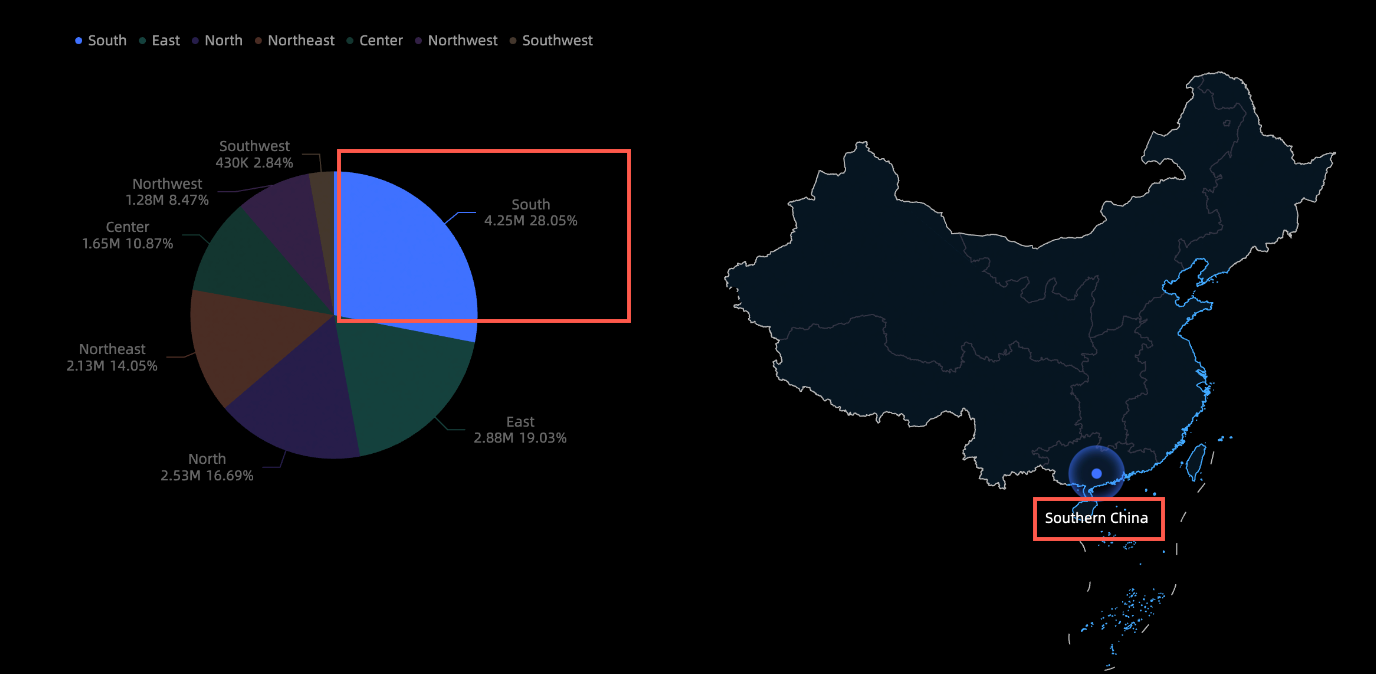
Linkage: When you click a field in a chart on a data dashboard, the content of other related charts on the same page updates accordingly. For example, if you click East China in a pie chart, the corresponding map updates to display data only for East China.
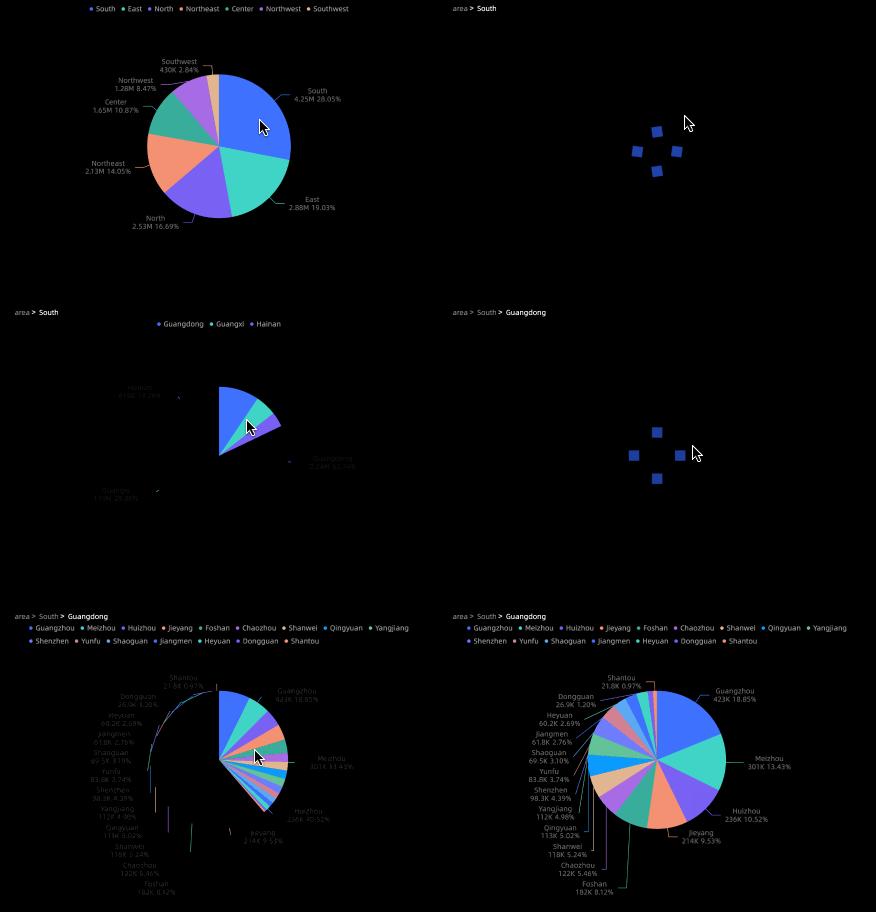
Drill-down: When you click a specific area or field in a chart, the dimension hierarchy changes, allowing you to analyze data at a different level of granularity. For example, you can click East China in a pie chart to view data for its corresponding provinces. Clicking the Zhejiang province then displays data for its corresponding cities.
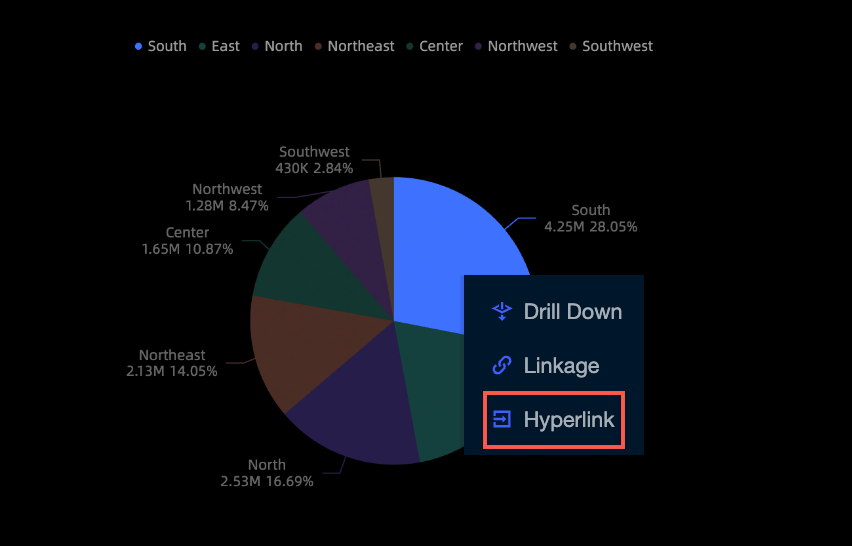
Redirection: Clicking a field in a chart redirects you to another resource that is associated with the selected data, such as a dashboard or spreadsheet. Redirection can be internal within Quick BI or to an external link. Internal redirection requires the use of global parameters.
Configure linkage
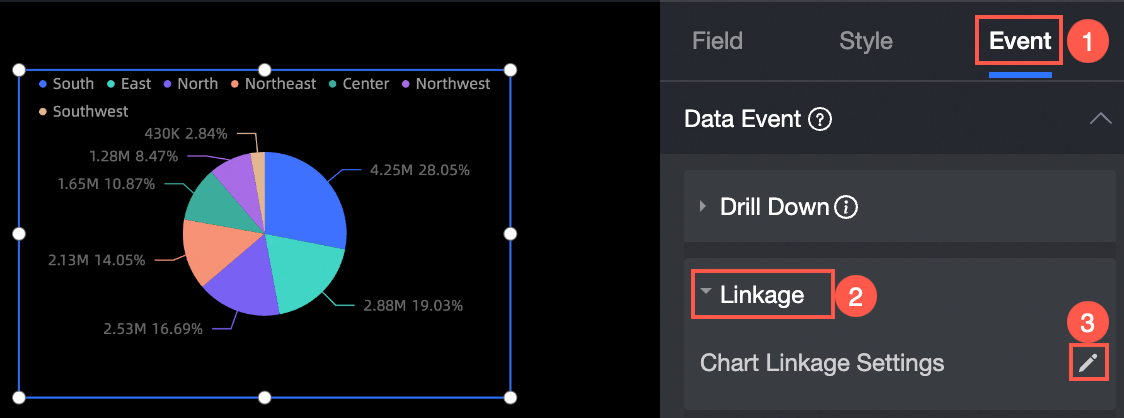
On the Events tab of the pie chart, select Linkage under Data Event, and then click the pencil icon next to Chart Linkage Configurations.
On the Chart Linkage Settings page, select the dimension field to link (area), and then associate the charts.
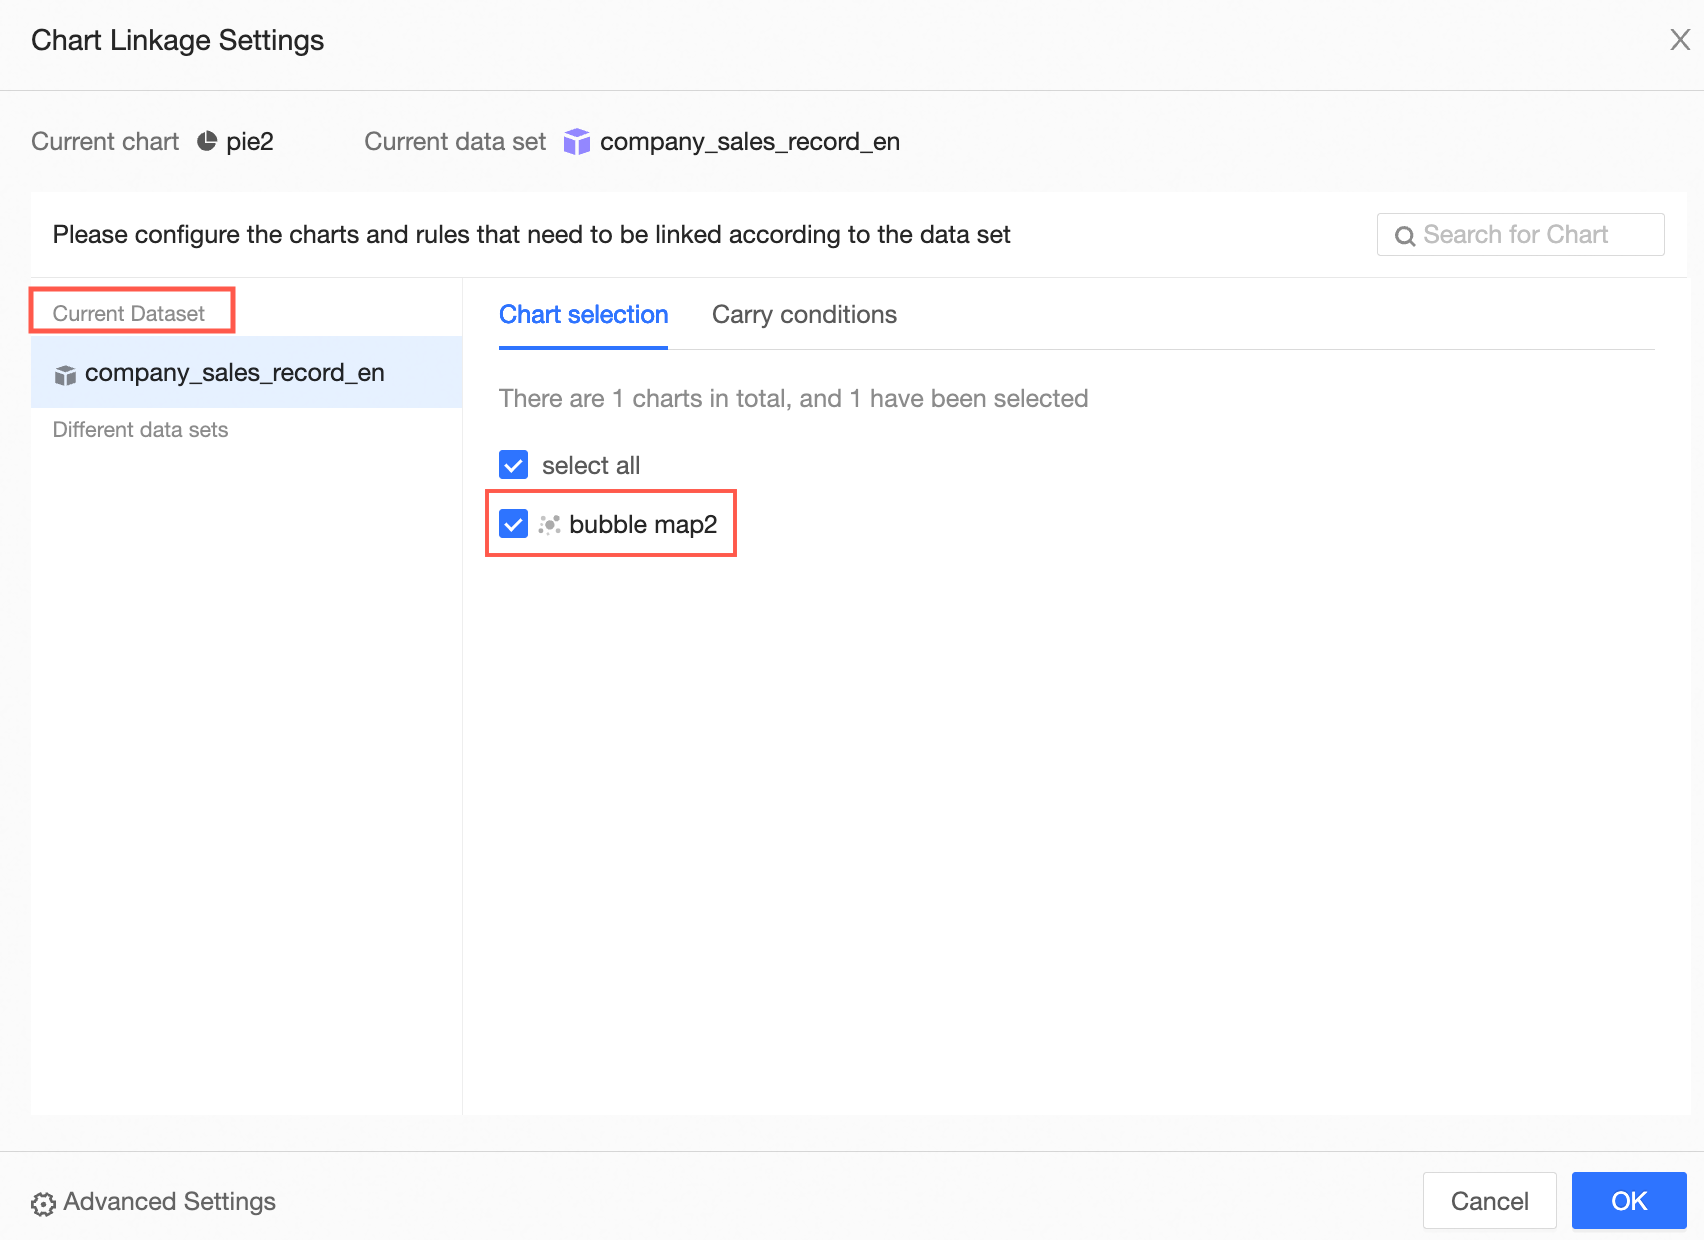
You can associate charts that use the same dataset or a different dataset.
If they use the same dataset, go to the Same Dataset tab, select Bubble Map 2, and click OK.
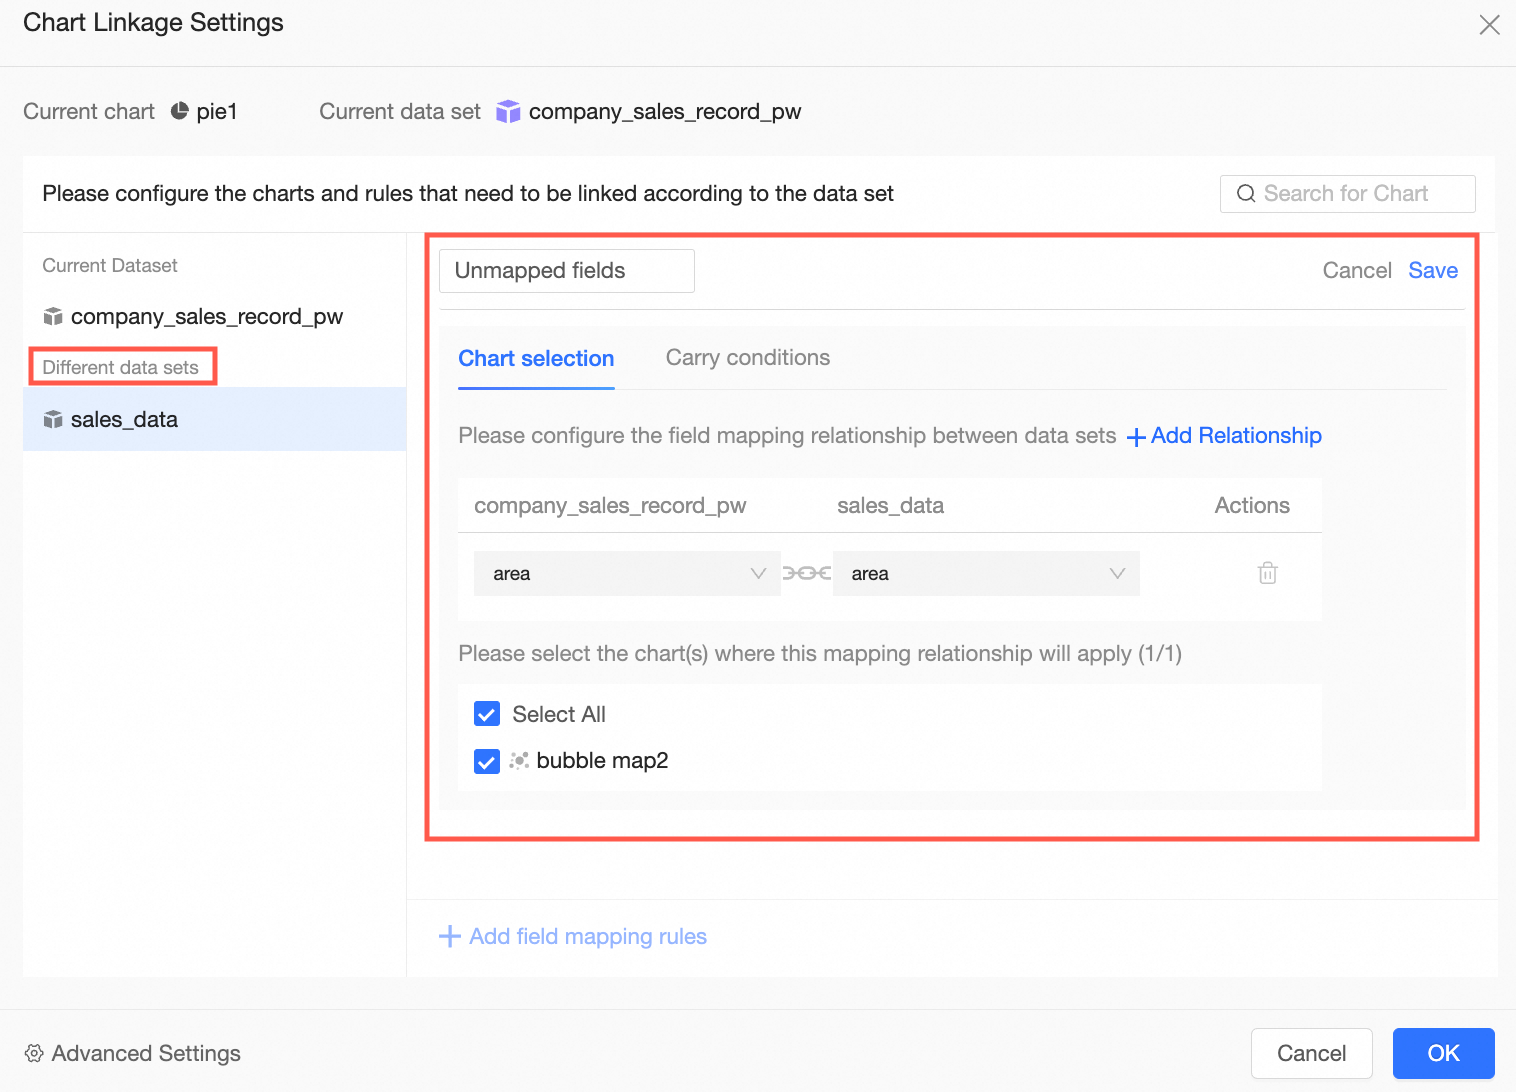
If they use different datasets, go to the Different Datasets tab, select Bubble Map 2, choose Region as the associated field, and click OK.

In the pie chart, click the East China sector.
The Bubble Map updates to display data for the East China region.
NoteYou can click the
icon in the upper-right corner of the pie chart to Cancel linkage.If drill-down is already configured for the linked dimension, you can select Take effect at the same time or Select linkage or drill-down on the displayed layer.
 icon in the upper-right corner of the pie chart to Cancel linkage.
Configure drill-down
The drill-down feature requires manual configuration. The following steps use a pie chart as an example.
On the Fields tab for the pie chart, click the
icon to the right of the target dimension.Set the drill-down hierarchy.
In this example, the drill-down order is area > province > city.
You can also perform the following operations:
Add a drill-down dimension: Drag the desired dimension field to the Drill-down/Dimension area and adjust its position in the hierarchy.
Change the drill-down order: In the Drill-down/Dimension area, drag a target field to a new position to change its order.
Delete a drill-down dimension: In the Drill-down/Dimension area, select a target field and click the
icon.
Click Update.
After you click an area in the chart, it drills down, as shown in the following figure.
 icon to the right of the target dimension.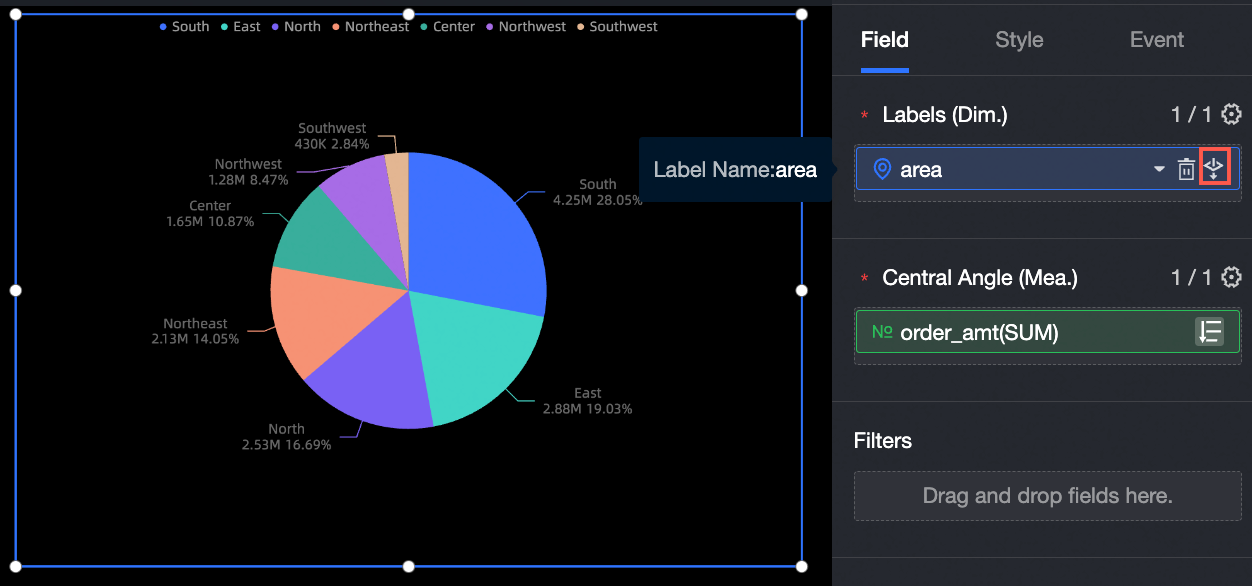
 icon.
icon.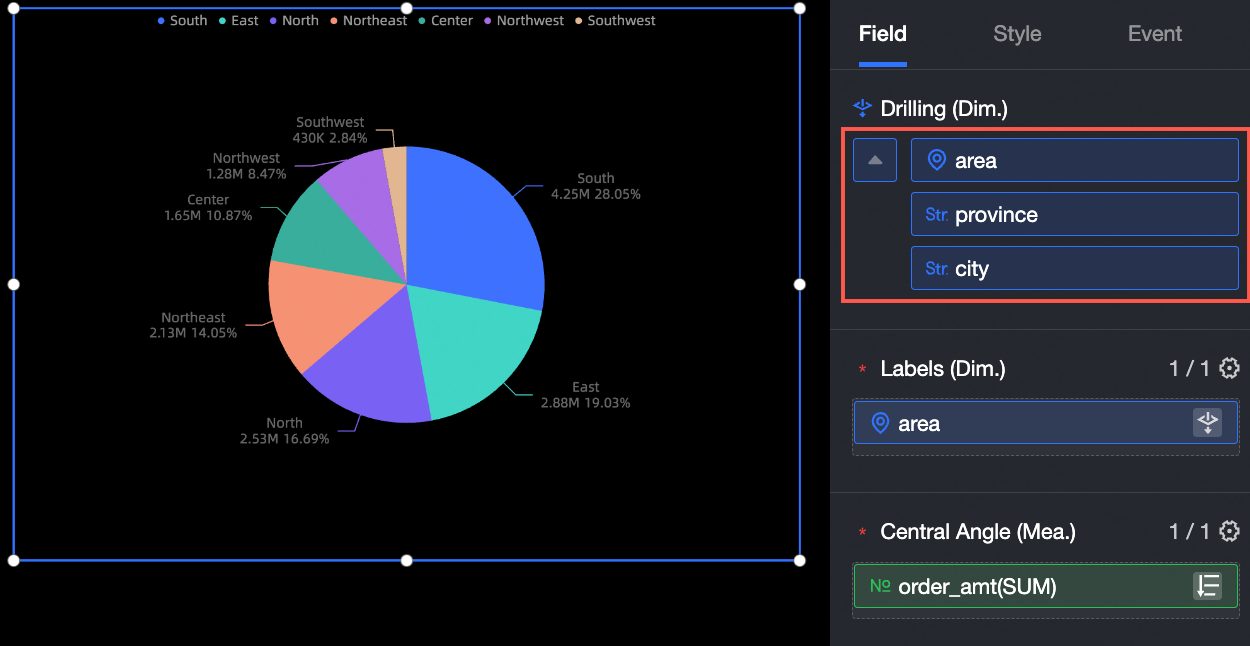
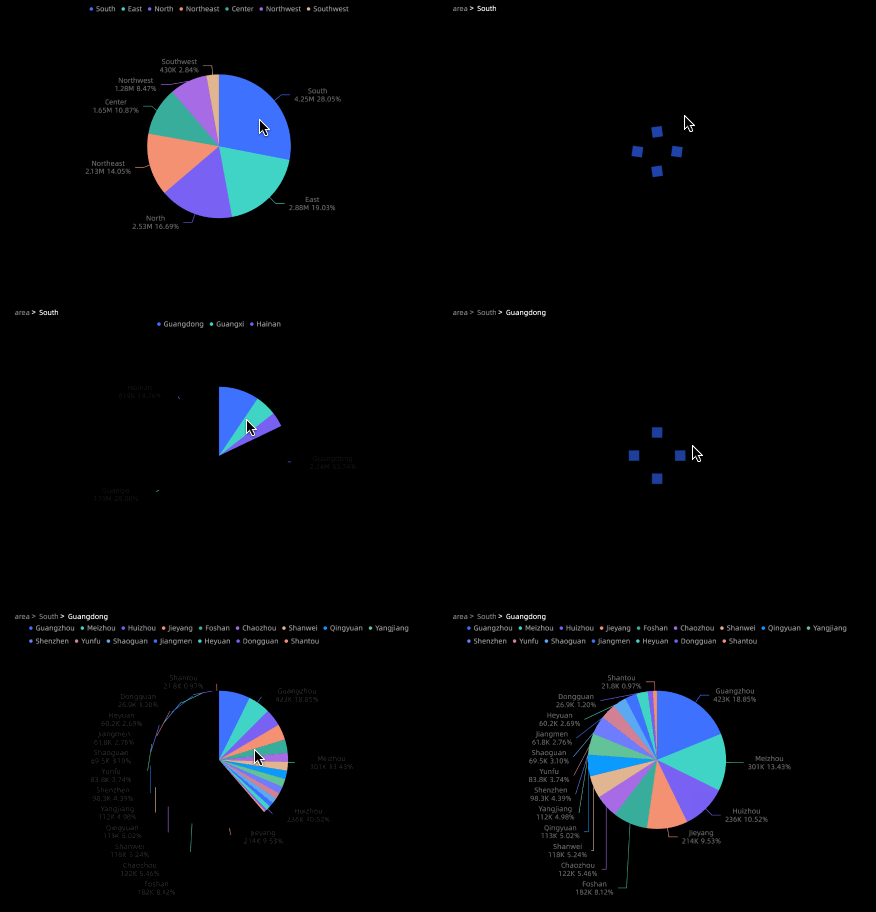
You can also go to the Events tab for the pie chart, select Drill-down under Data Event, and configure the Position, Text, and Current Level for the Display of drill-down level rows.

Configure redirection
While viewing data in a data dashboard, you can use the redirection feature to navigate to another resource—such as a dashboard, spreadsheet, or another data dashboard—to view detailed information about a specific field.
Procedure
The following example shows how to view data for December 2023 in a Sales Analysis data dashboard and then use redirection to view detailed profit information for a specific region.
Configure the global parameters for the target data dashboard in advance.
NoteThis example uses redirection with parameters, so you must first configure global parameters.
Before you configure global parameters, make sure that you have saved the data dashboard.
On the edit page of the Profit Analysis data dashboard, click the global parameters icon.
In the Global Parameters Configuration dialog box, associate the global parameters with the relevant interactive controls and charts.
Interactive control: Includes controls such as date pickers, drop-down lists, and tile buttons. When selected, the interactive control can receive a parameter value and affect the data displayed in the chart.
Chart: Includes visual charts and interactive controls. When configured here, a chart or interactive control receives a parameter value for itself only and does not affect other charts. For example, if a drop-down list is configured in the Chart section, it receives the parameter value for itself only and does not influence other charts.
In this example, the Sales Analysis data dashboard must pass a time parameter and a region parameter when redirecting to the Profit Analysis data dashboard. To do this, you must configure two global parameters in the Profit Analysis data dashboard: one named
dateto receive the time value and pass it to the date picker control, and another namedareato receive the region value and pass it to the chart control. The following figure shows the configuration.
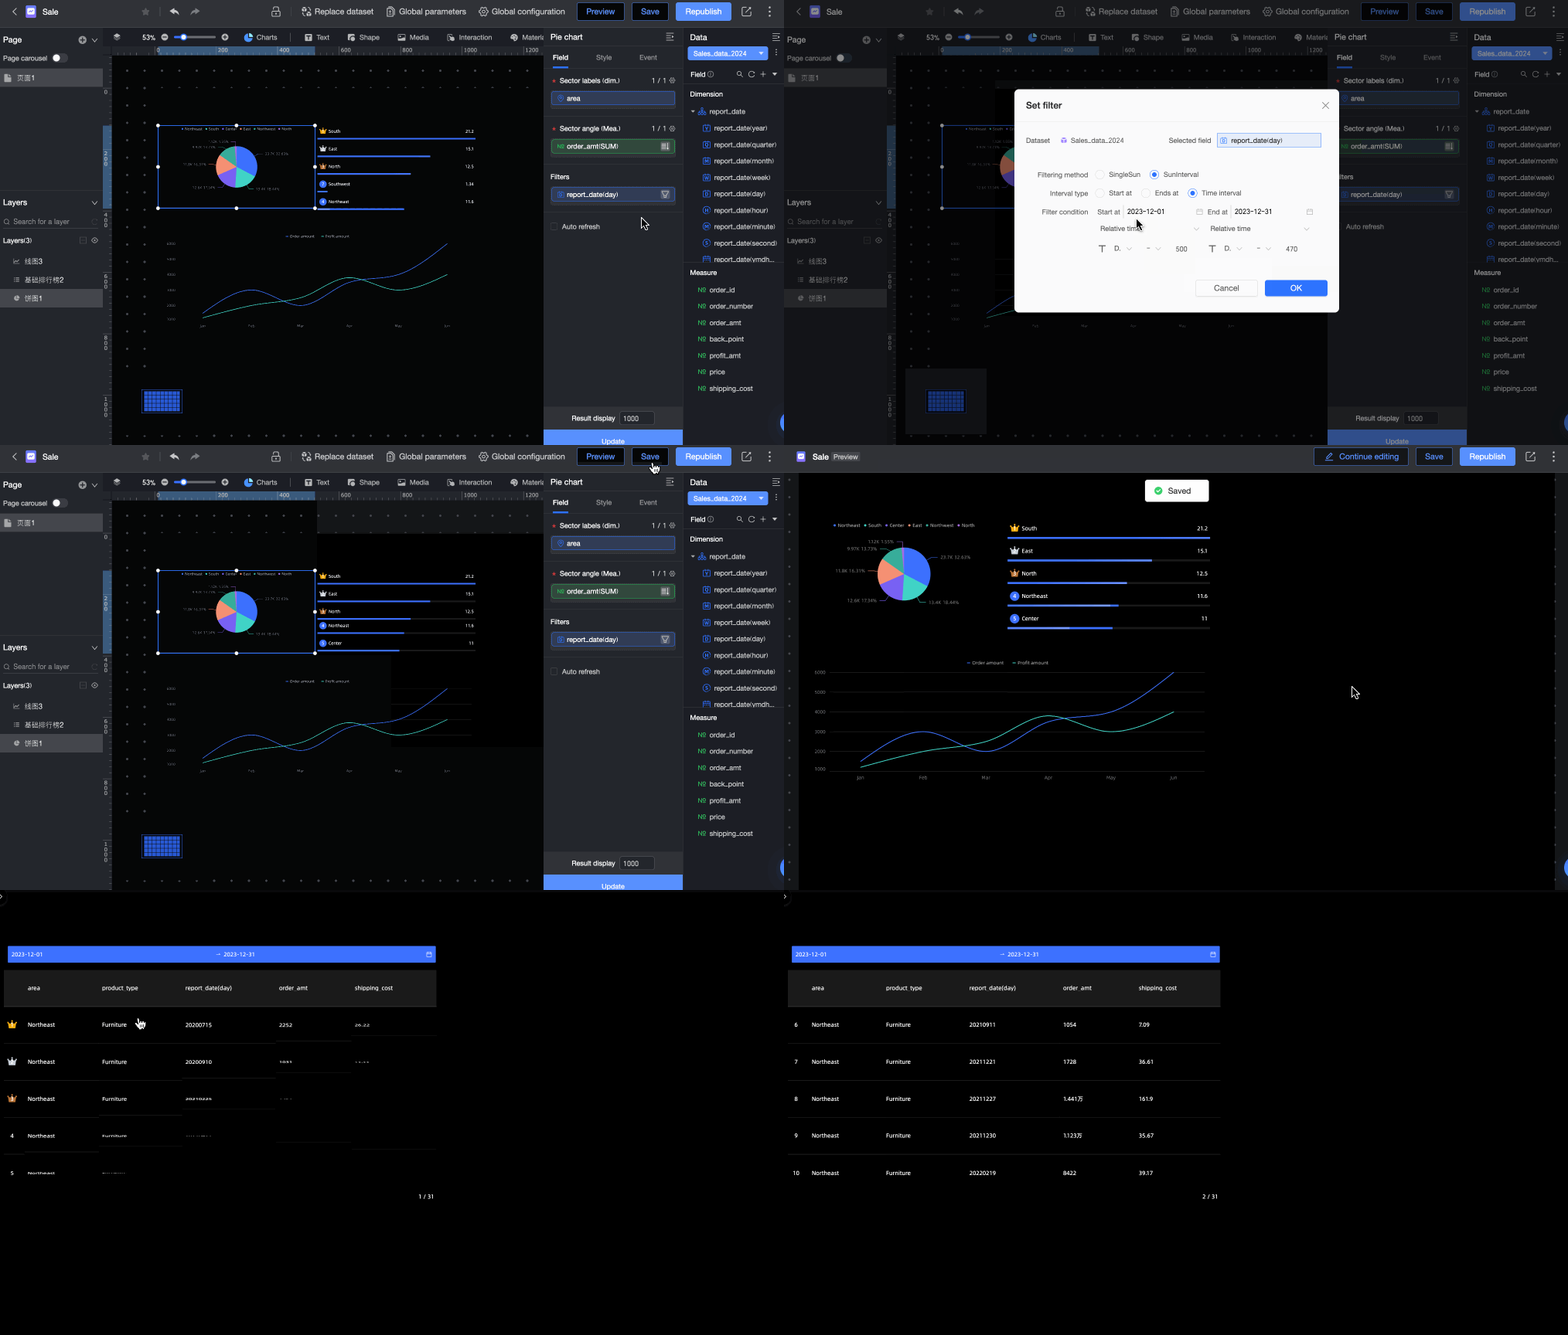
Save the Profit Analysis data dashboard. Open the Sales Analysis data dashboard in edit mode. In the Filter section of the Fields panel for the source chart, configure the filter field.
In this example, you need to filter the Sales Analysis data dashboard to view data for December 2023. To do this, drag the Order Date (day) field to the Filter section and set the filter condition to December 2023.
On the Events panel of the pie chart in the Sales Analysis data dashboard, click the
icon under Data Event > Redirection to configure redirection settings.In the Chart Redirection Settings dialog box, configure the redirection rule for the current chart. You can set up Internal Redirection or External Redirection.
Internal Redirection (used in this example): Redirects to another dashboard, data dashboard, or spreadsheet within Quick BI. The following table describes the configuration parameters.
Parameter
Configuration
Description
Field
Specifies the field that triggers this redirection rule.
In this example, select the Region field because clicking the Northeast region triggers the redirection.
Text to Display for Redirection
Enter custom text to display during the chart interaction. If left blank, the default text Redirection is used.
This example uses the default text.
Redirect to
The redirection method. This example uses internal redirection.
Redirection Content
Select the target resource.
In this example, select the Profit Analysis data dashboard.
Open Mode
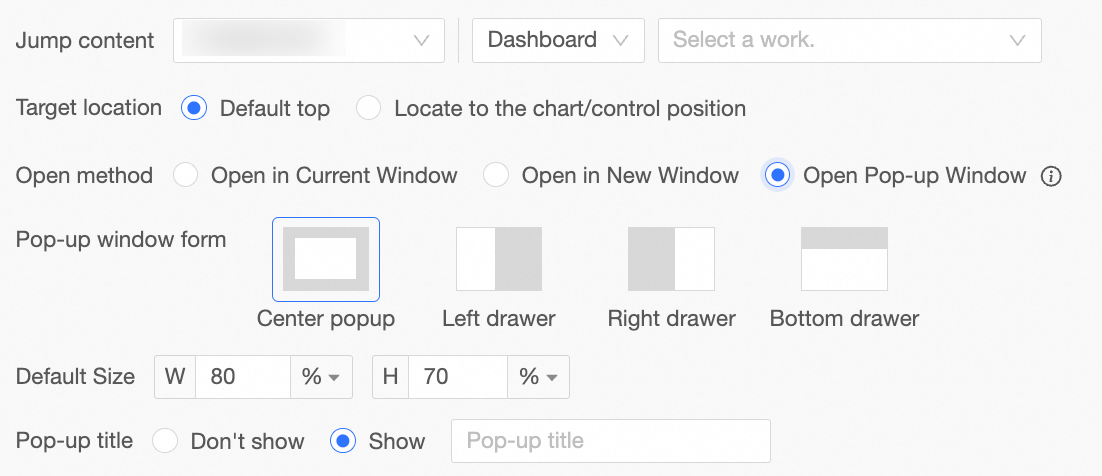
Specifies how to open the target resource. The options are Open in current window, Open in new window, and Open in dialog box.
Open in current window: Loads the target resource directly on the current page.
Open in new window: Opens a new browser tab to load the target resource. This option is selected in this example.
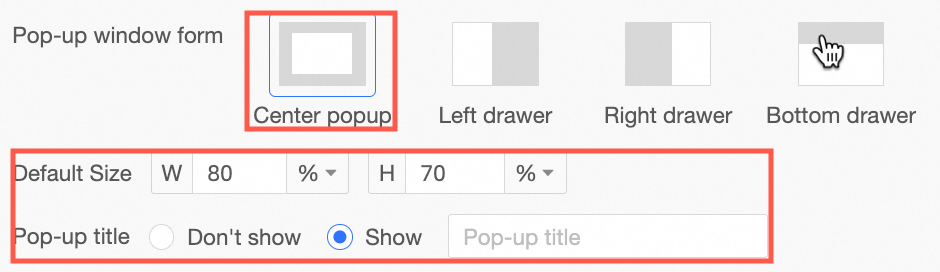
Open in dialog box: Loads the target resource in a dialog box on the current page. If you select this option, you can further configure the Dialog Box Style, Default Size, Dialog Box Title, and Page Mask.
NoteWhen the dialog box style is a centered pop-up, you can choose to show or hide the dialog box title. For other styles, the title is shown by default and cannot be hidden.
You can configure whether to show the page mask only for left, right, or bottom drawer styles. If the mask is not displayed, you can click to switch dimension values.
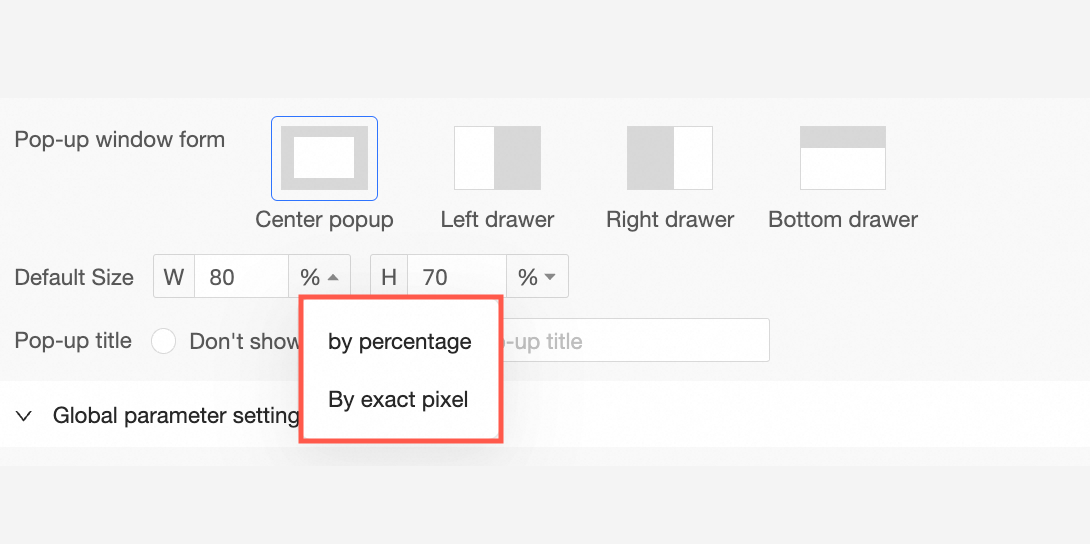
The default size can be set as a percentage or in exact pixels.
Global Parameter Settings
Parameter Mapping Rule
To enable redirection between resources, you must map the fields from the source chart to the global parameters of the target resource.
In this example, to view profit information for the Northeast region after clicking it, you must map the Region field from the Sales Analysis data dashboard to the
areaglobal parameter in the Profit Analysis data dashboard, which controls chart information by region.Filter Condition
Specifies the filter conditions to carry over during redirection. For example, if the source dashboard has a date range filter, you can carry this filter over to the target dashboard so that it immediately shows information in the same date range.
In this example, you need to carry over the time range set in the filter of the Sales Analysis data dashboard to the Profit Analysis data dashboard. To do this, choose to carry over the value from the Order Date (day) filter and map it to the
dateglobal parameter in the Profit Analysis data dashboard.Other Conditions
Specifies whether to carry over drill-down or linkage conditions.
Carry drill-down conditions: If selected, this option carries over the conditions generated by a drill-down action during redirection. The corresponding field mapping reuses the drill-down field mapping configured in the parameter mapping rule.
Carry linkage conditions: If selected, this option carries over the conditions generated by a linkage action during redirection. The corresponding field mapping reuses the linkage field mapping configured in the parameter mapping rule.
This is not applicable to this example.
External Redirection: Redirects to an external website, third-party service, or application outside of Quick BI.
In the Chart Redirection Settings dialog box, select the field that triggers the redirection rule and enter the URL of the external page.
NoteYou can enter the destination URL directly into the URL input box, or you can add dimension fields from the chart to the URL by double-clicking them.
After completing the configuration, click OK, and then Save the current chart.


 icon under Data Event > Redirection to configure redirection settings.




Result
In the Sales Analysis data dashboard, filter the data to show only sales information for December 2023. Click the Northeast region to redirect to the Profit Analysis data dashboard. After redirection, the date selector in the Profit Analysis data dashboard updates to December 2023, and the charts display profit information for the Northeast region during that period. The following image shows the result: