Linkage
Linkage allows you to click a data point in one chart to dynamically filter or highlight related data in other charts on the same dashboard, enabling multi-dimensional data analysis.
Use cases
Linkage lets you interact with one chart to dynamically update one or more other charts.
-
Scenario: On a sales dashboard, you want to view different information, such as sales performance and shipping costs, for a specific region like East China. To do this, select the East China region in a map chart to link to other charts.
-
Result: When a report viewer clicks the East China region on the map, the other charts on the dashboard simultaneously update to display metrics such as sales performance and shipping costs for the East China region.
Limitations
Linkage is supported for the following charts.
-
Tables: crosstab, detail table, trend analysis table, multidimensional analysis table, heat map.
-
Metric charts: metric board, indicator trend chart, flipper, progress bar, gauge chart, water wave chart, indicator decomposition tree, indicator relationship diagram.
-
Line/Area charts: line chart, area chart, stacked area chart, 100% stacked area chart, combo chart.
-
Column/Bar charts: column chart, stacked column chart, 100% stacked column chart, radial bar chart, ranking board, bar chart, stacked bar chart, 100% stacked bar chart, dynamic bar chart, waterfall chart, bullet chart, box plot.
-
Pie/Doughnut charts: pie chart, rose chart, sunburst chart, radar chart, treemap.
-
Bubble/Scatter charts: bubble chart, scatter plot, faceted scatter plot.
-
Funnel/Conversion charts: funnel chart, comparison funnel chart, source and destination map, sankey diagram.
-
Maps: choropleth map, bubble map, heatmap layer, building heatmap, fly line map, symbol map.
-
Others: word cloud, timeline.
Example
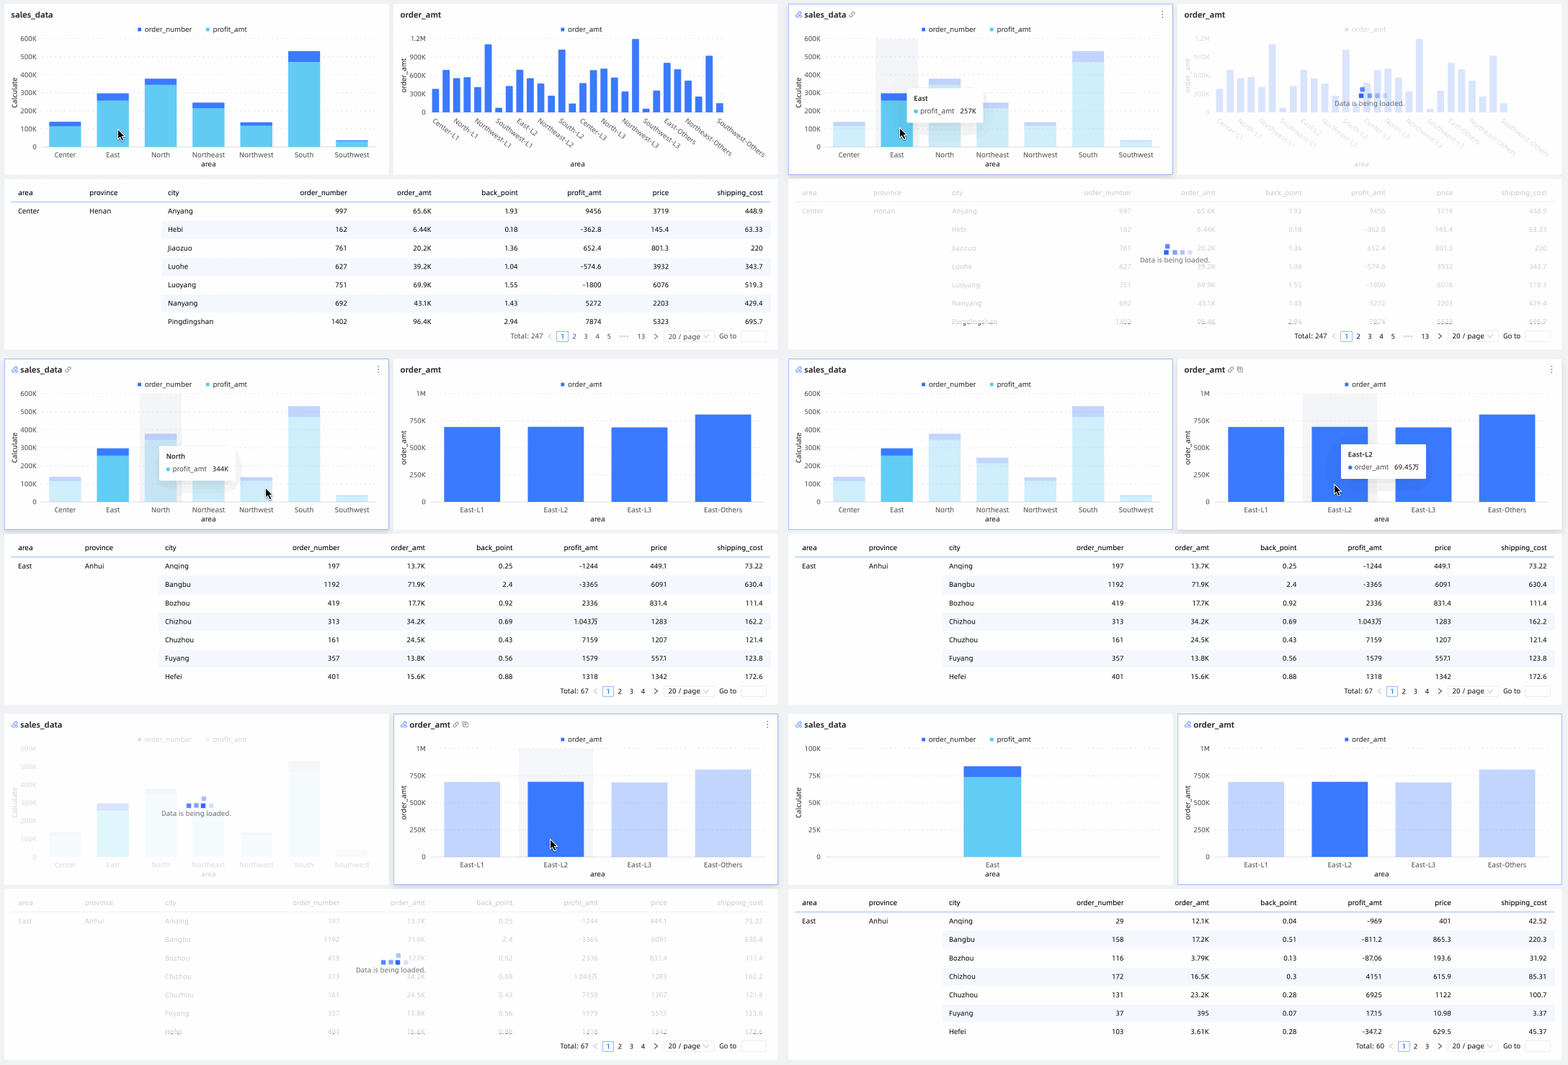
When you click the East China region in the Regional Order Sales chart, the Regional Order Count Overview and Product Sales Details charts are linked to display the relevant data for the East China region. When you click the Medium order level in the Regional Order Count Overview chart, the Regional Order Sales and Product Sales Details charts are linked to display the relevant data for the Medium order level within the East China region.
Configuration
Click the  icon on the dashboard edit page and navigate to Interaction Control > Linkage on the Advanced tab to configure global linkage settings.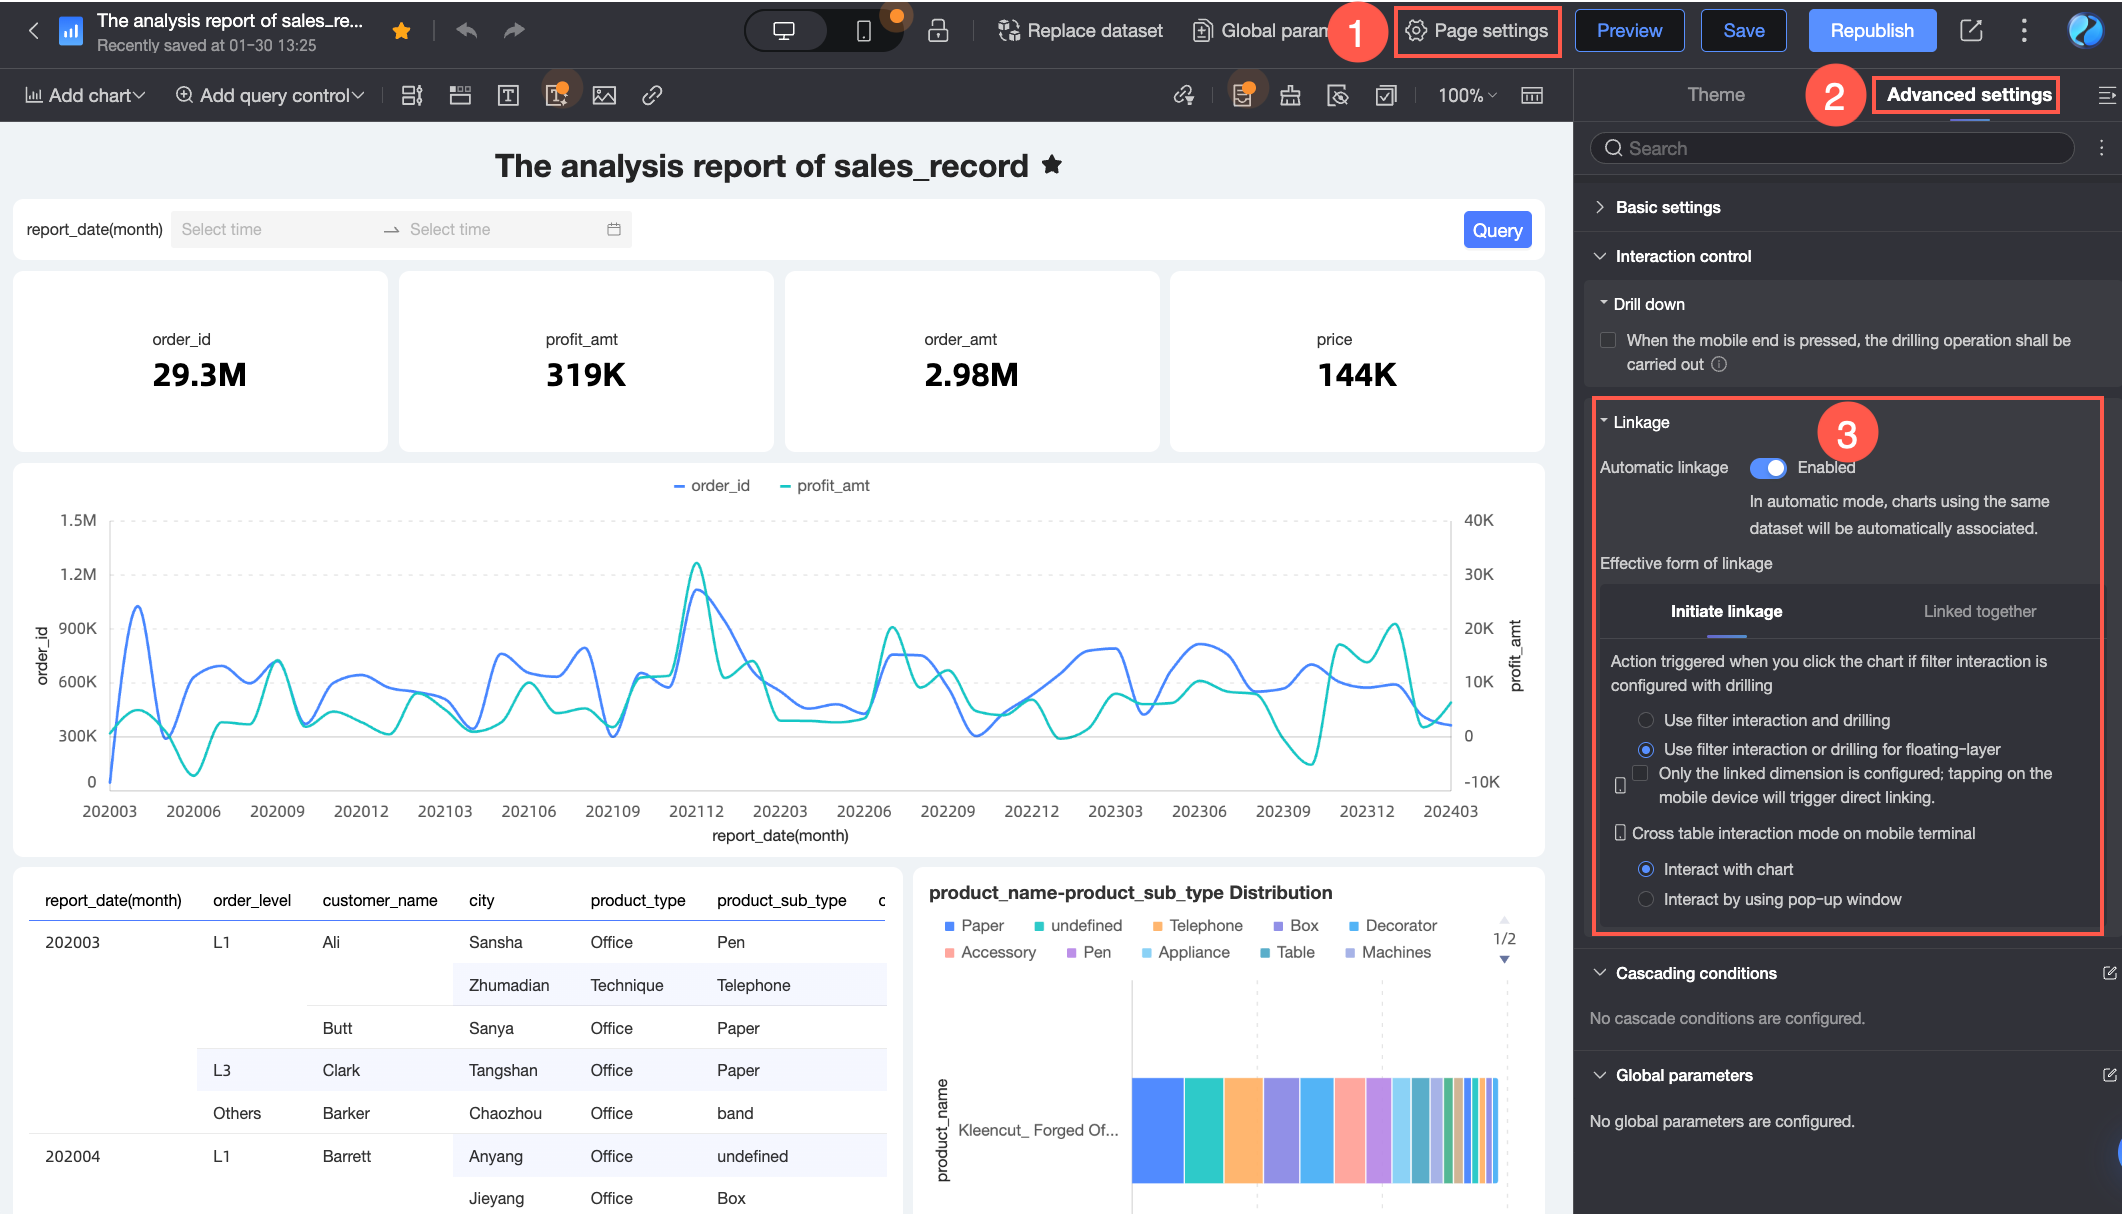
Enable auto linkage to connect charts that share the same dataset, or manually configure linkage for specific charts. You can also configure how charts initiate and respond to linkage.
|
Configuration |
Description |
|
|
Setting type |
Auto linkage |
Automatically links charts on the dashboard that use the same dataset. For more information, see Configure auto linkage. |
|
Manual linkage |
Manually configures linkage for a specific chart on the dashboard. For more information, see Configure manual linkage. |
|
|
Linkage initiation method |
Apply simultaneously |
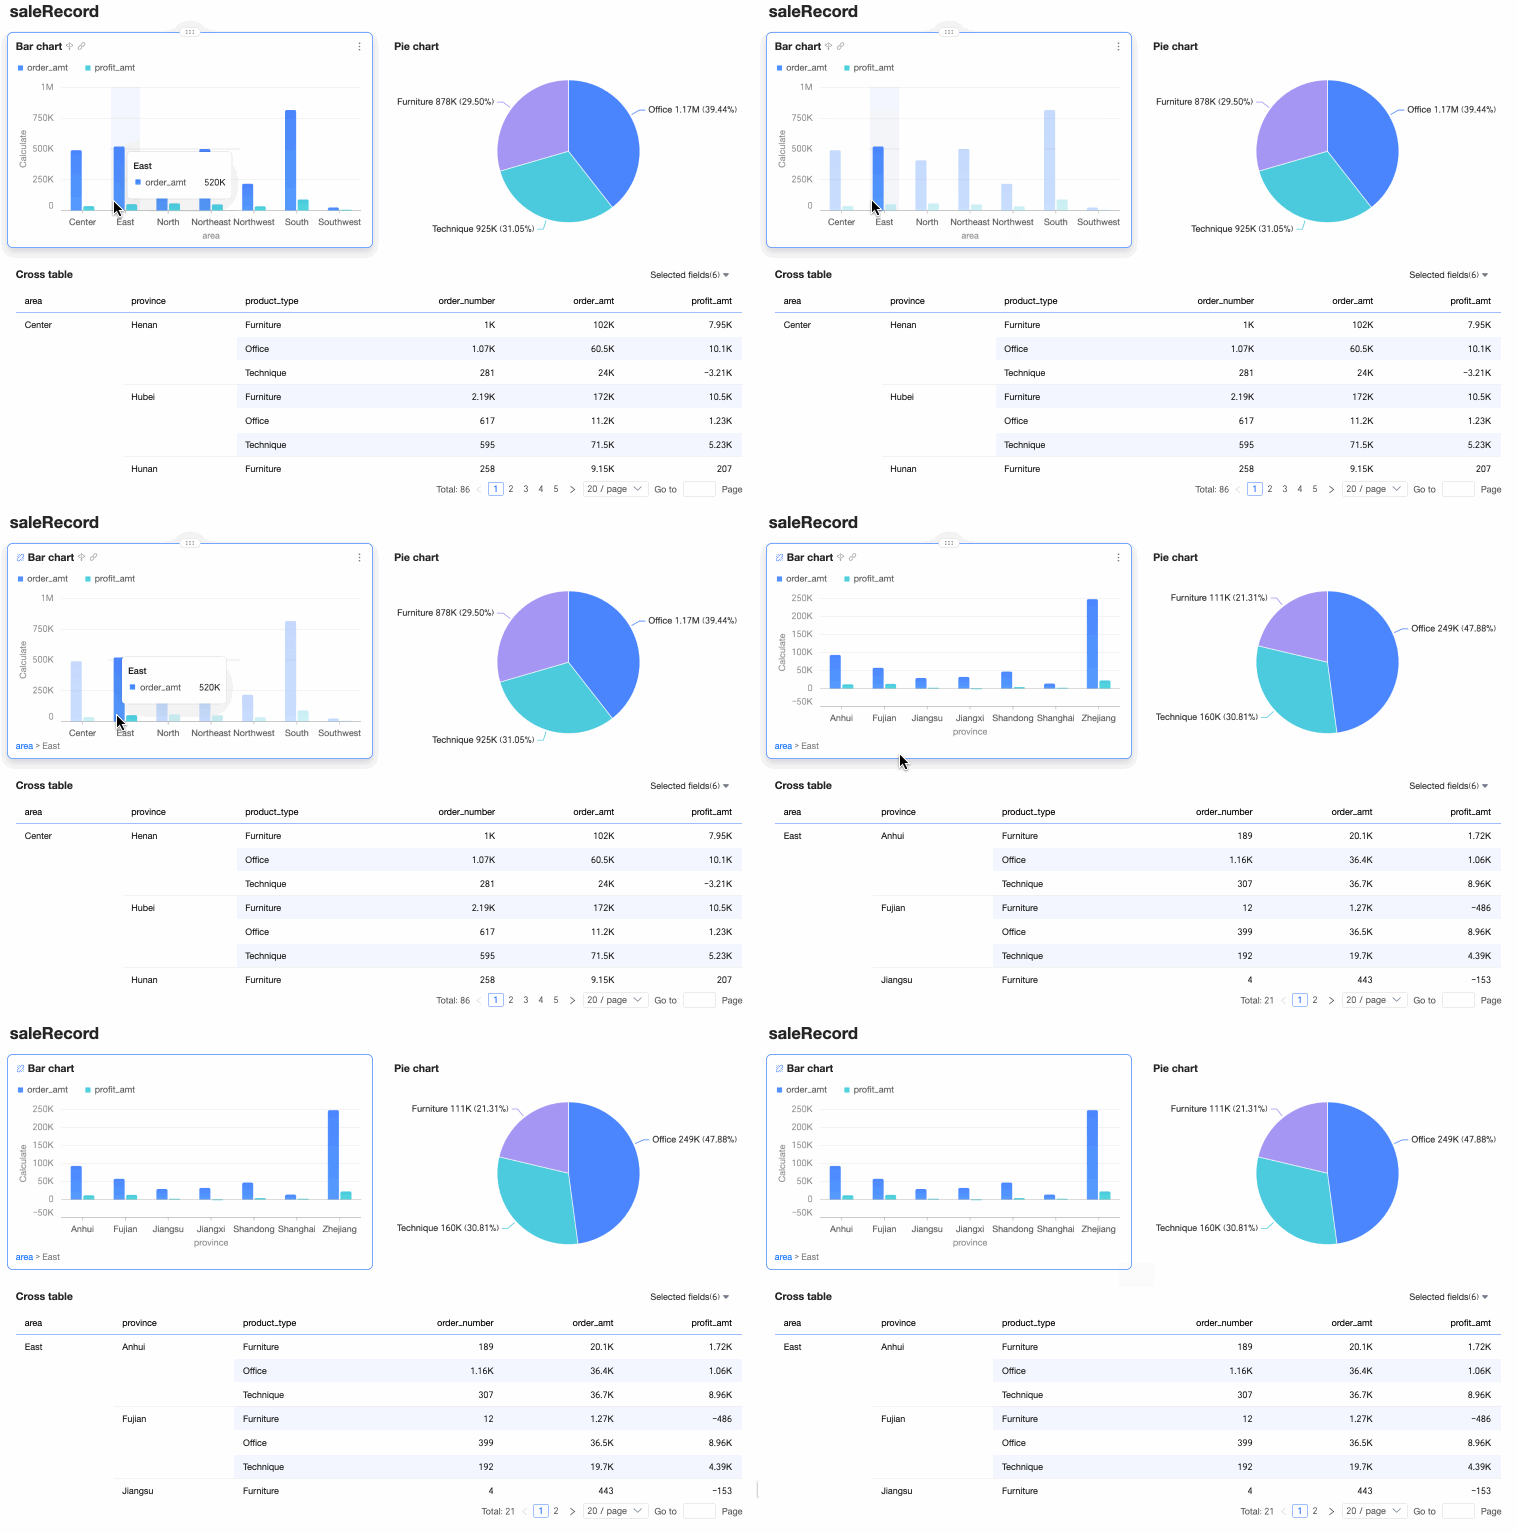
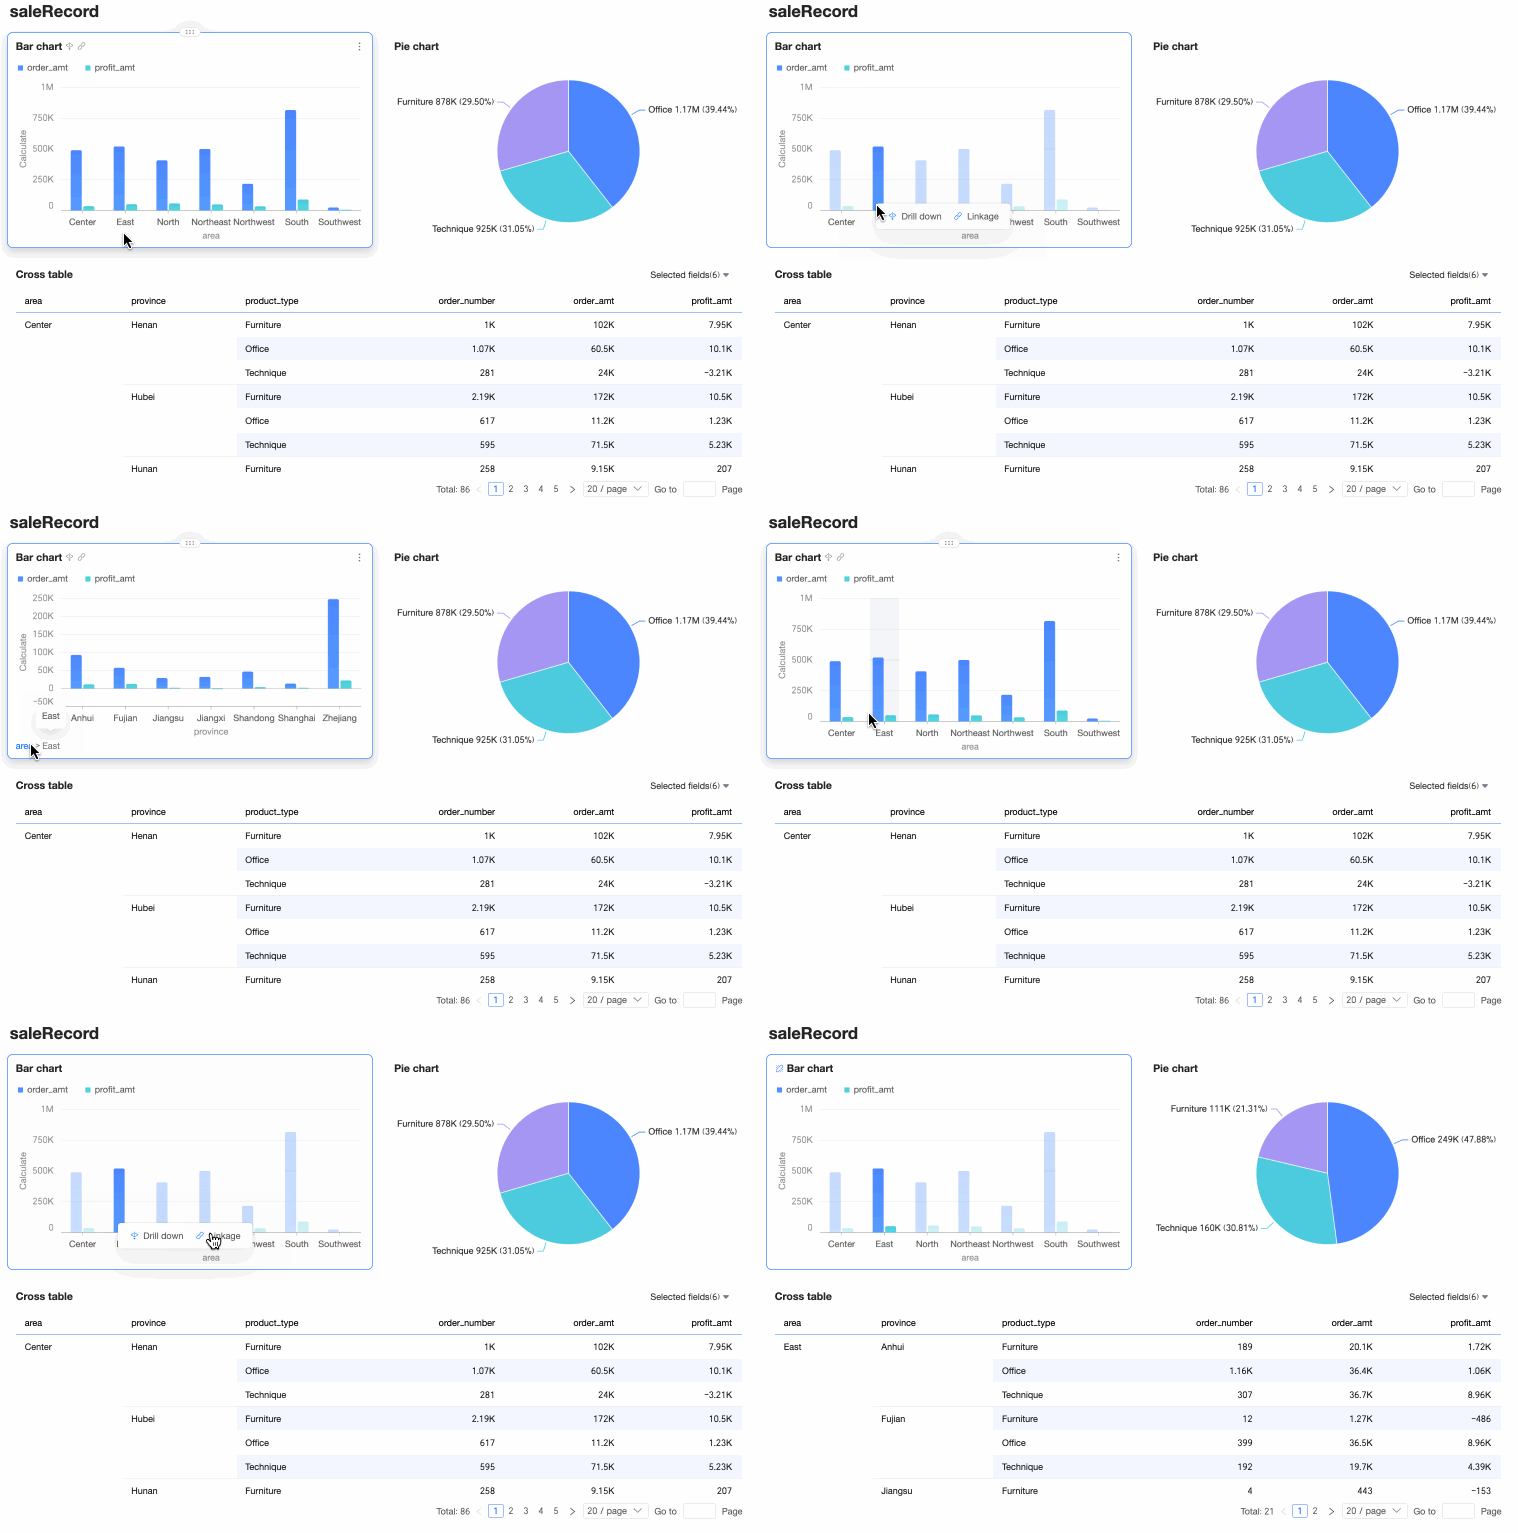
If a dimension used for linkage is also configured for drill-down, when a user clicks a data point for that dimension, the source chart immediately drills down, and all linked charts are filtered to show related data. |
|
Select linkage or drill-down in pop-up |
If a dimension used for linkage is also configured for drill-down, when a user clicks a data point for that dimension, a pop-up prompts them to select either Drill Down or Linkage. Selecting drill-down performs the drill-down action only on the source chart, leaving other charts unaffected. Selecting linkage highlights the selected data point in the source chart and filters all linked charts to show related data.
|
|
|
Linkage response method |
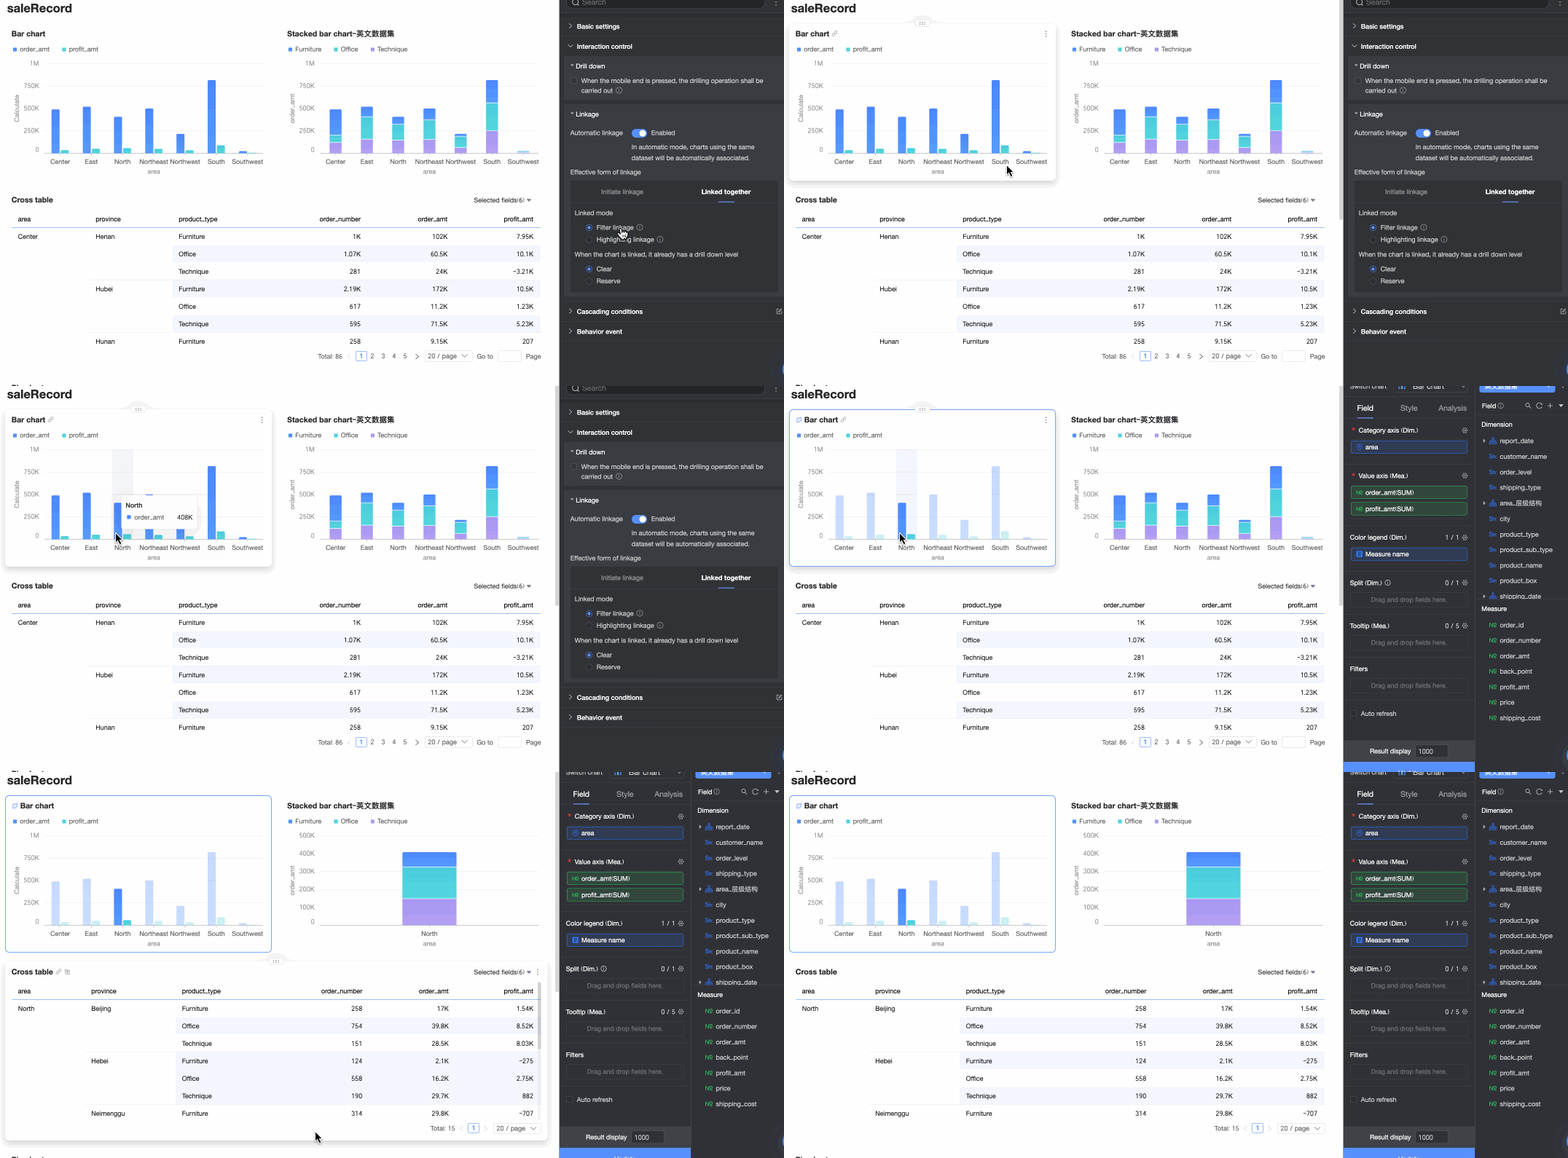
Filter linkage |
When you select data in one chart, other linked charts automatically filter to show only matching results. This method is ideal for focusing on specific data by excluding irrelevant information. |
|
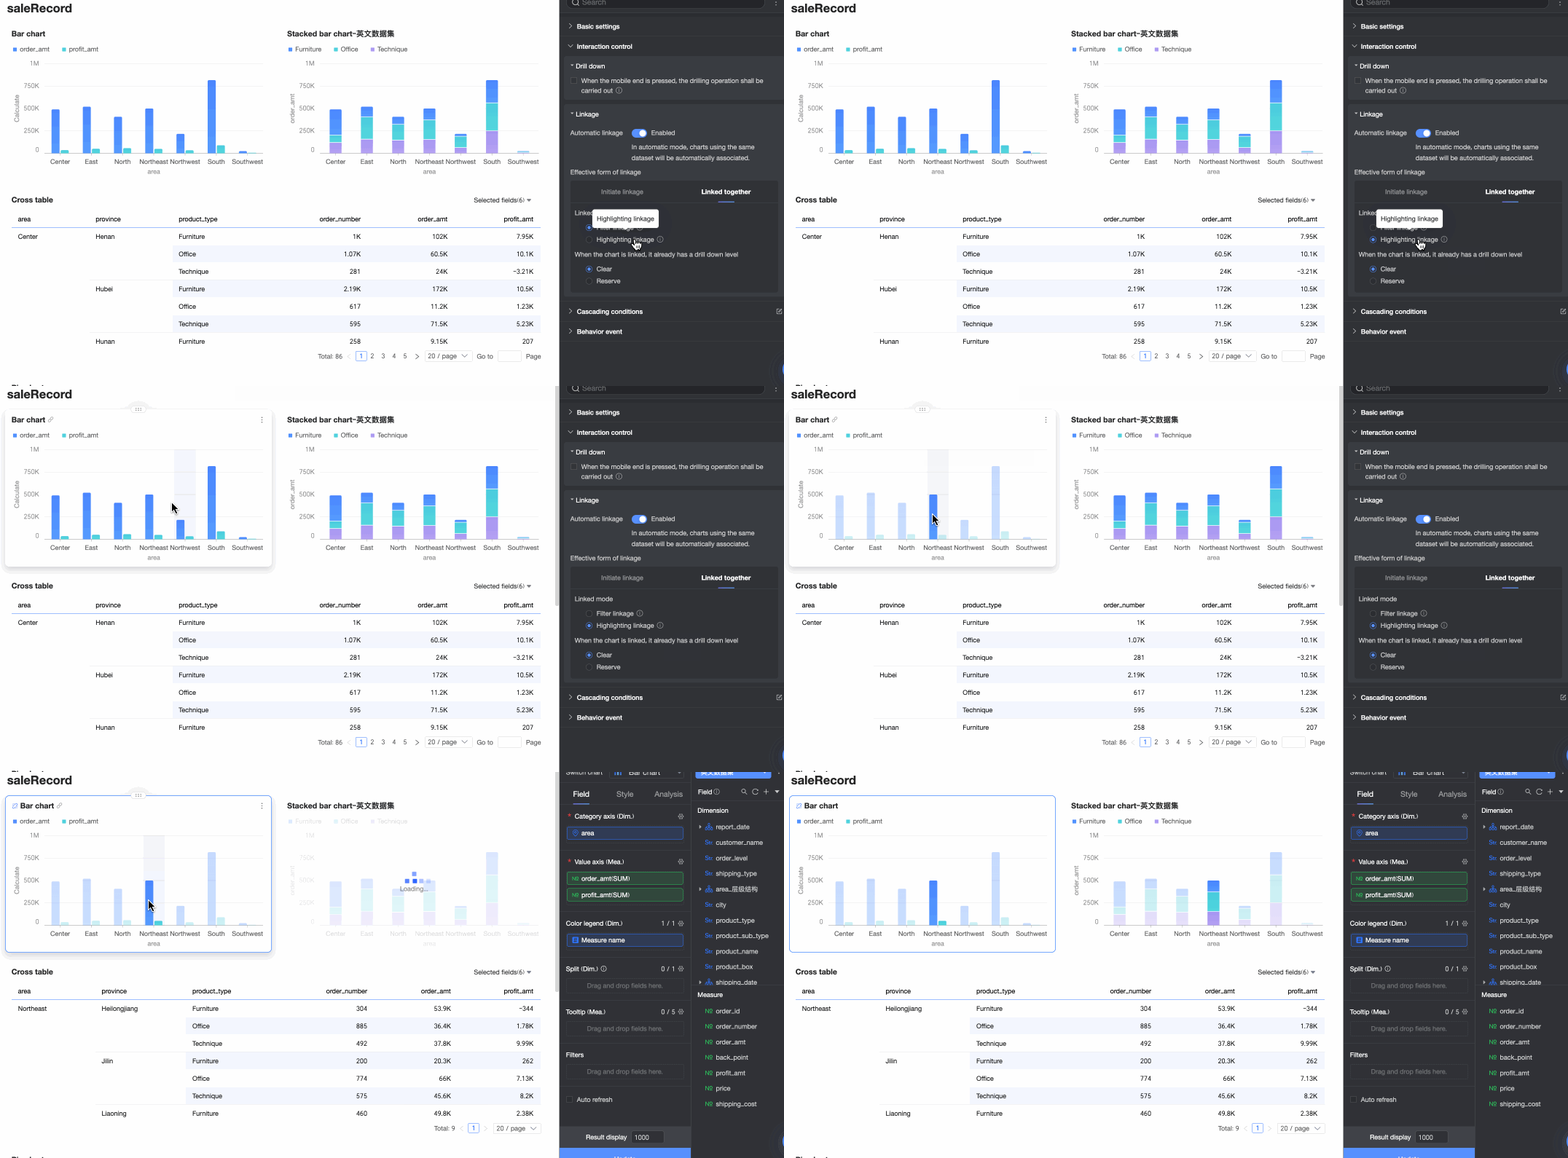
Highlight linkage |
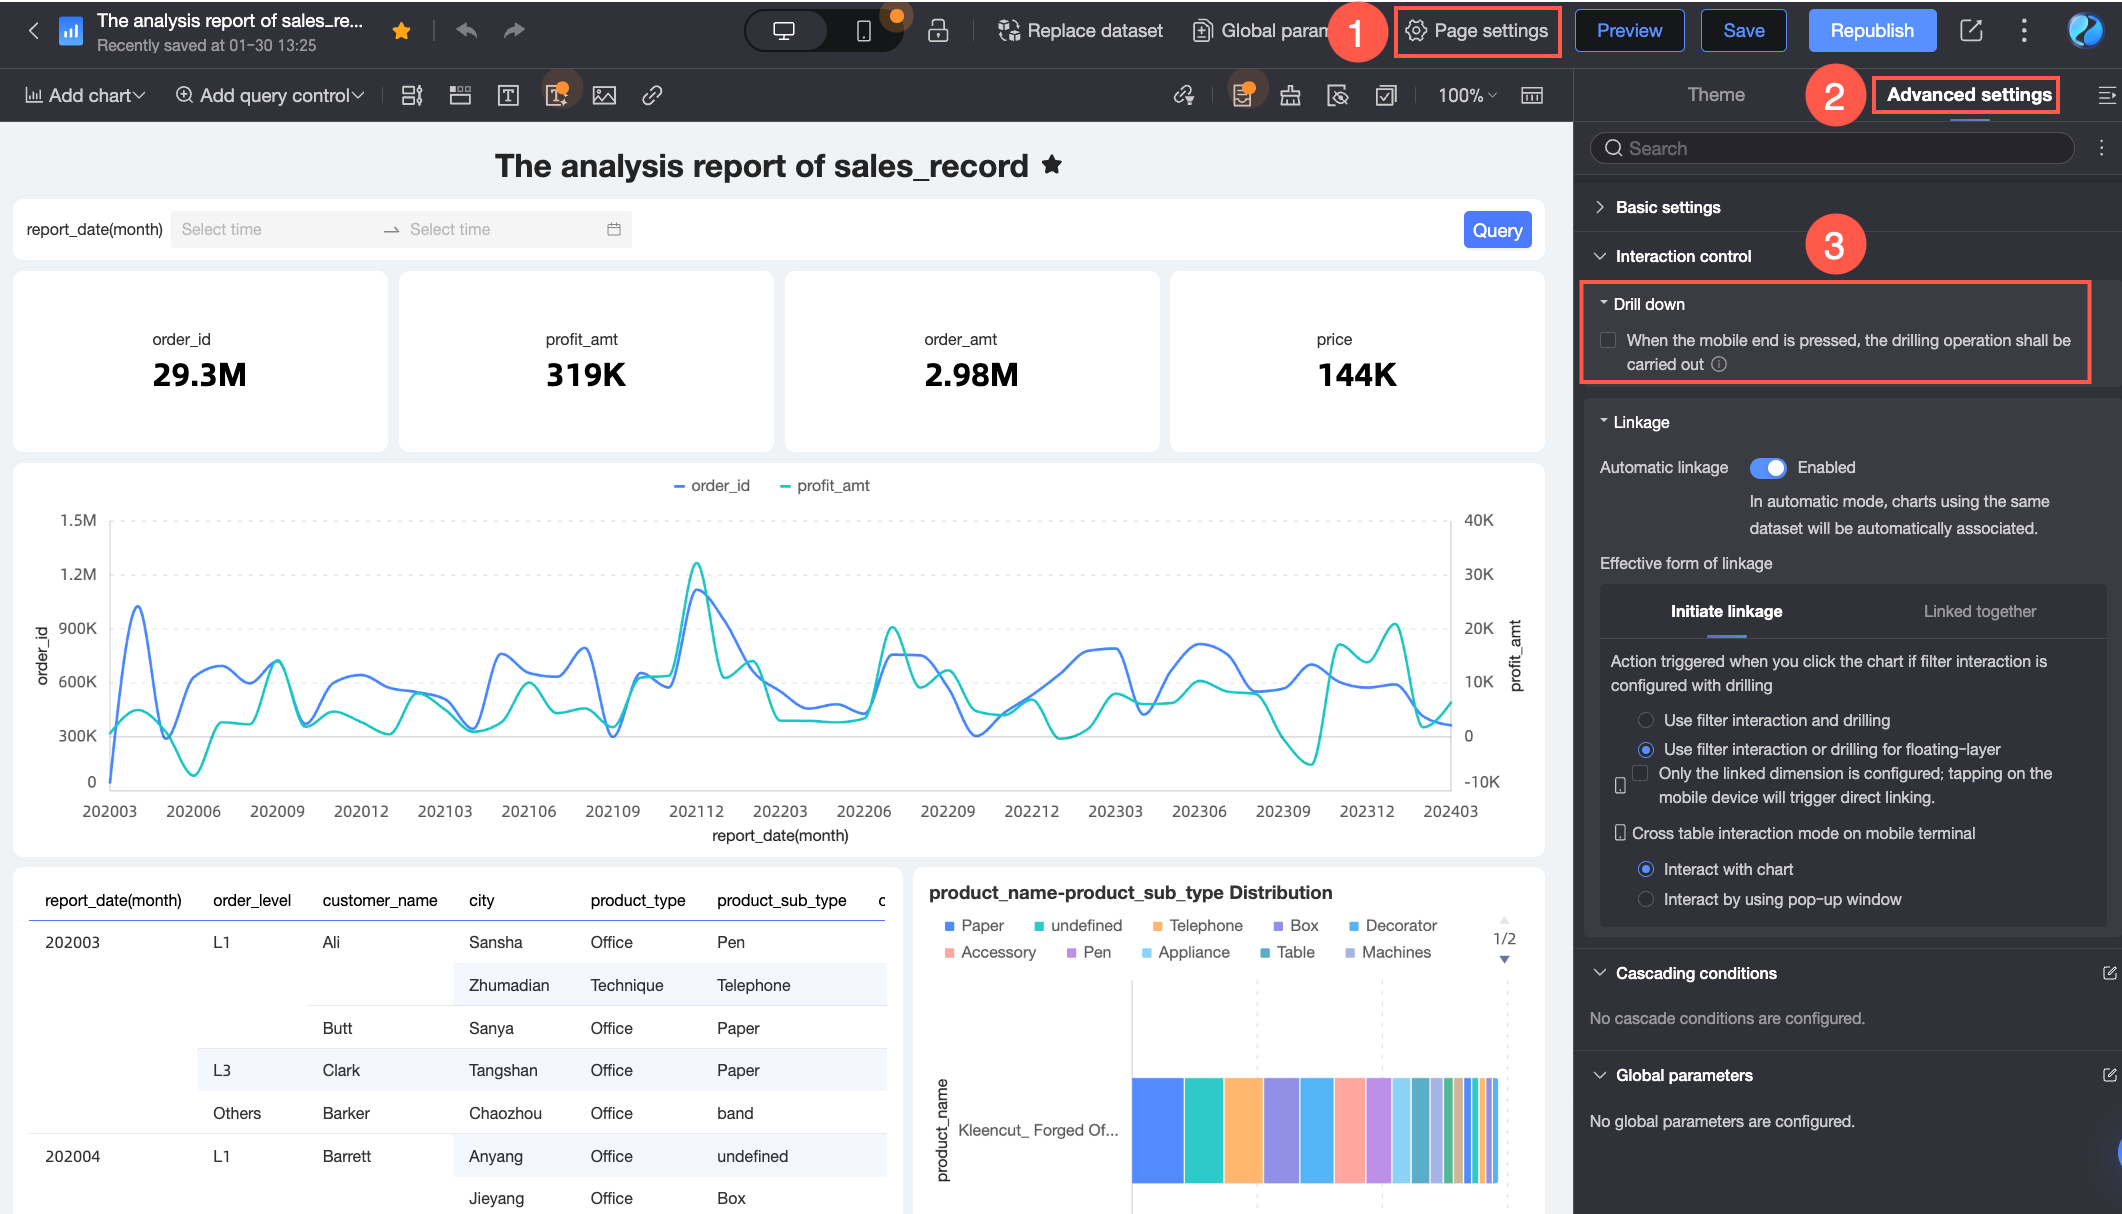
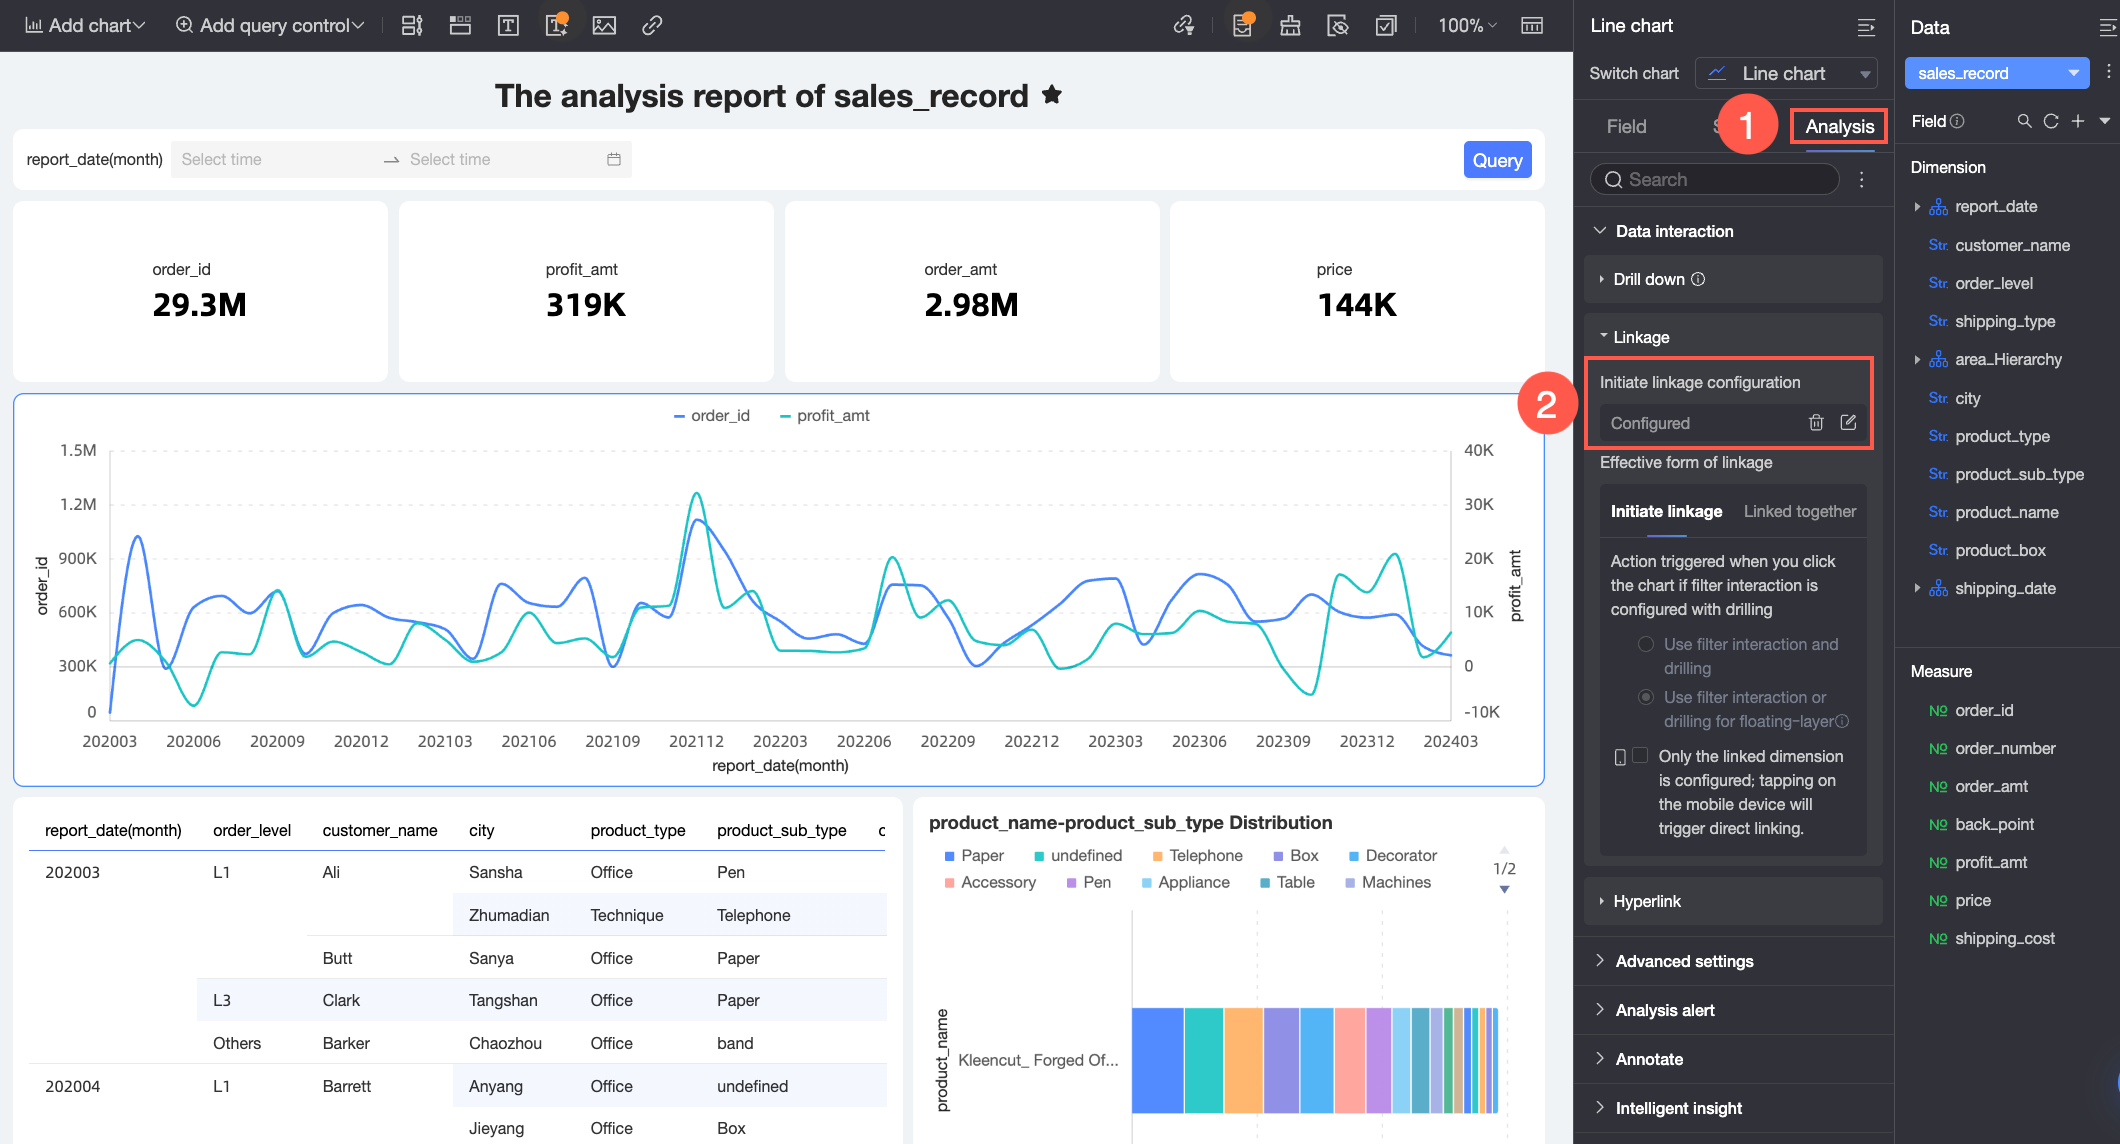
When you select data in one chart, the corresponding data in linked charts is highlighted while all other data remains visible. This method is ideal for comparing specific data points while maintaining an overall perspective. Note
Only the following charts support highlight linkage:
|
|
Procedure
Configure auto or manual linkage for your charts, and set the linkage activation mode.
Configure auto linkage
In Auto Linkage mode, charts on the dashboard that use the same dataset are automatically linked.
Enable auto linkage
-
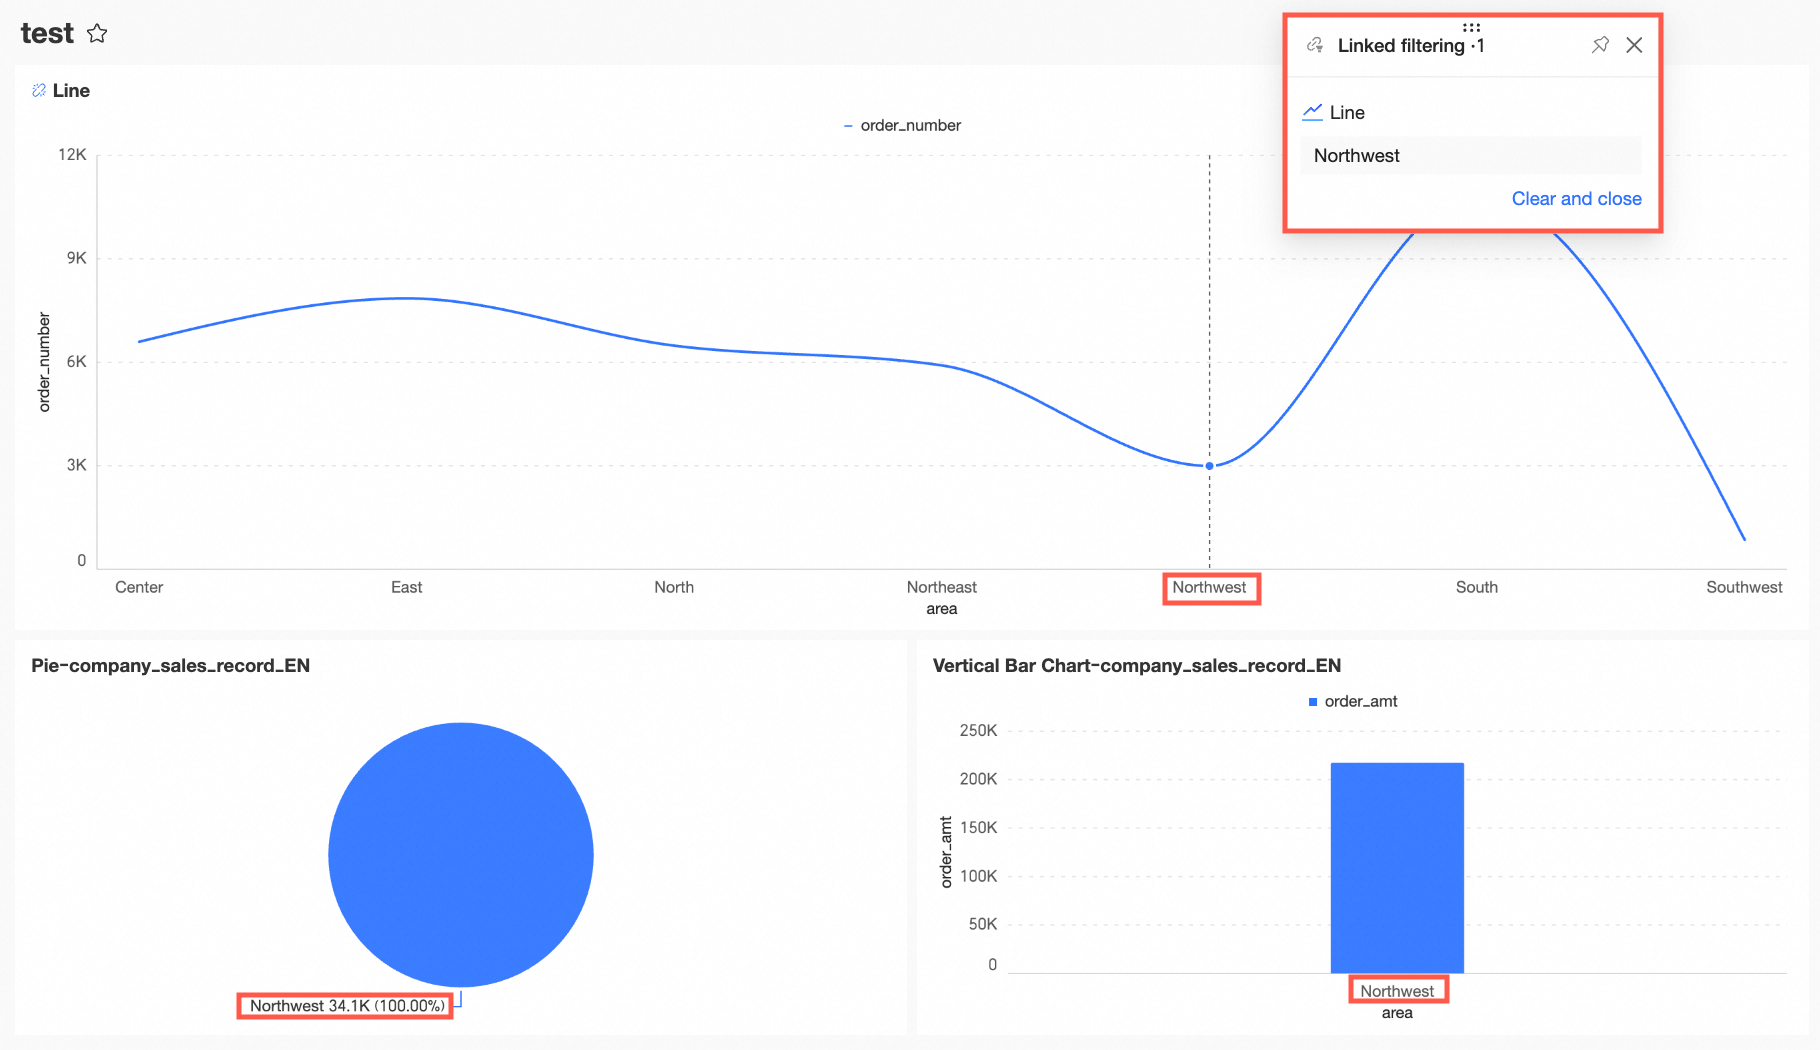
On the Sales Analysis dashboard, click Page Settings. On the Advanced tab, in the Interaction Control section, enable Auto Linkage.
When enabled, all charts from the same dataset are automatically linked. For example, if you click the East China region in the Regional Order Sales chart, other charts automatically update to show data for the East China region.

-
In the linkage filter pane on the right, you can view the linkage status of the current Regional Order Sales chart or switch the linked value directly. For more information about the filter pane, see Linkage filter pane in this topic.

Bidirectional linkage
-
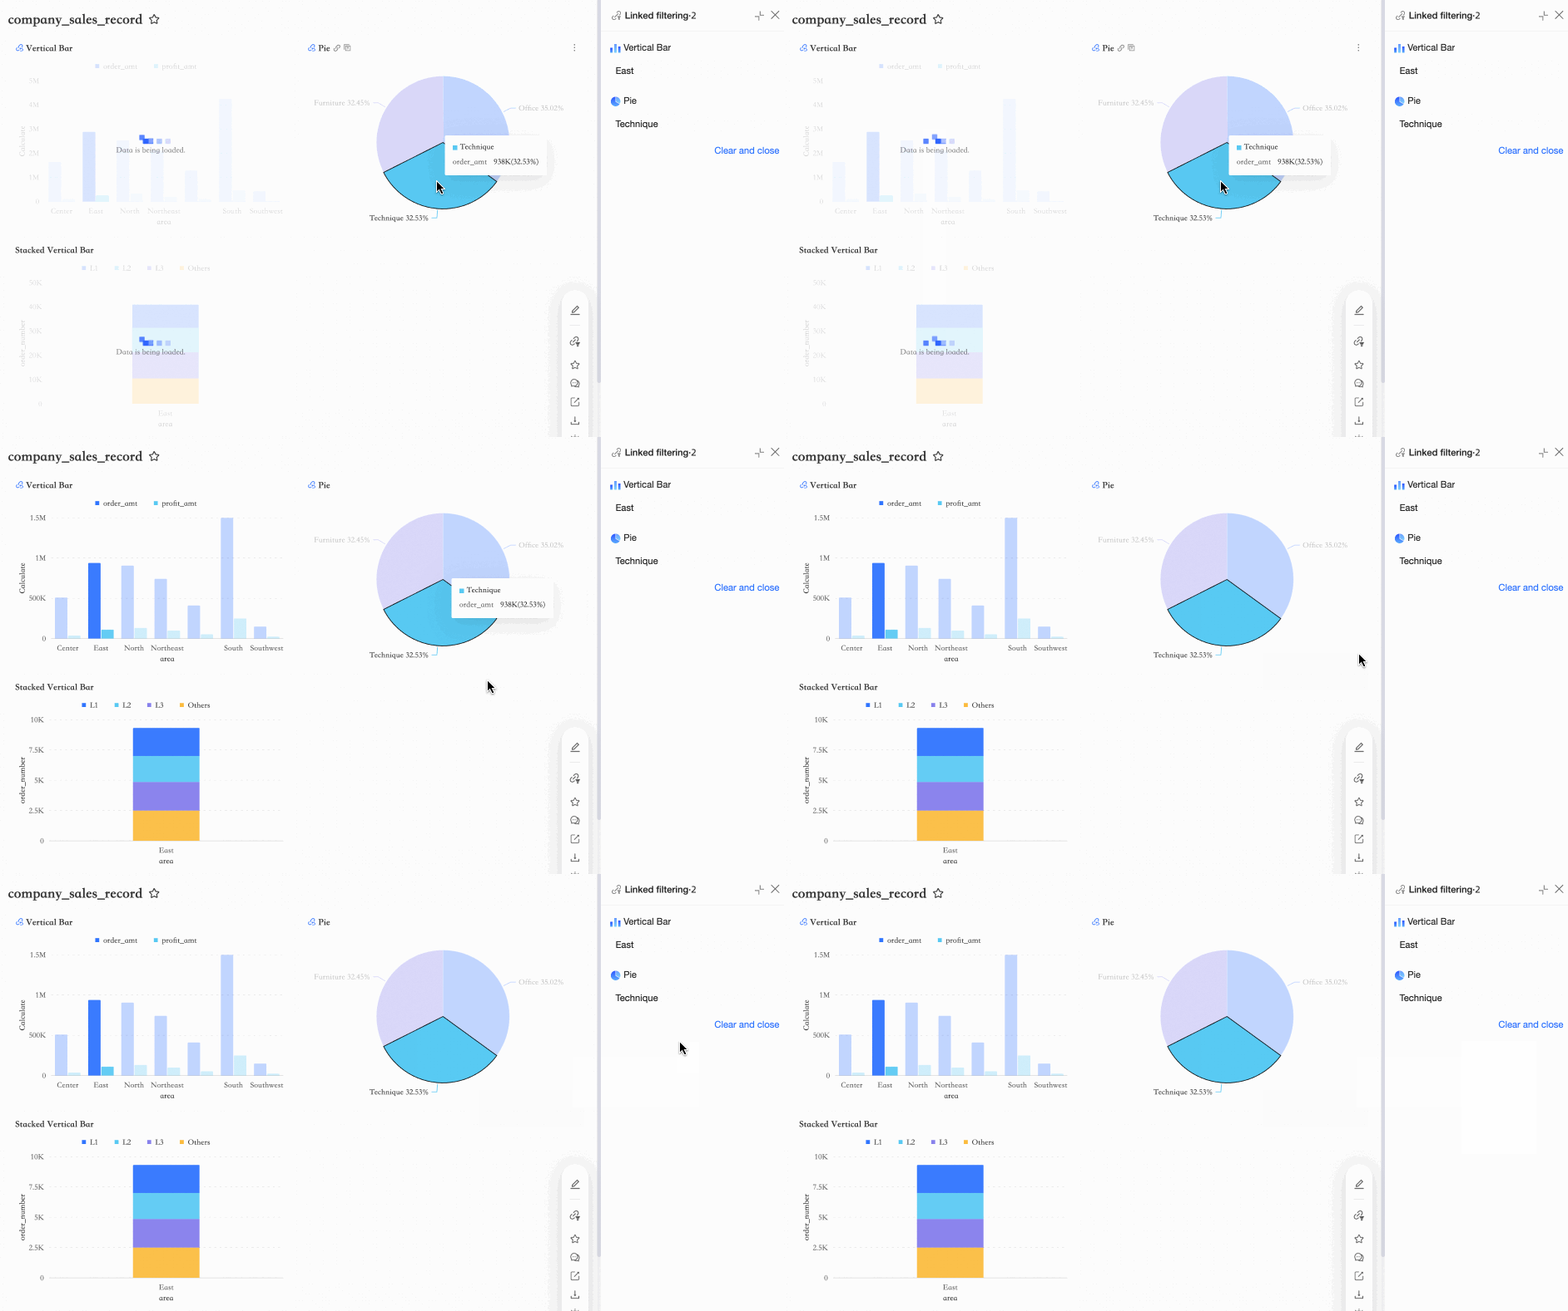
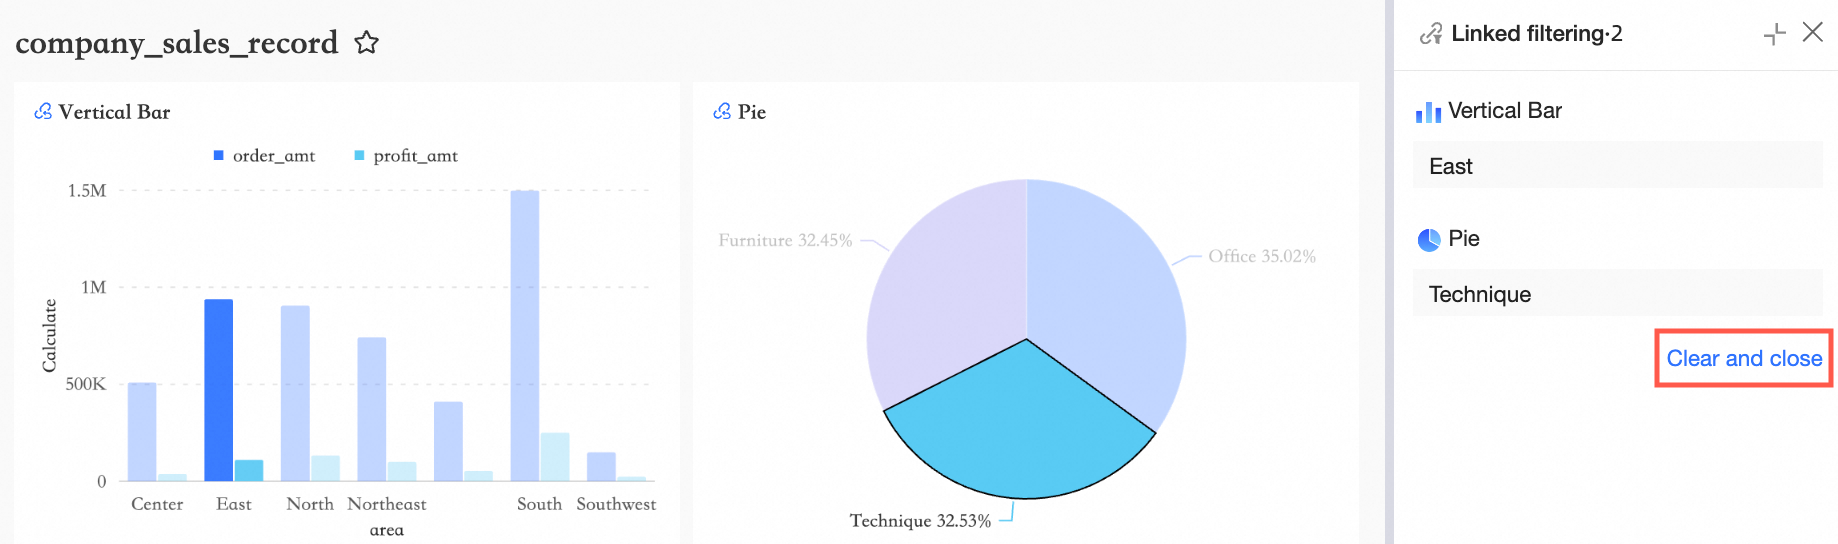
To view data for Tech Products within the East China region in the Regional Order Sales chart, you can click the Tech Products type in the already-linked Product Type Distribution chart to achieve bidirectional linkage.
-
You can now see the linkage status for both charts in the linkage filter pane. For more information about the filter pane, see Linkage filter pane in this topic.
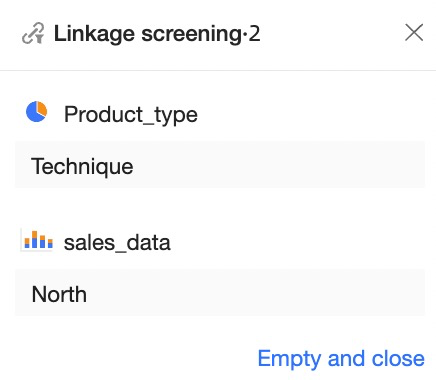
Custom configurations with auto linkage
To configure a separate linkage for other fields in the Regional Order Sales chart when auto linkage is already enabled for the Region field, use the chart's Linkage Configuration dialog box.
-
Select the Order Sales chart. On the Analysis tab, in the Data Interaction section, click the
icon next to Linkage. -
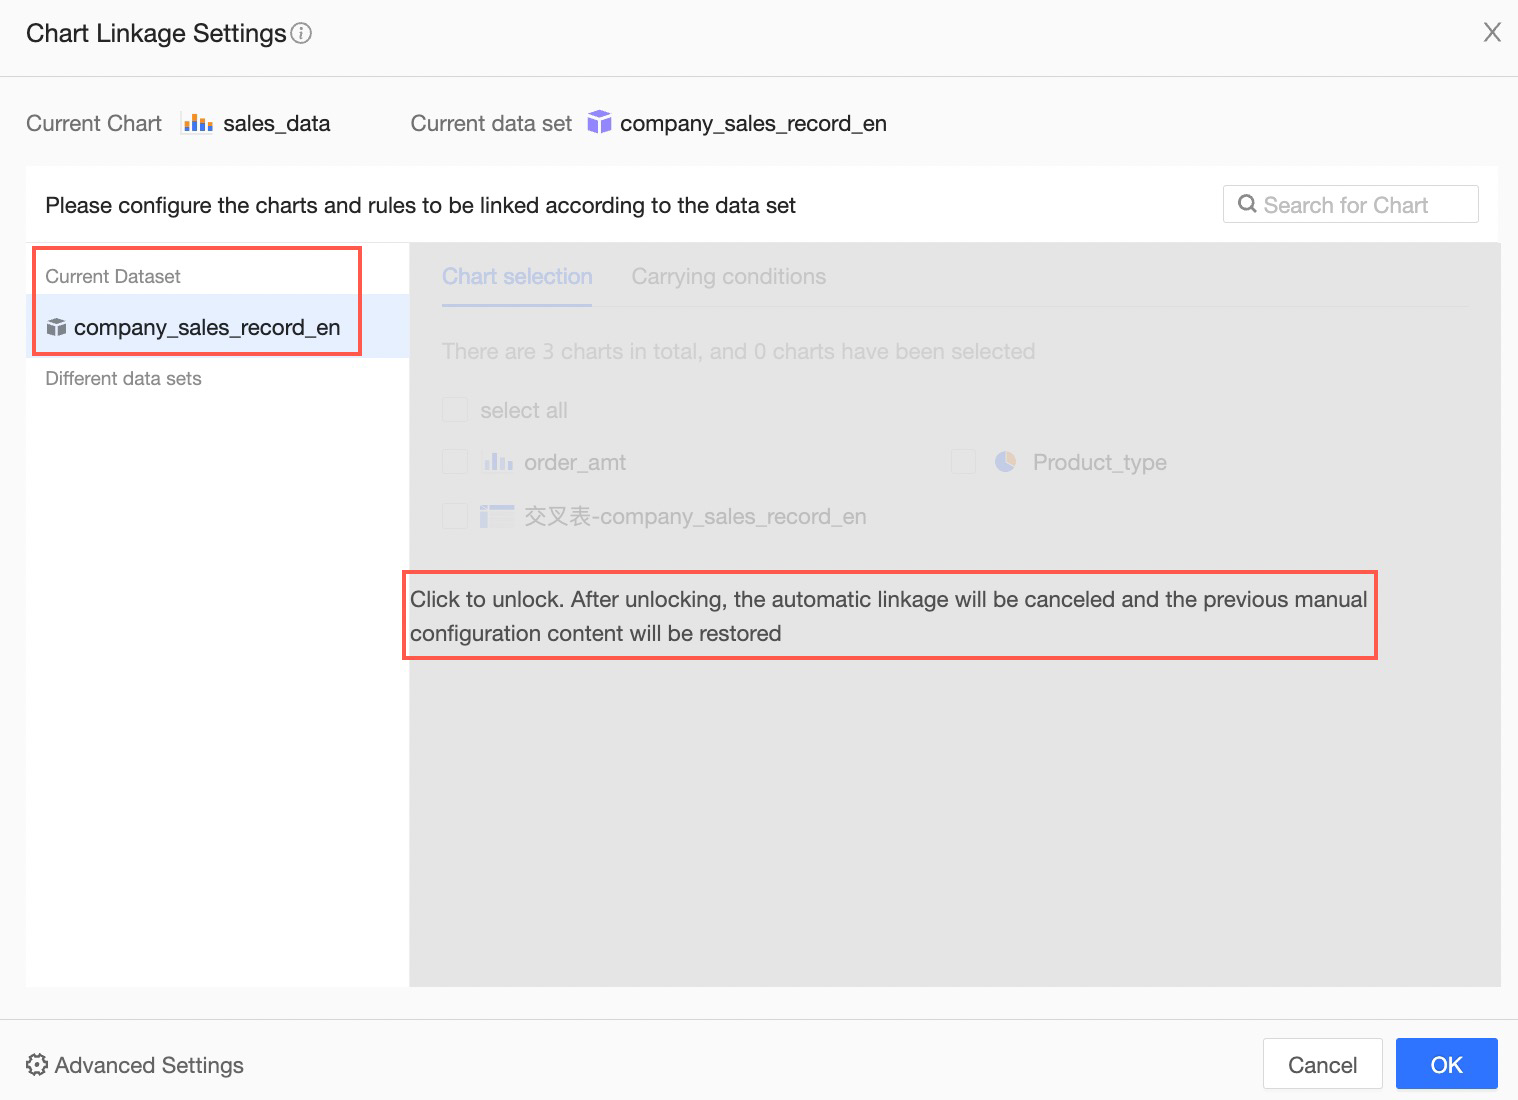
With Auto Linkage enabled, charts from the same dataset have their linkage conditions pre-configured by default. In the pop-up window, click Click to Unlock to configure other linkage settings.
ImportantUnlocking disables auto linkage. If you have previously configured manual linkage, the settings will revert to the last manual configuration.
-
After unlocking, you can select the charts to link, click the
icon next to a chart to customize the fields to be linked, and then click OK. -
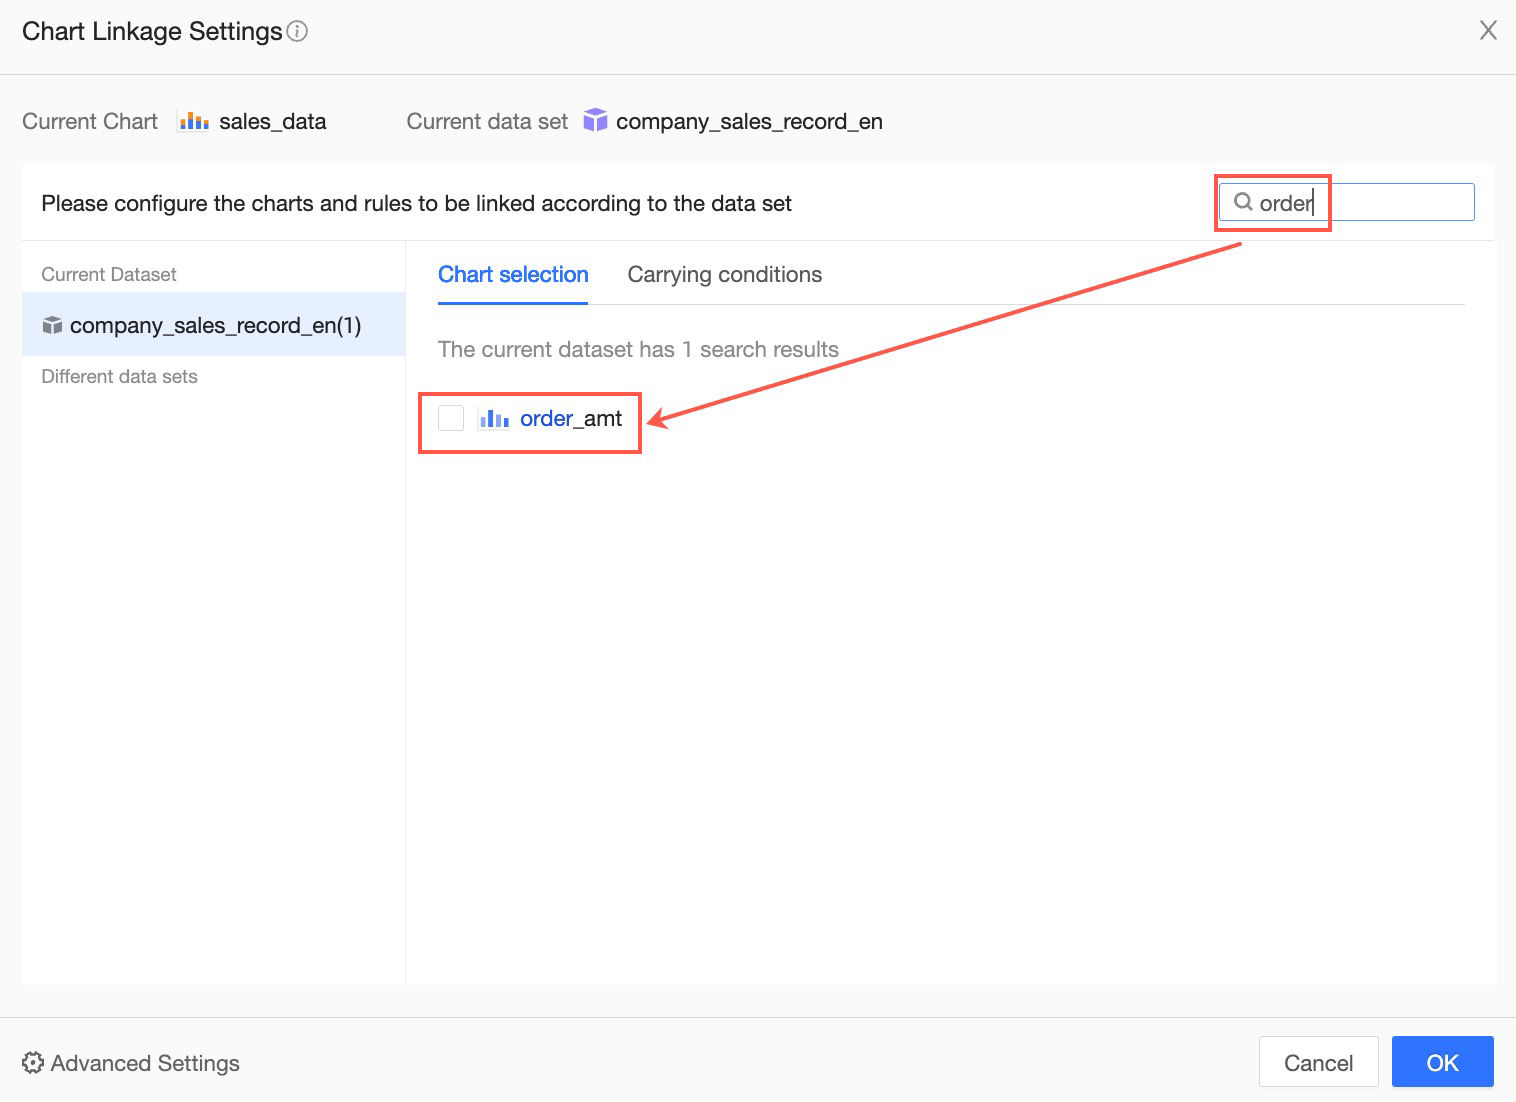
If the dashboard contains many charts, you can use the Search Box in the upper-right corner to quickly find a specific chart.
 icon next to Linkage.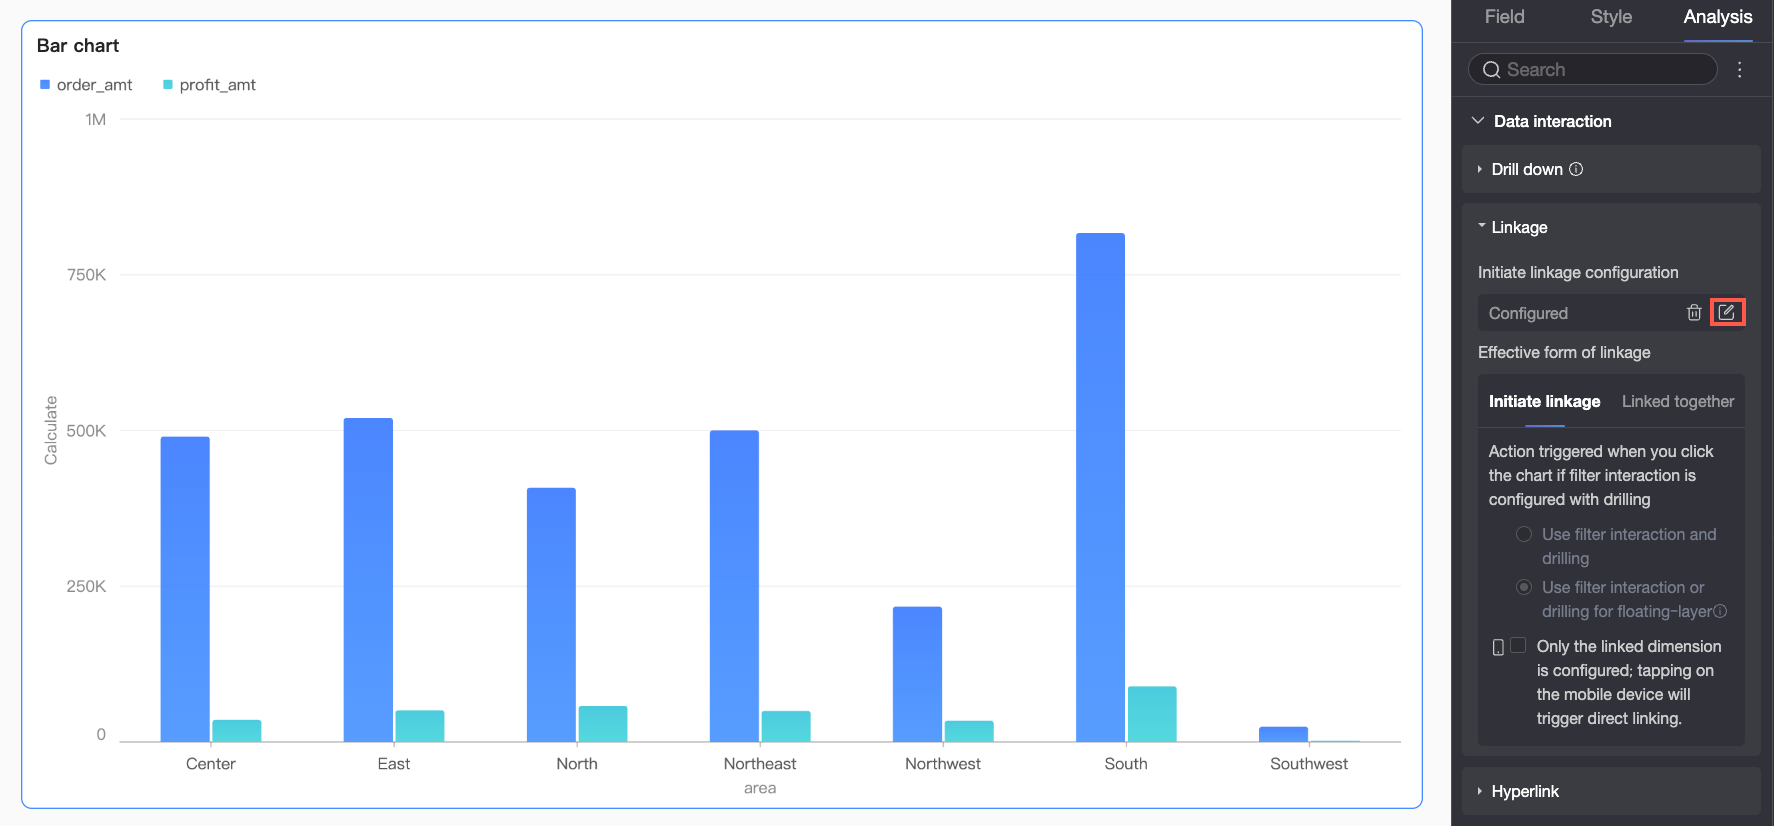
 icon next to a chart to customize the fields to be linked, and then click OK.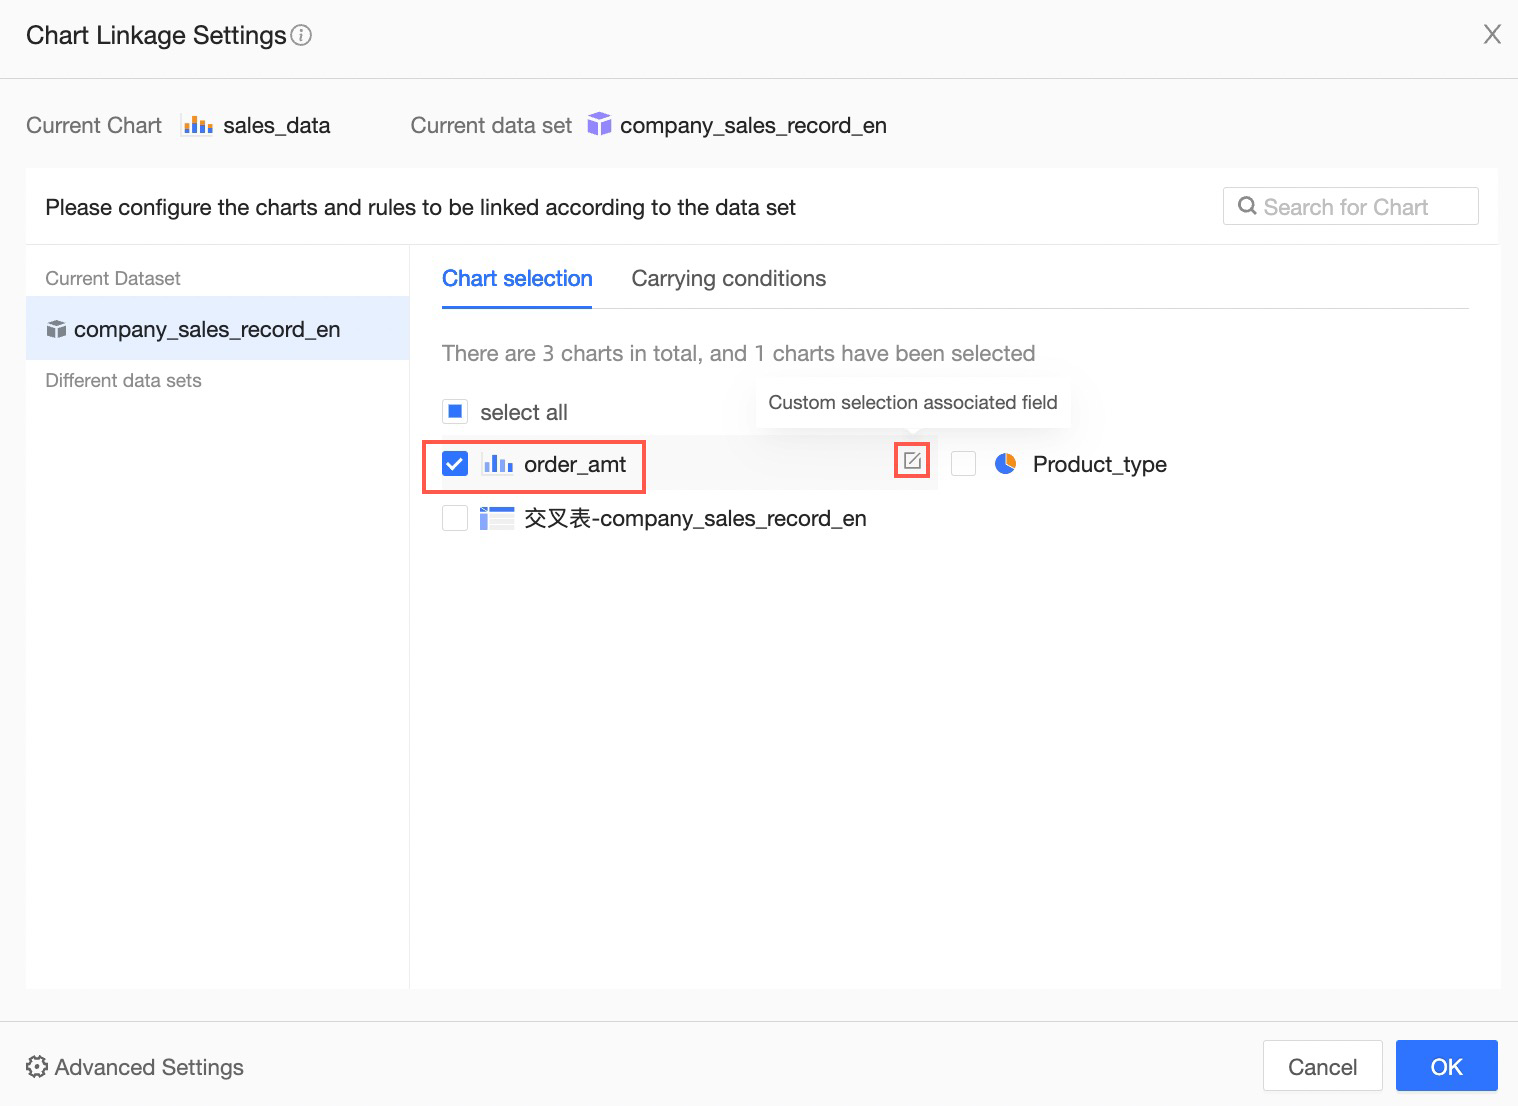
Configure manual linkage
If you have not enabled Auto Linkage, you can configure linkage for individual charts from the Linkage Configuration dialog box.
-
On the Analysis tab for the Order Sales chart, click the
icon next to Linkage. -
On the Chart Linkage Settings page, choose to link charts from the same dataset or different datasets.
 icon next to Linkage.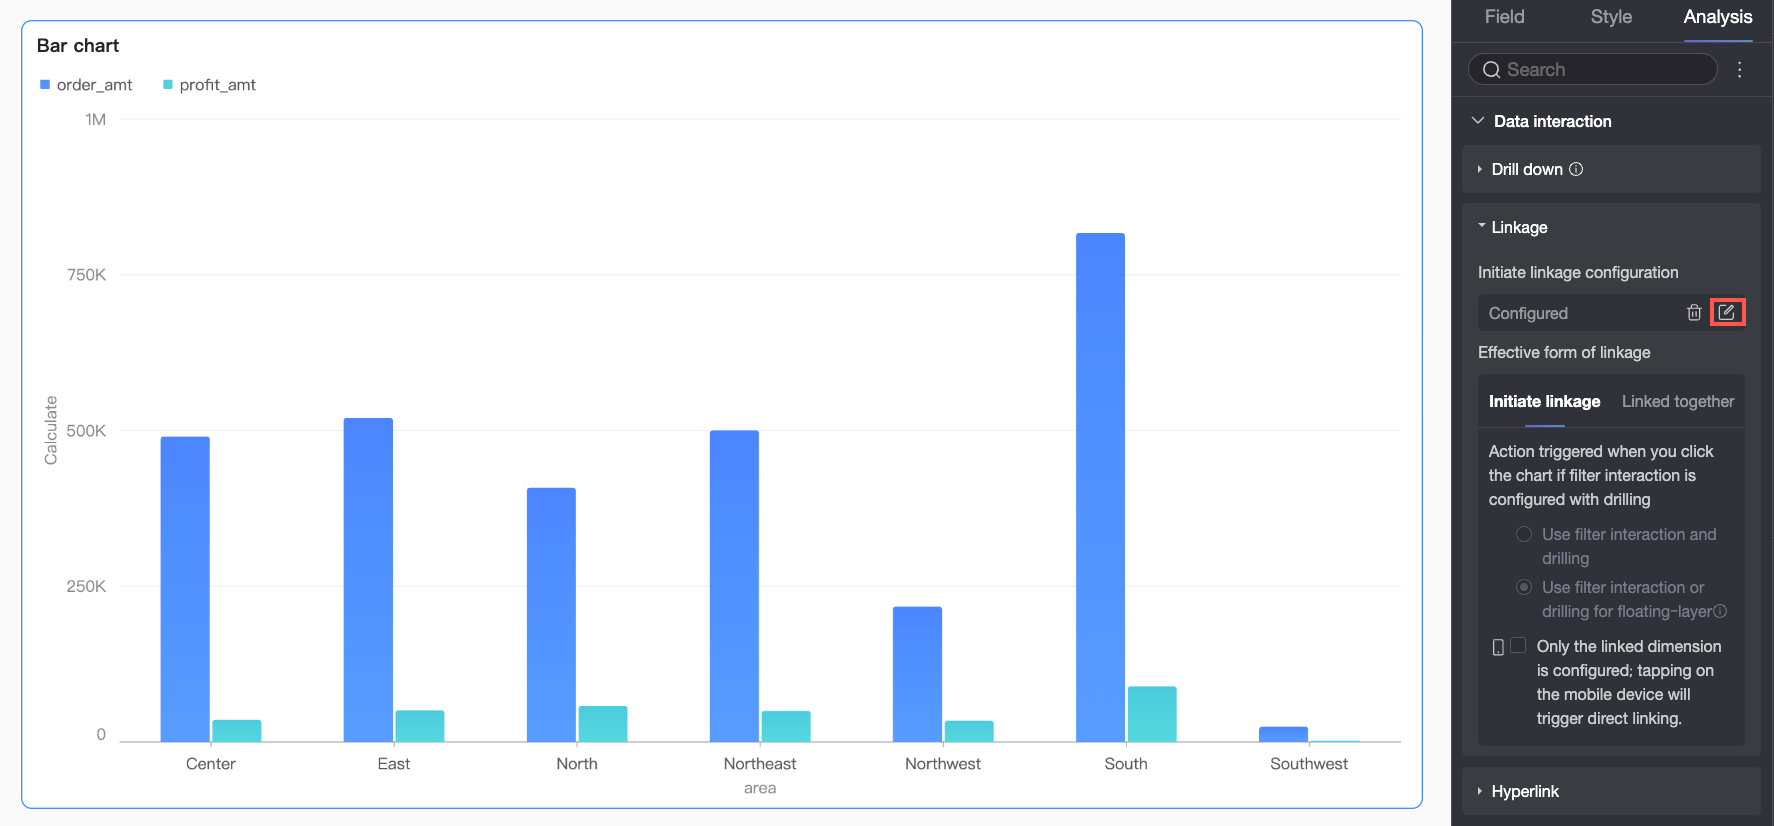
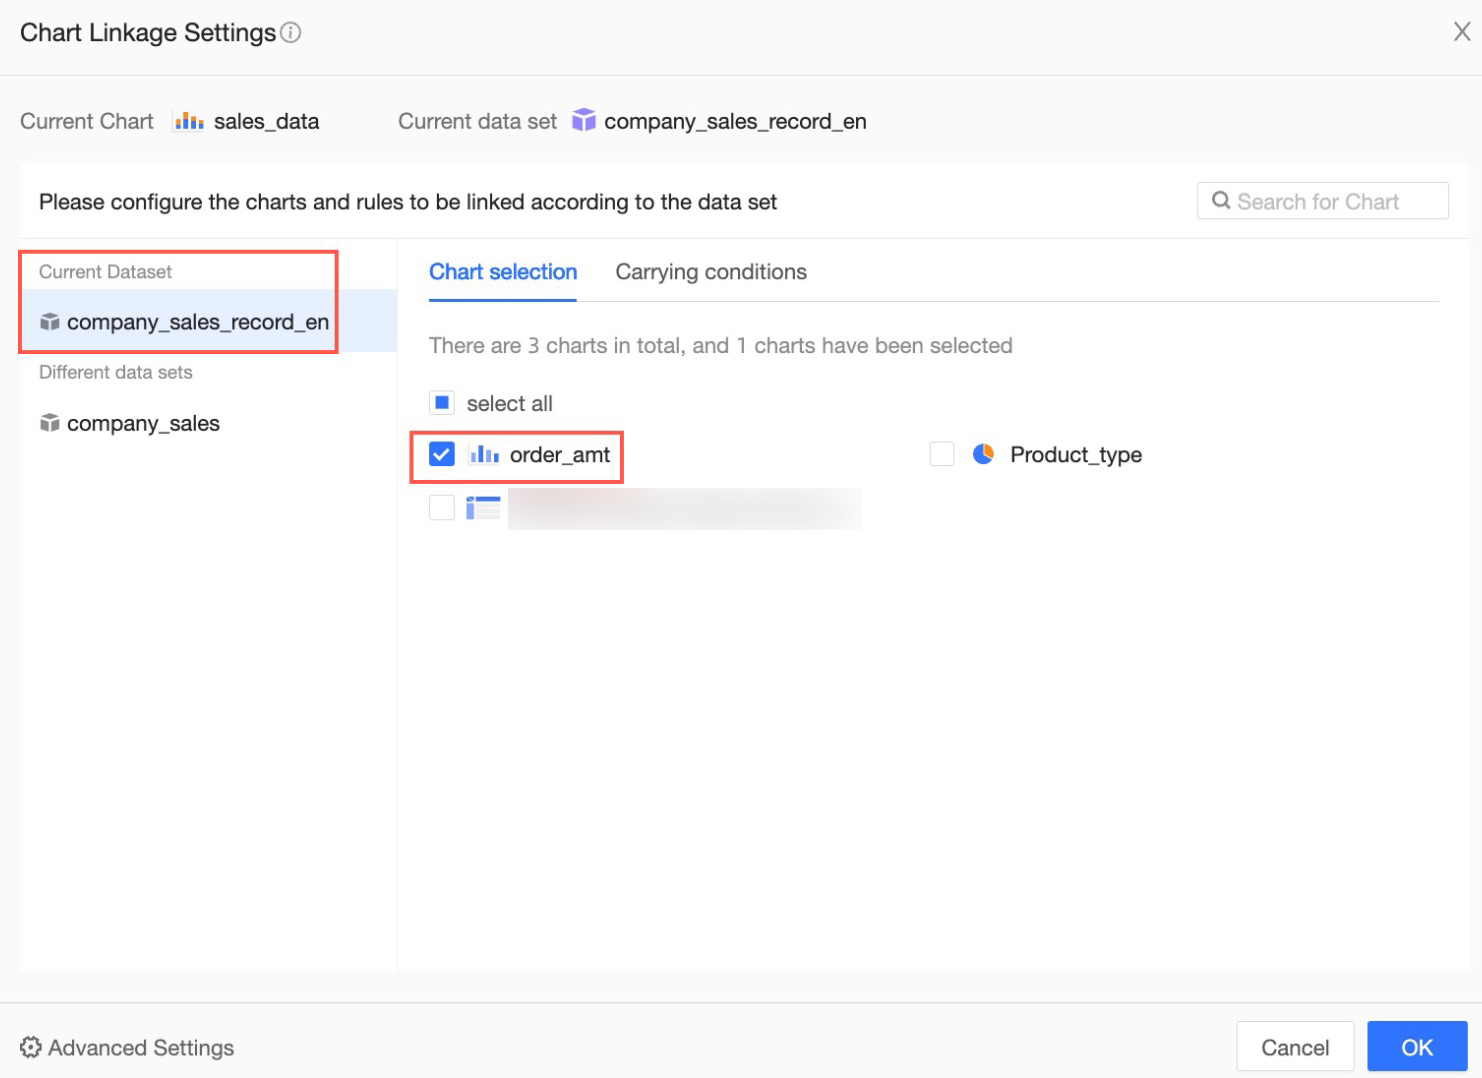
Same dataset
To link charts that belong to the same dataset, configure the settings on the Same Dataset tab. For example, select Regional Order Count Overview and click OK.
Different datasets
To link charts that belong to different datasets, configure Field Mapping Rules on the Different Datasets tab.
-
Select the dataset to link and click Add Field Mapping Rule.
-
Enter a custom Mapping Field Name (①) and click Save (②). Then, configure the field mapping relationship between the datasets (③) by selecting a field from the Current Chart Dataset and a corresponding field from the Linked Chart Dataset. Finally, select the charts to which the mapping rule applies (④) and click OK in the lower-right corner to complete the configuration (⑤).
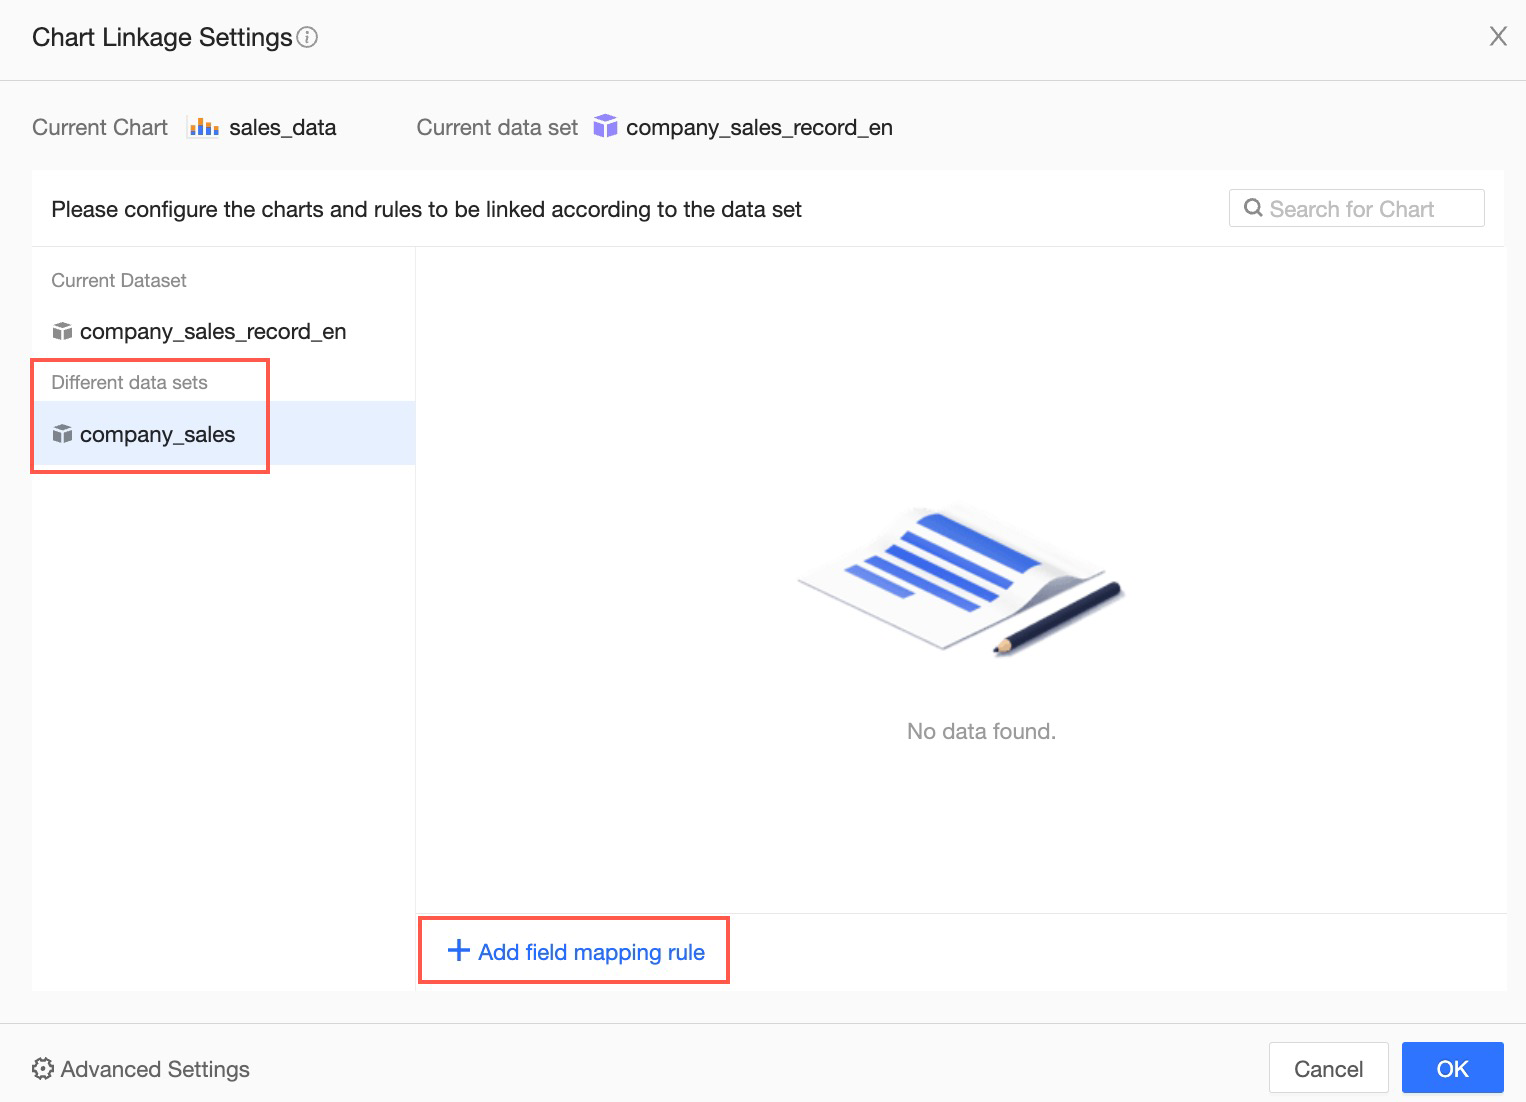
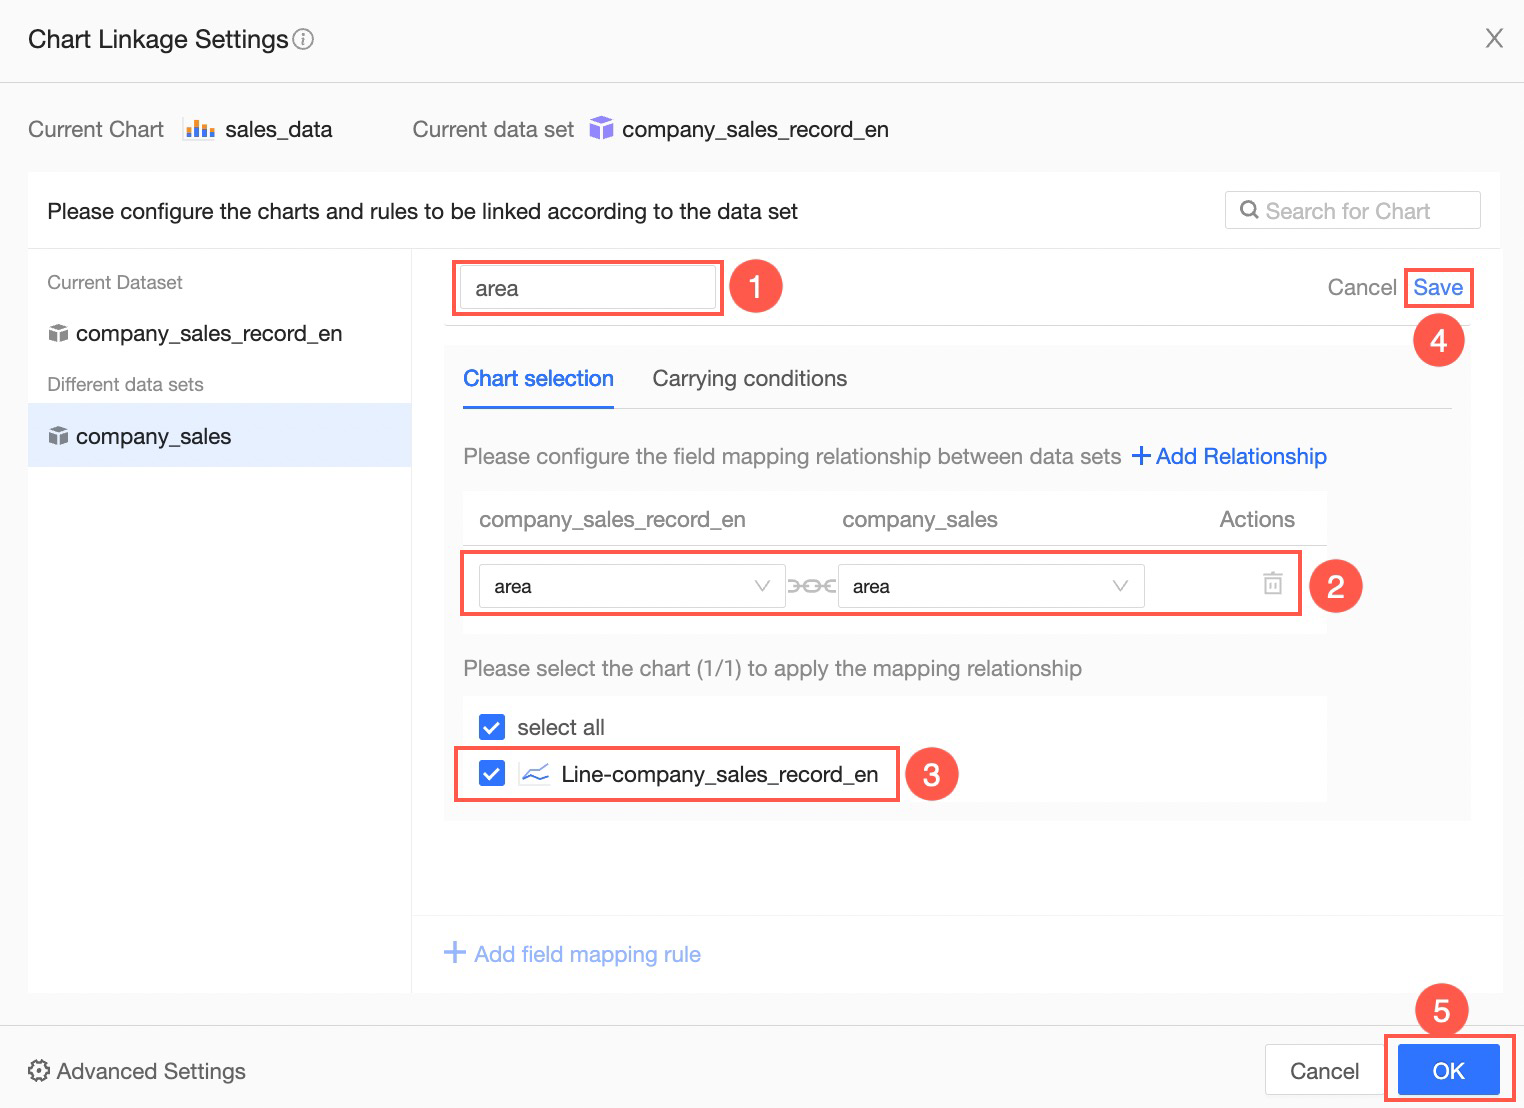
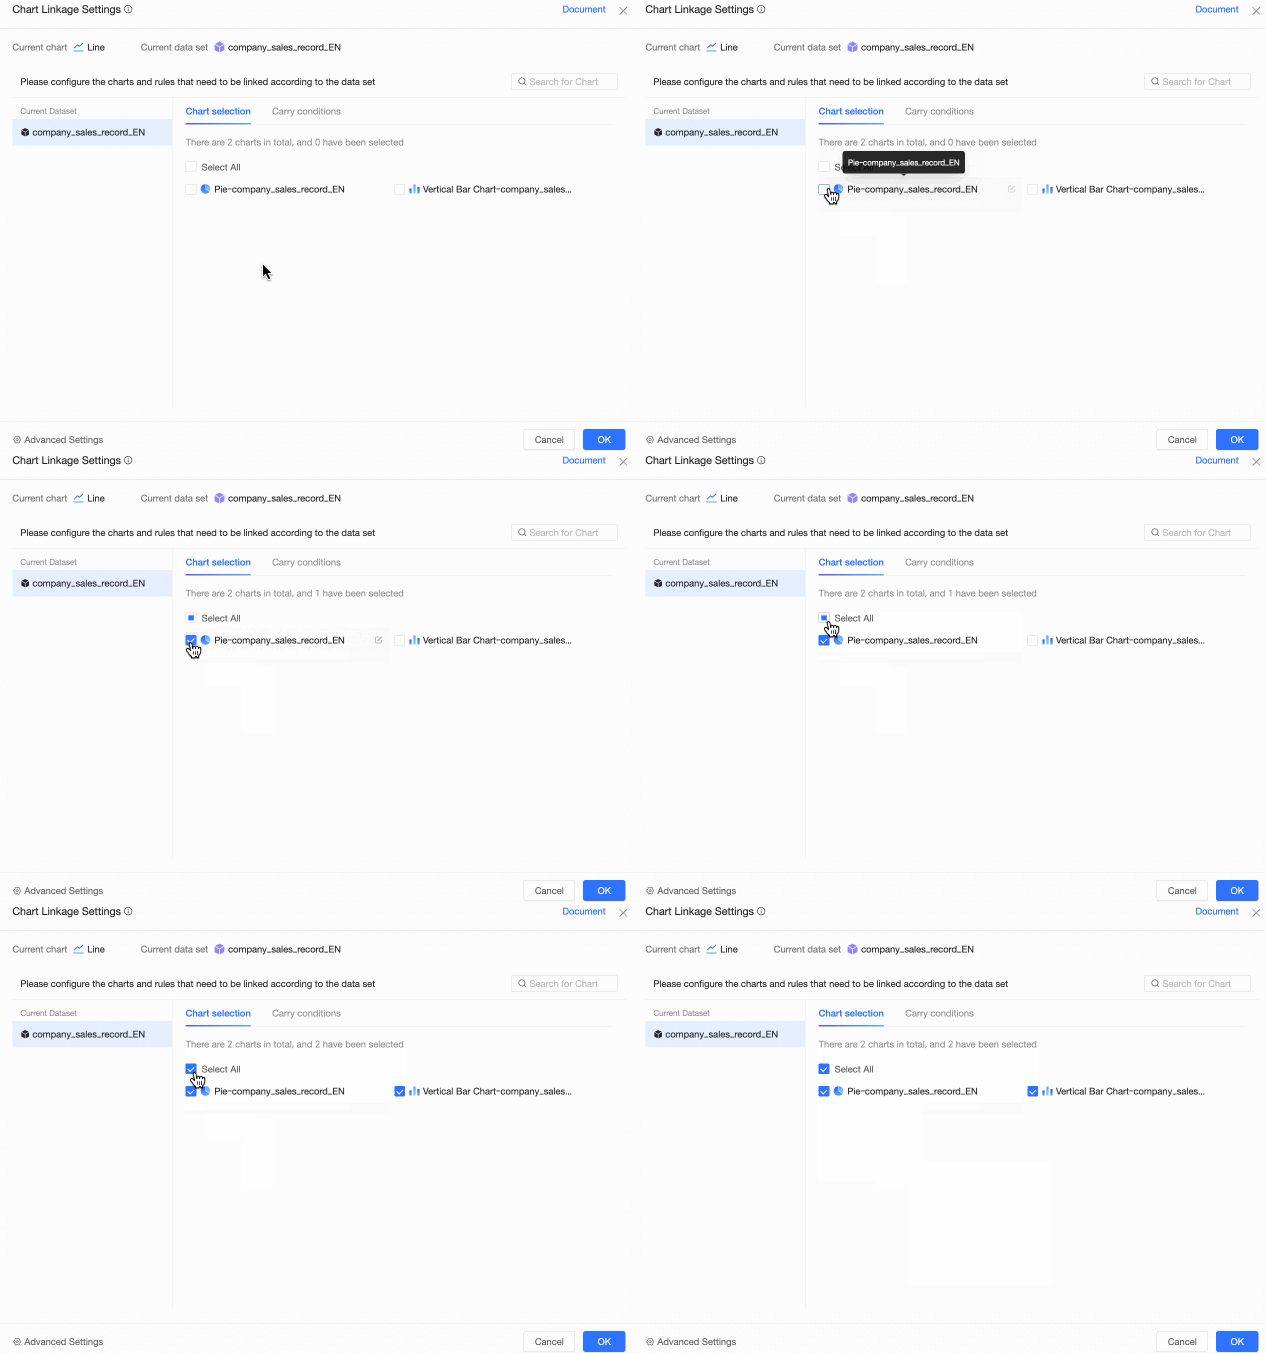
Chart selection
You can select one or more charts to link, or select all of them. If there are many charts, you can search for a chart by its name. You can also select all charts in the Search Results. For example, if you search for "Annual" and there are four results, selecting all will select those four charts.
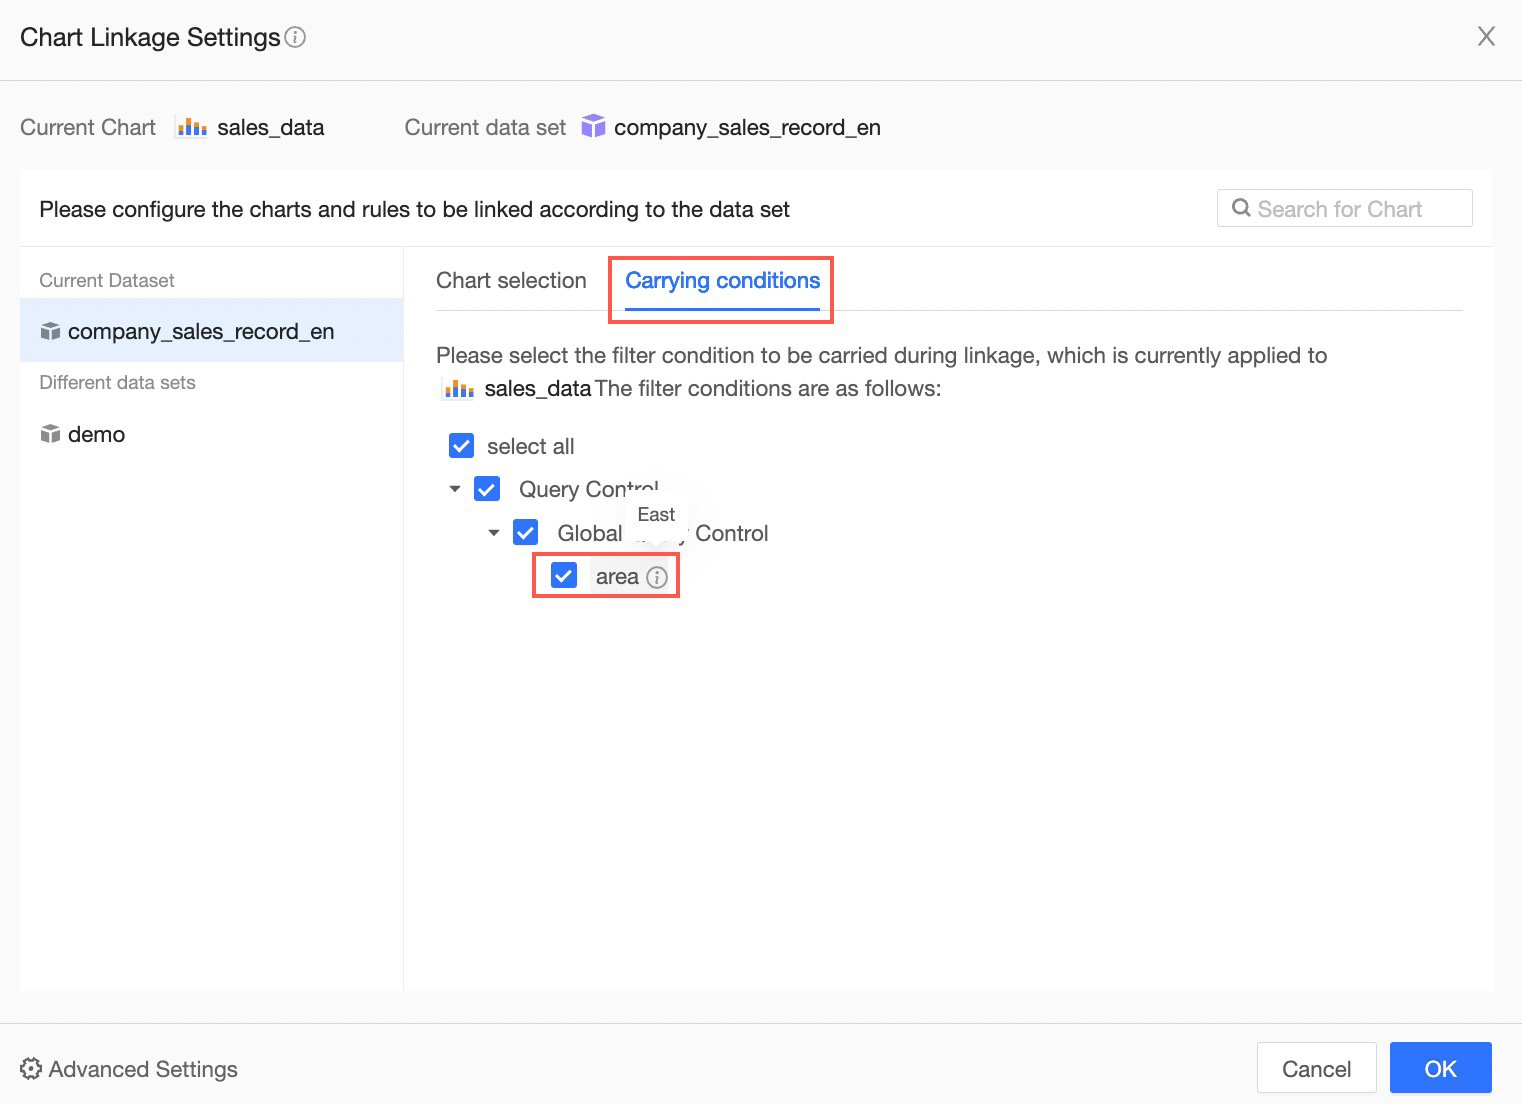
Carry-over conditions
If the dashboard is configured with a Query Control, you can select the query conditions to carry over during linkage in the Carry-over Conditions section. For example, to carry over the condition where Region is East China, select its checkbox.
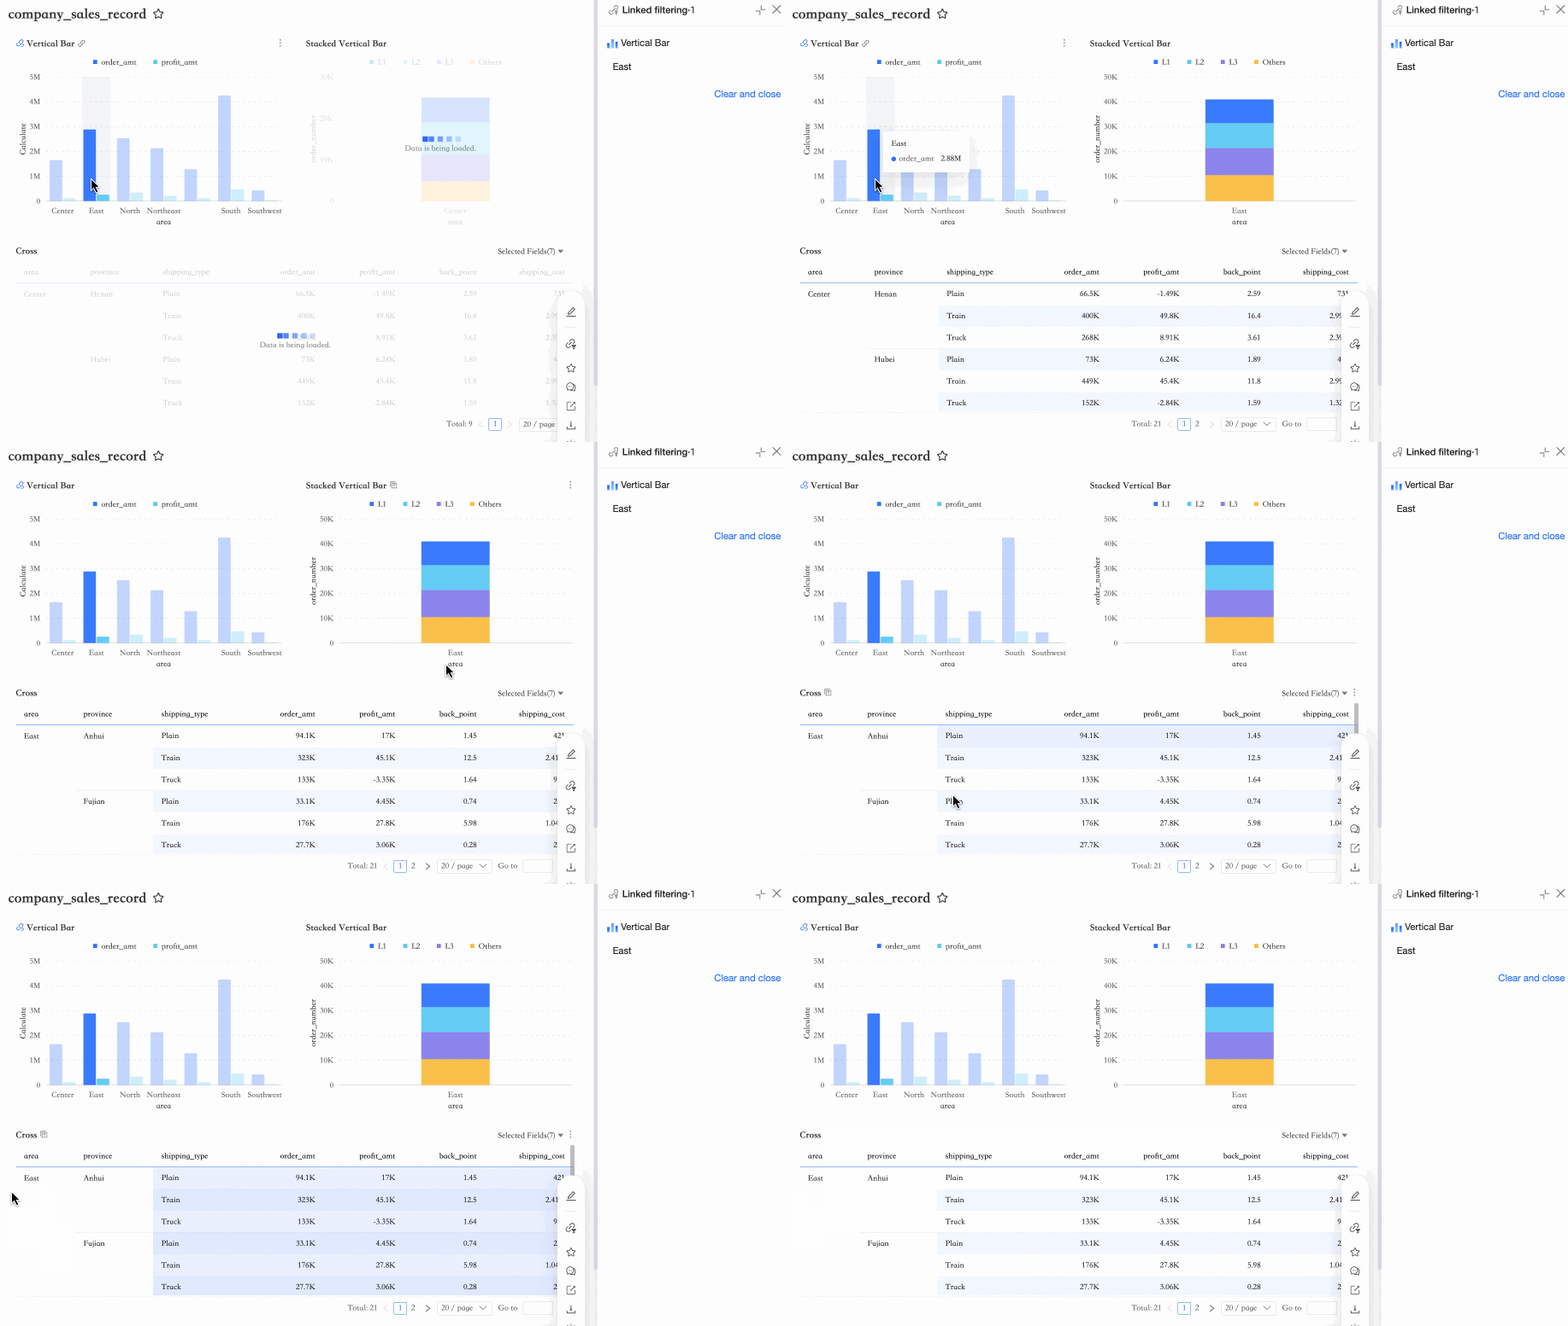
Configuration result
When you click the East China region in the Regional Order Sales chart, the linked Regional Order Data Overview chart from the same dataset displays data for the East China region. At the same time, the linked crosstab from a different dataset displays data where the area field is East China.
Configure linkage activation modes
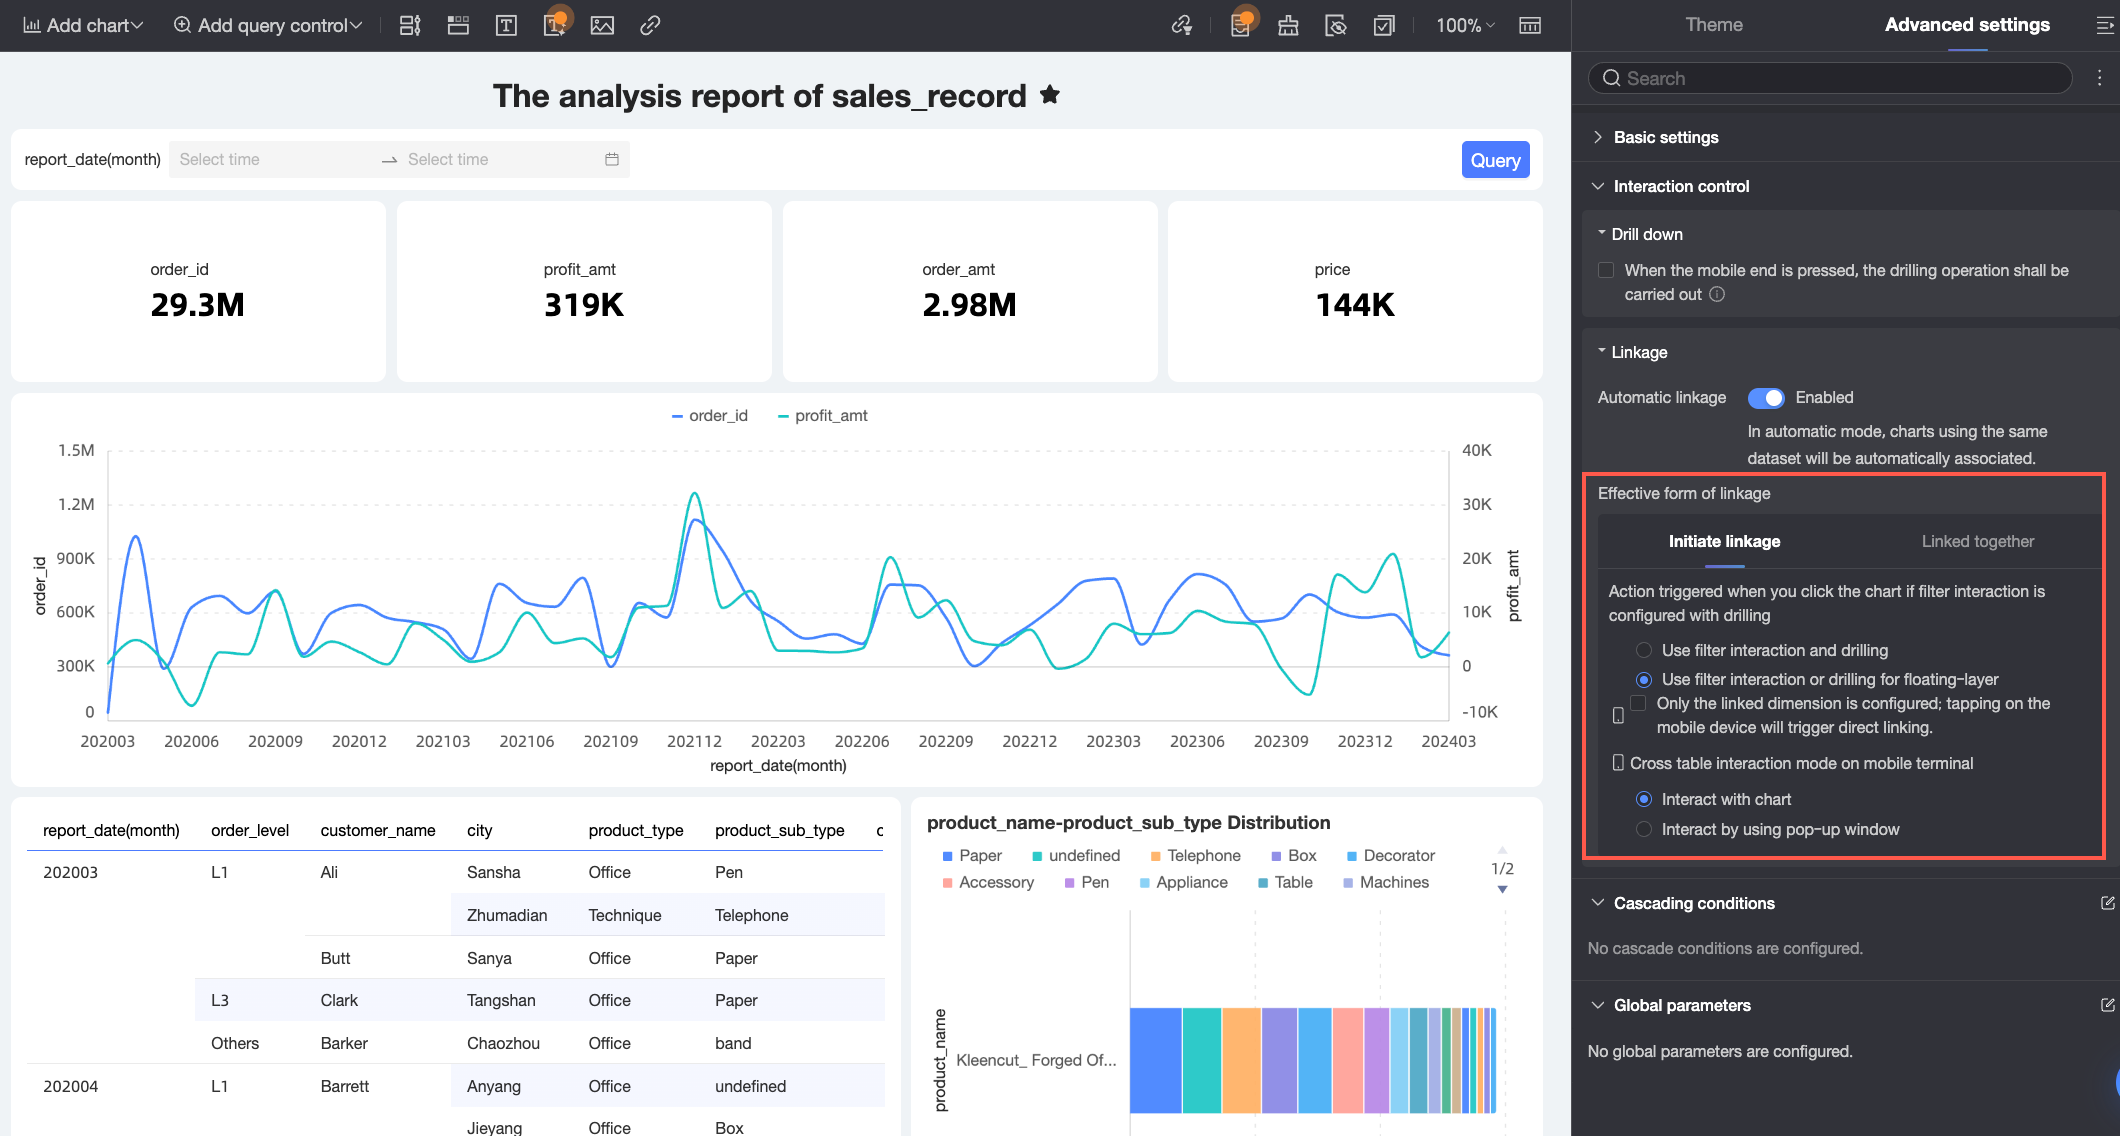
Set global activation modes for chart linkage, which control how charts initiate linkage and how they respond to being linked.
-
Click Page Settings at the top of the dashboard edit page. On the Advanced tab, in the Interaction Control > Linkage > Linkage Activation Mode section, configure the linkage activation rules for all charts.
-
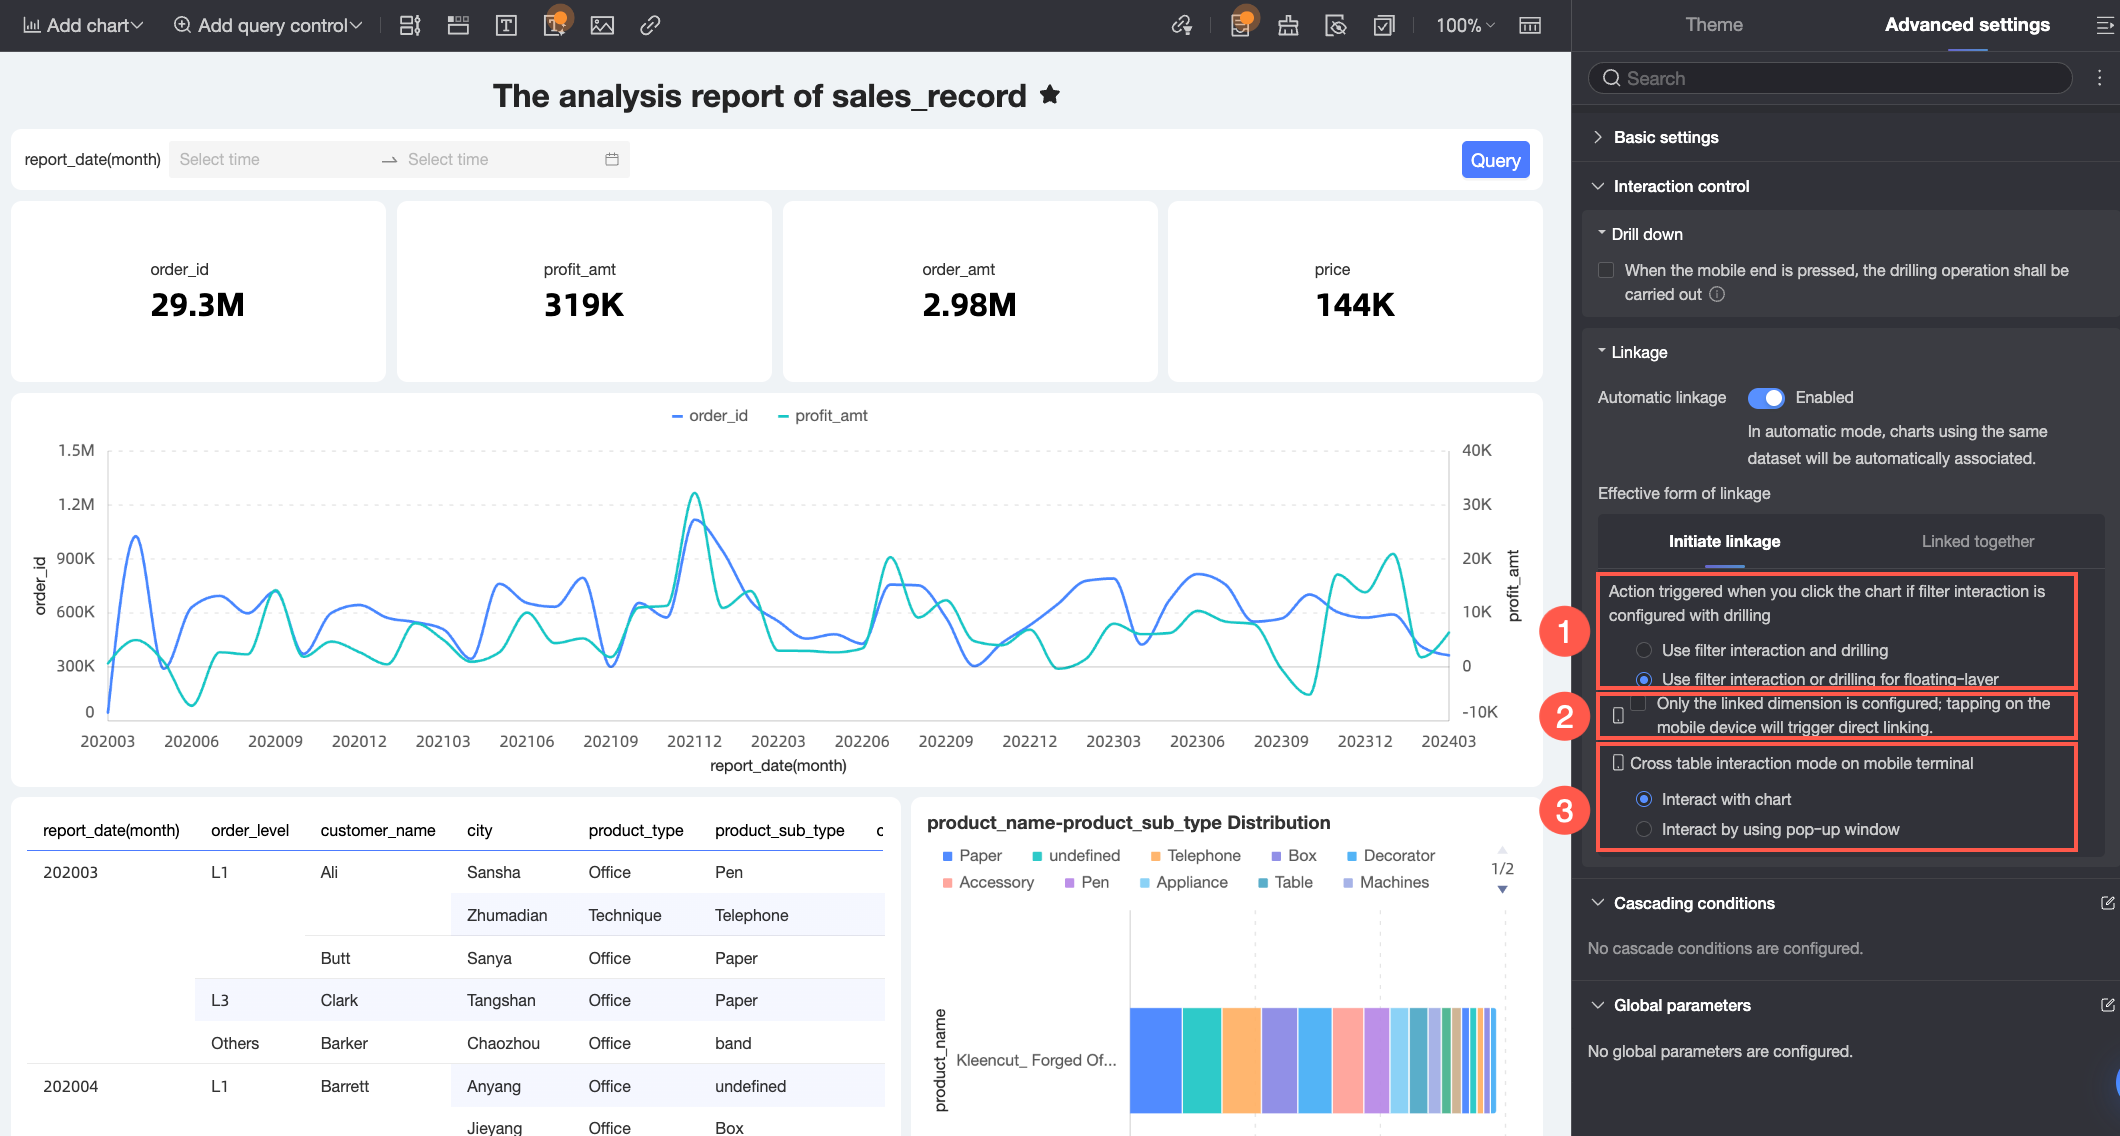
On the Initiate Linkage tab, set how a source chart initiates linkage. The following settings are supported.
Configuration
Description
① Linkage initiation method
Sets the linkage initiation method for when a dimension is configured for both linkage and drill-down.
-
Apply Simultaneously: When a user clicks a data point for the linked dimension, both linkage and drill-down occur simultaneously.
-
Select Linkage or Drill-down in pop-up: When a user clicks a data point for the linked dimension, a pop-up appears, requiring the user to choose whether to perform a linkage or drill-down action.
② Mobile linkage method
Sets the linkage initiation method on mobile devices for when a chart dimension is configured only for linkage, but not for drill-down or navigation.
-
If you select this option, it enables Direct Linkage. When you tap a data point, the system directly filters other linked charts on the dashboard based on the selected value.
-
If you do not select this option, it enables Manual Trigger. When you tap a data point, the system highlights the data point and presents the linkage action in a pop-up or tooltip, requiring you to manually confirm the action.
NoteFor detail tables and metric boards, if only linkage is configured, the initiation method defaults to Direct Linkage.
③ Mobile crosstab linkage method
Sets the linkage method for crosstabs on mobile devices.
-
Direct Linkage: Directly filters linked charts on the current dashboard based on the value you select in the crosstab.
-
Pop-up Linkage: Opens a pop-up window where linked charts are filtered based on the value you select in the crosstab.
-
-
On the Linked Response tab, set how a linked chart displays data after receiving linkage conditions. The following settings are supported.
Configuration
Description
① Linkage response method
Sets the response method for all linked charts. Filter Linkage and Highlight Linkage are supported.
-
Filter Linkage: When linked, the chart filters its data based on the linkage condition and displays only the matching data.
-
Highlight Linkage: When linked, the chart highlights the data points that match the linkage condition while keeping other data points visible.
② Linkage and drill-down handling
Sets how a chart that has already been drilled down responds to being linked.
-
Clear: Clears the drill-down state of the chart and refilters or highlights data based on the new linkage condition.
-
Keep: Keeps the drill-down state of the chart and applies the new filter or highlight based on the linkage condition.
-
-
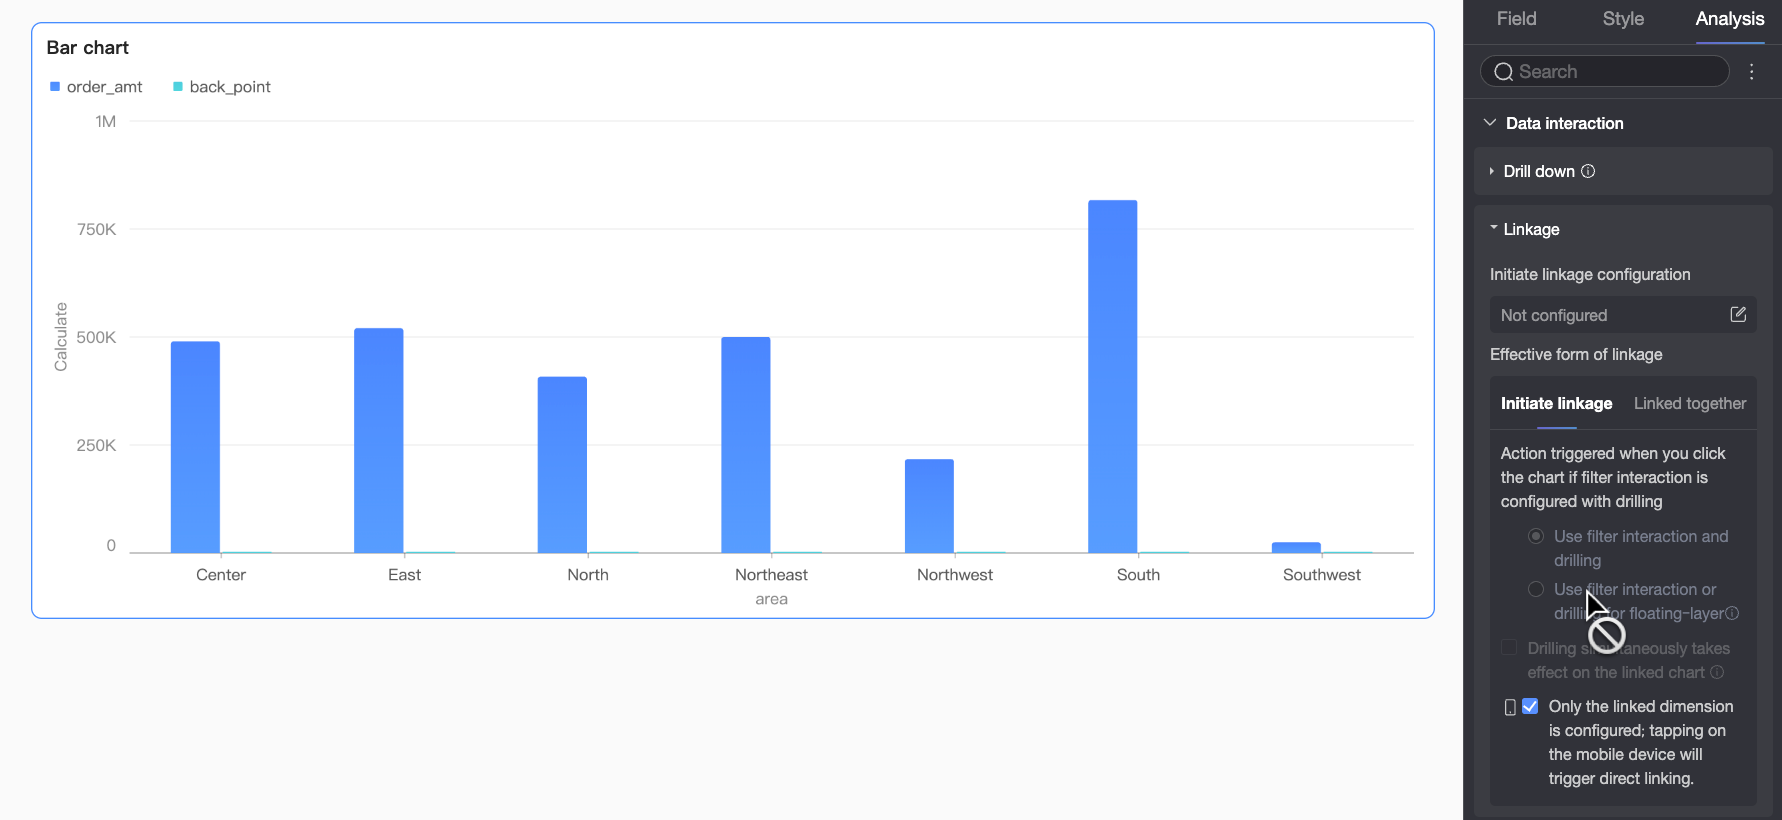
To set the linkage activation mode for an individual chart, go to the Data Interaction section on the chart's Analysis tab.
For example, assume the global response method for linked charts is set to filter linkage. However, for certain column/bar and pie/doughnut charts, you might prefer highlight linkage to emphasize specific data points while maintaining the overall data view. In this case, you can go to the Analysis tab for those charts and set their individual response method to highlight linkage.
Note-
If the Linkage Response Method in the dashboard's Page Settings differs from the setting in an individual chart's Data Interaction section, the chart's individual Data Interaction setting takes precedence.
-
You must configure drill-down for the current chart to enable the Initiate Linkage method for when a linked dimension also has drill-down configured. If drill-down is not configured, this option is grayed out and unavailable.
-


Cancel linkage
You can cancel a linkage in several ways.
Cancel linkage from the filter pane (batch operation)
Desktop
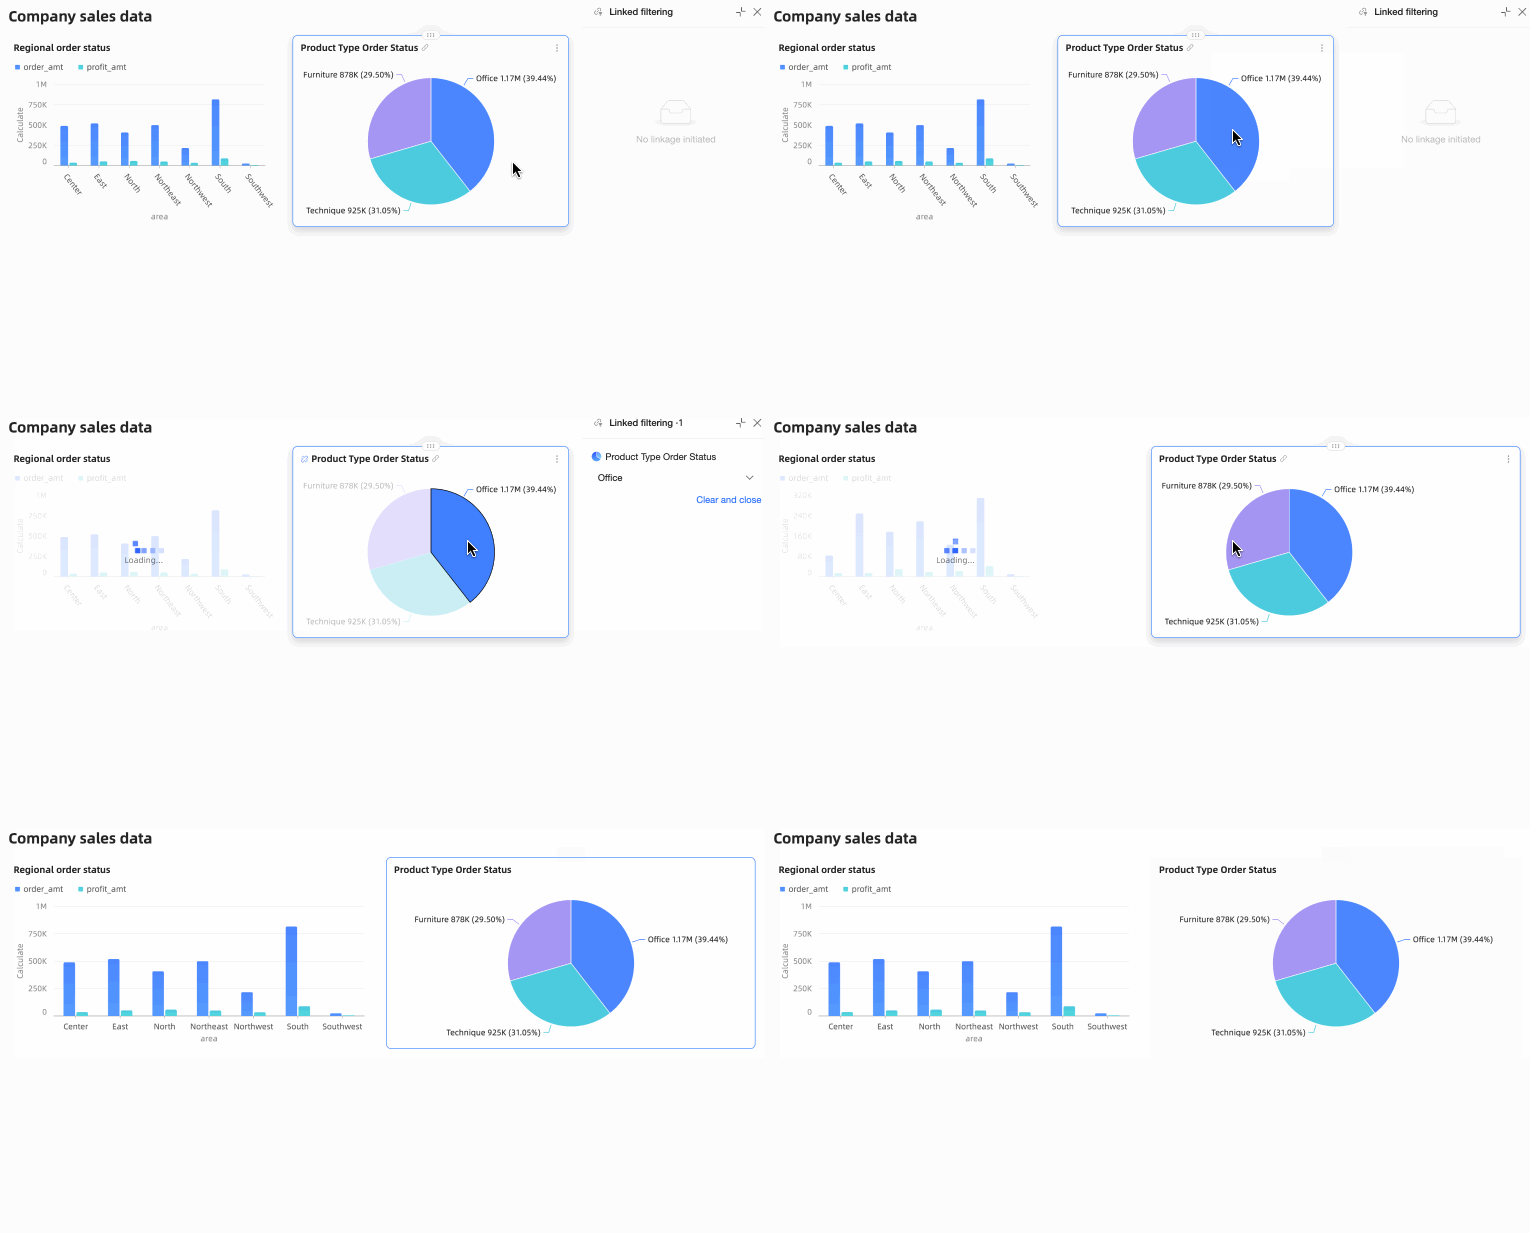
On the dashboard, open the linkage filter pane. Here, you can remove individual linkage items or clear all linkage items displayed in the pane.
-
Clear a single item: To cancel one linkage item, click the
icon in the upper-right corner of its pane. -
Clear in batches: To clear all linkage settings, click Clear and Close. For more information about the filter pane, see Linkage filter pane in this topic.
 icon in the upper-right corner of its pane.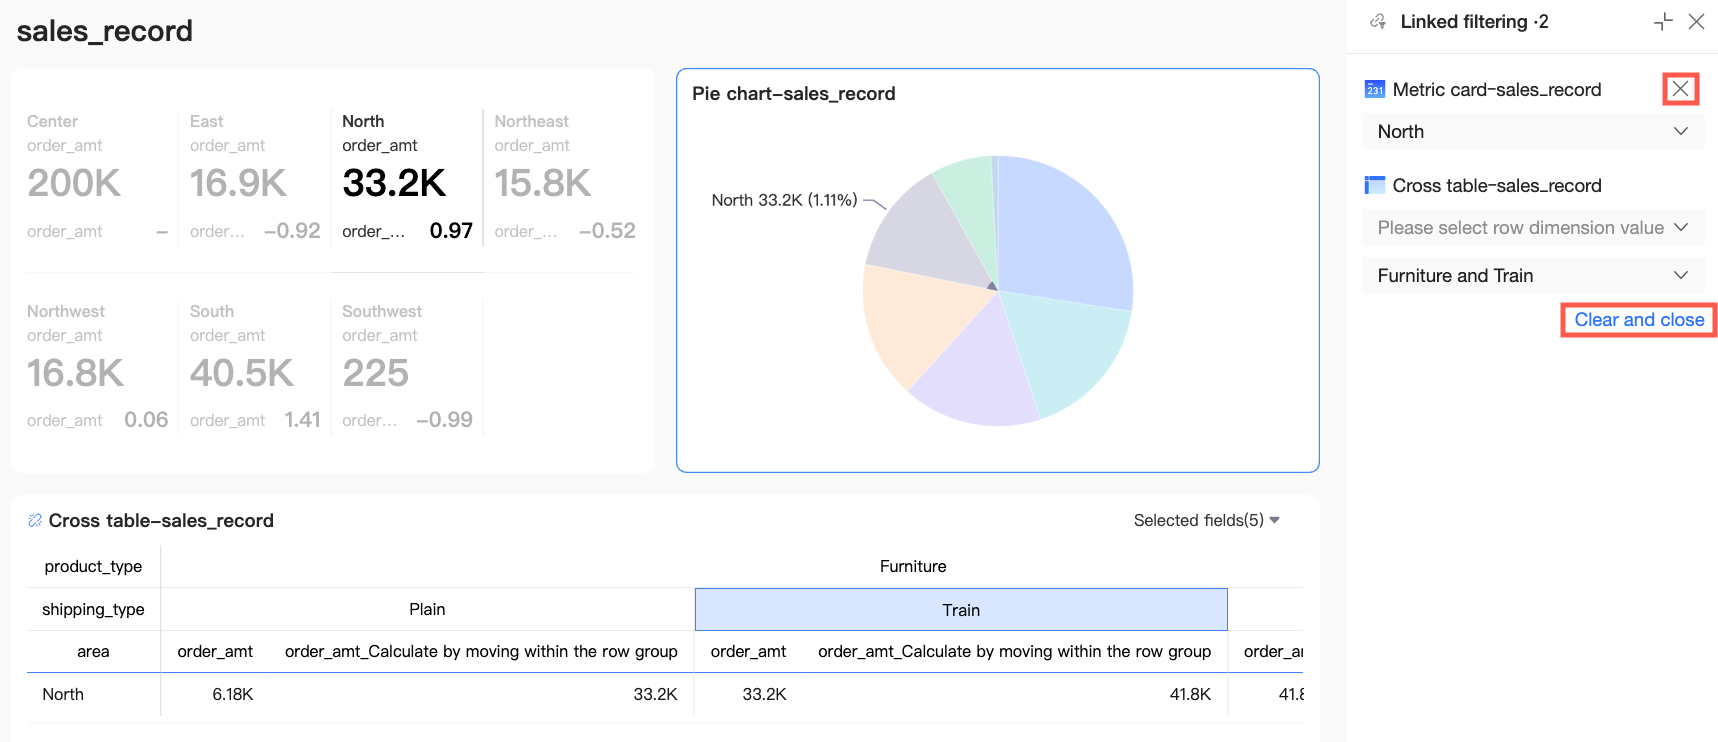
Mobile
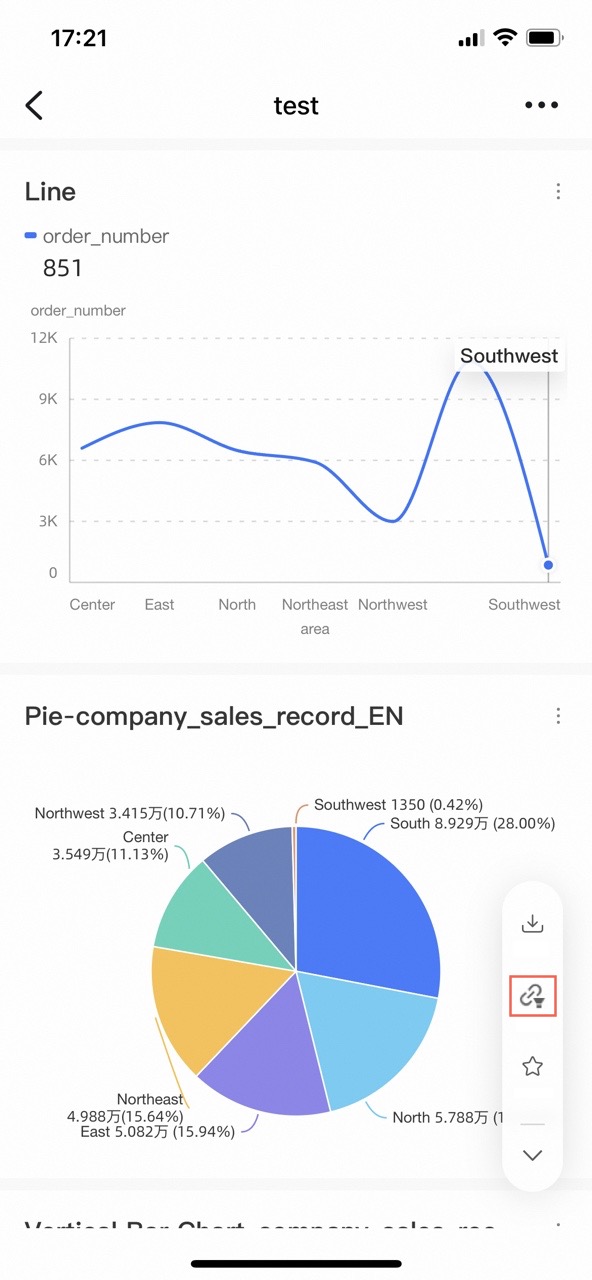
On the mobile interface, tap the Linkage icon in the preview function bar on the right to clear all linkage history.
Cancel linkage within a chart
-
You can click the
icon in the upper-left corner of the chart to Cancel Linkage. -
Alternatively, click the selected item again to cancel the linkage.
 icon in the upper-left corner of the chart to Cancel Linkage.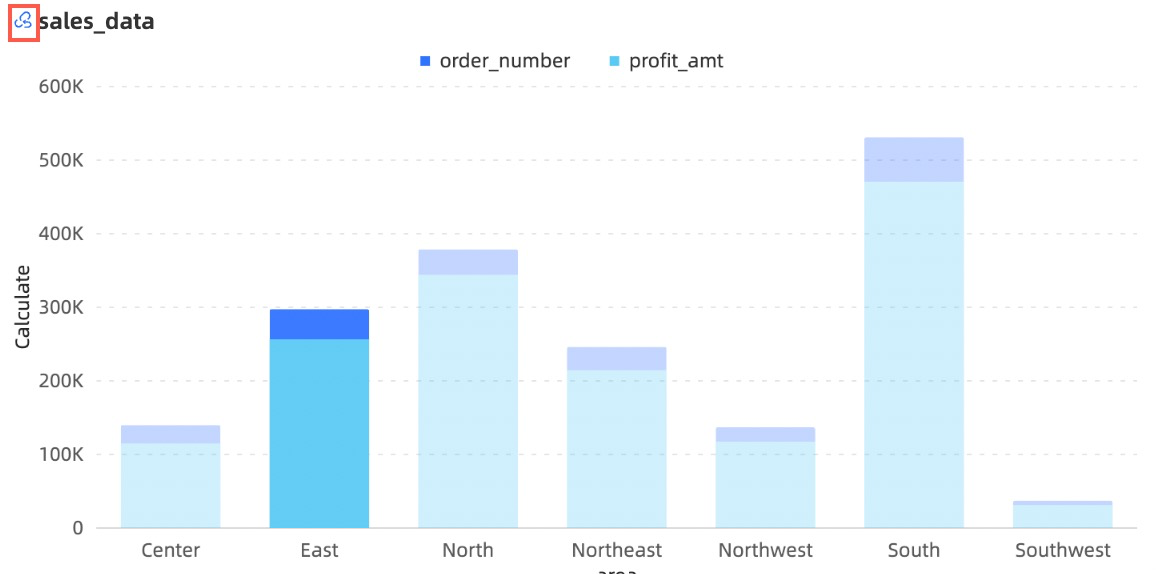
Linkage filter pane
The linkage filter pane shows the source charts and linked values for your dashboard. Use it to view data relationships, change linked values, or clear linkages.
How to open
You can open the linkage filter pane from the dashboard edit page or the preview page.
-
Dashboard edit page
Click the
icon in the toolbar to open the linkage filter pane. -
Dashboard preview page
Click the
icon in the toolbar on the lower right to open the linkage filter pane.
 icon in the toolbar to open the linkage filter pane.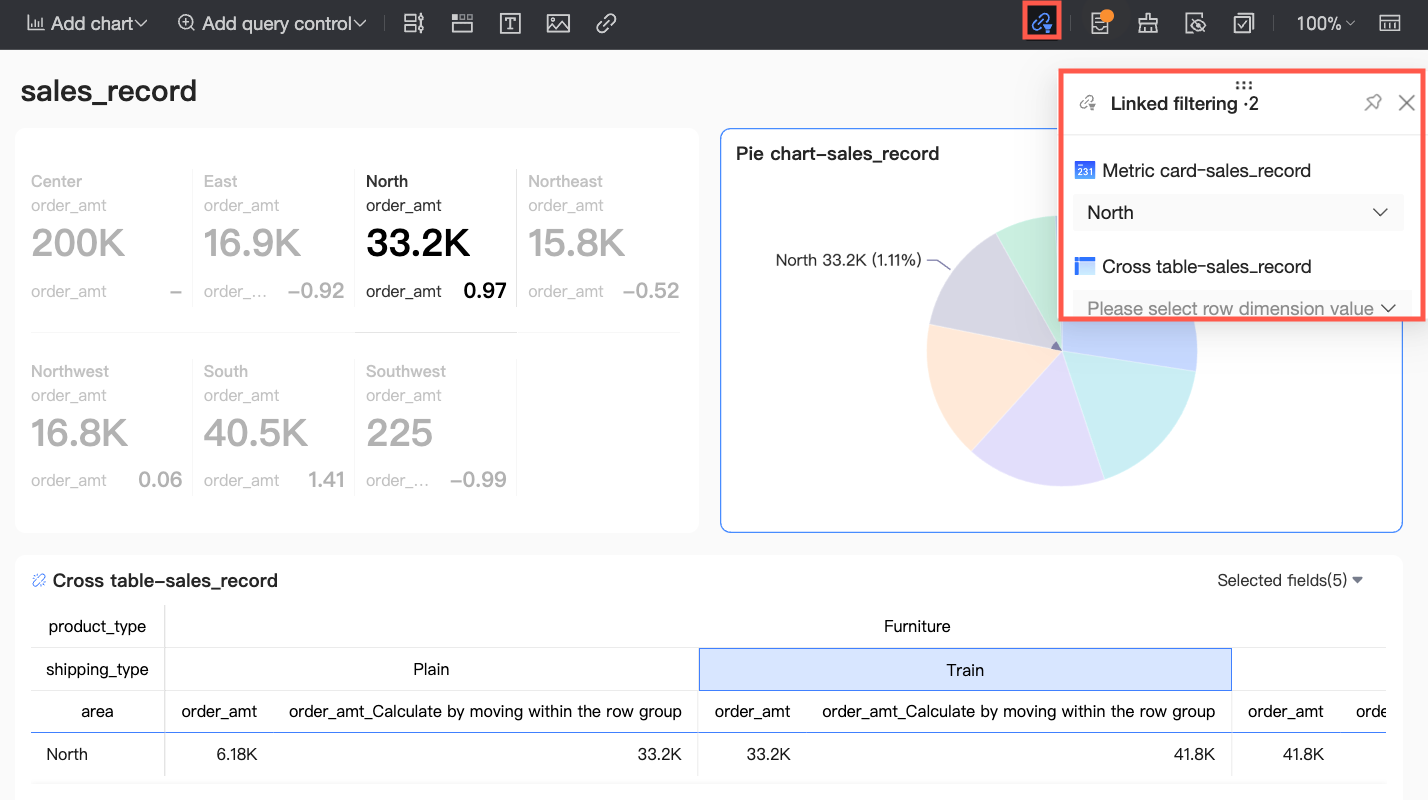
 icon in the toolbar on the lower right to open the linkage filter pane.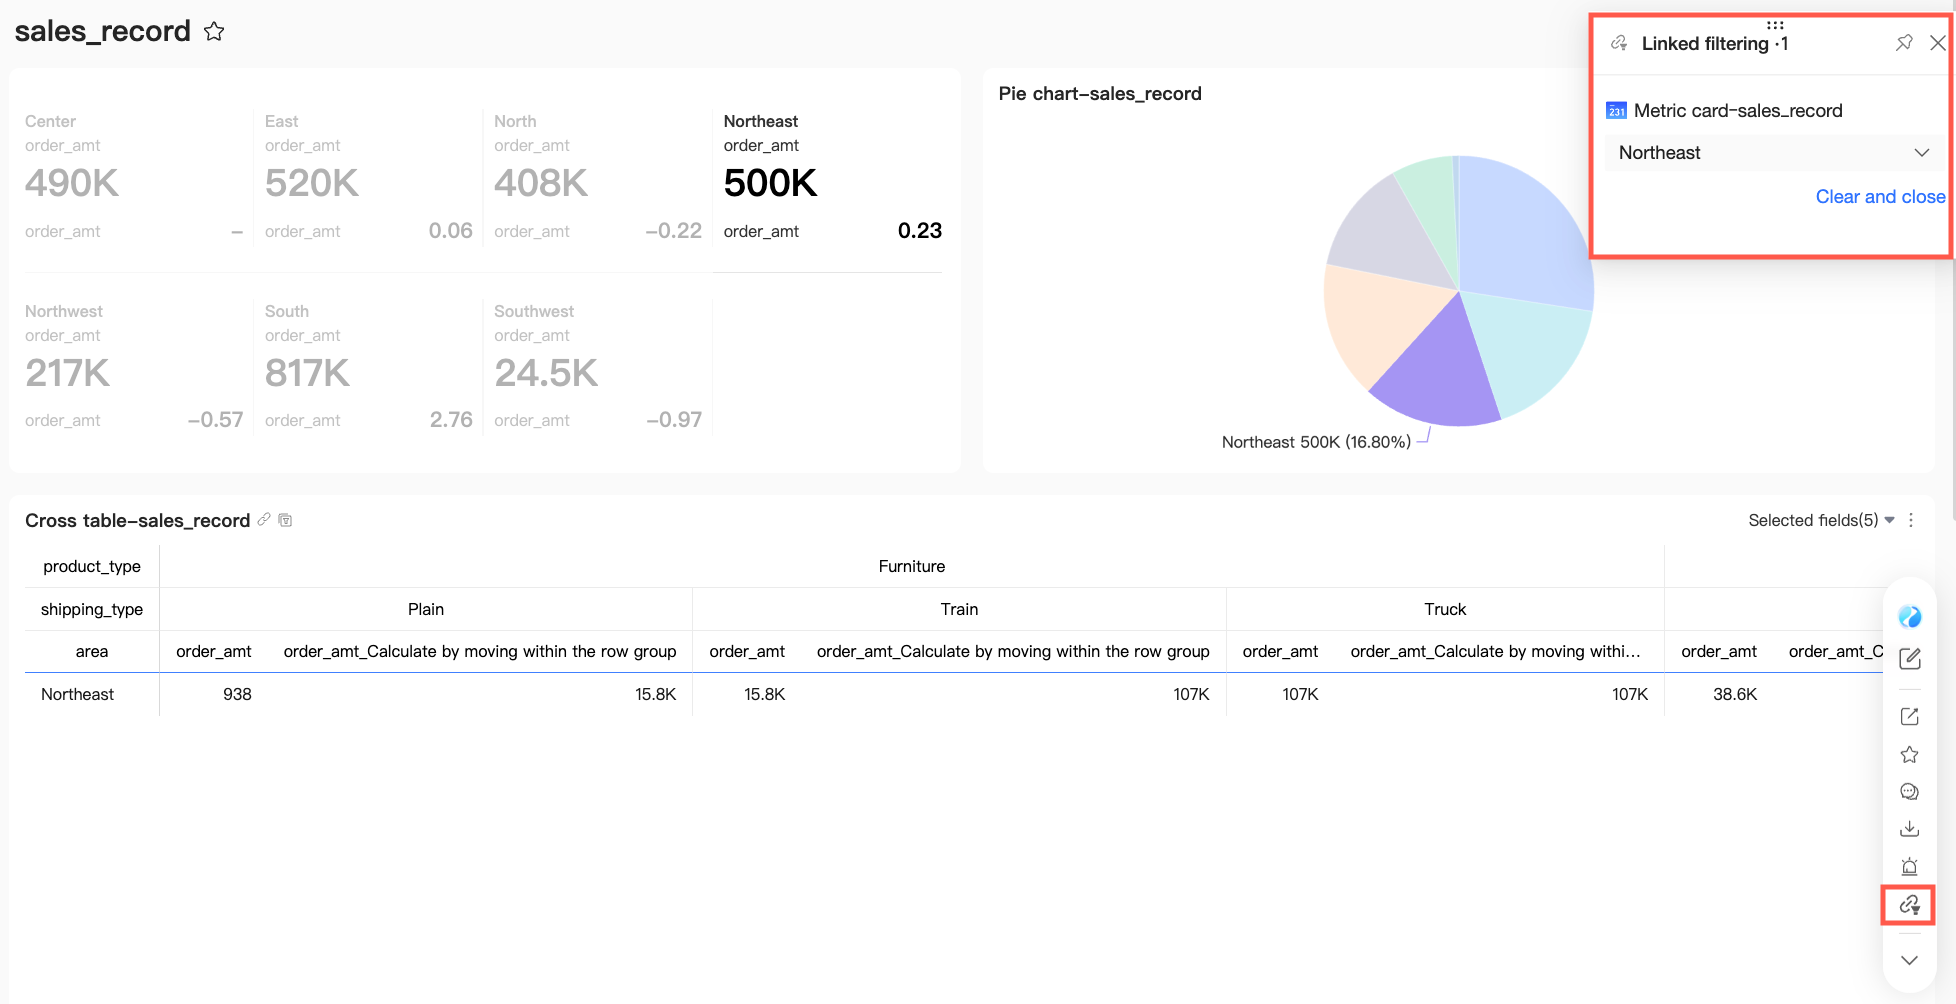
Operations
The linkage filter pane supports the following operations.
|
Actions |
Description |
|
Move the pane |
To move the floating linkage filter pane, hover over the
|
|
Resize the pane |
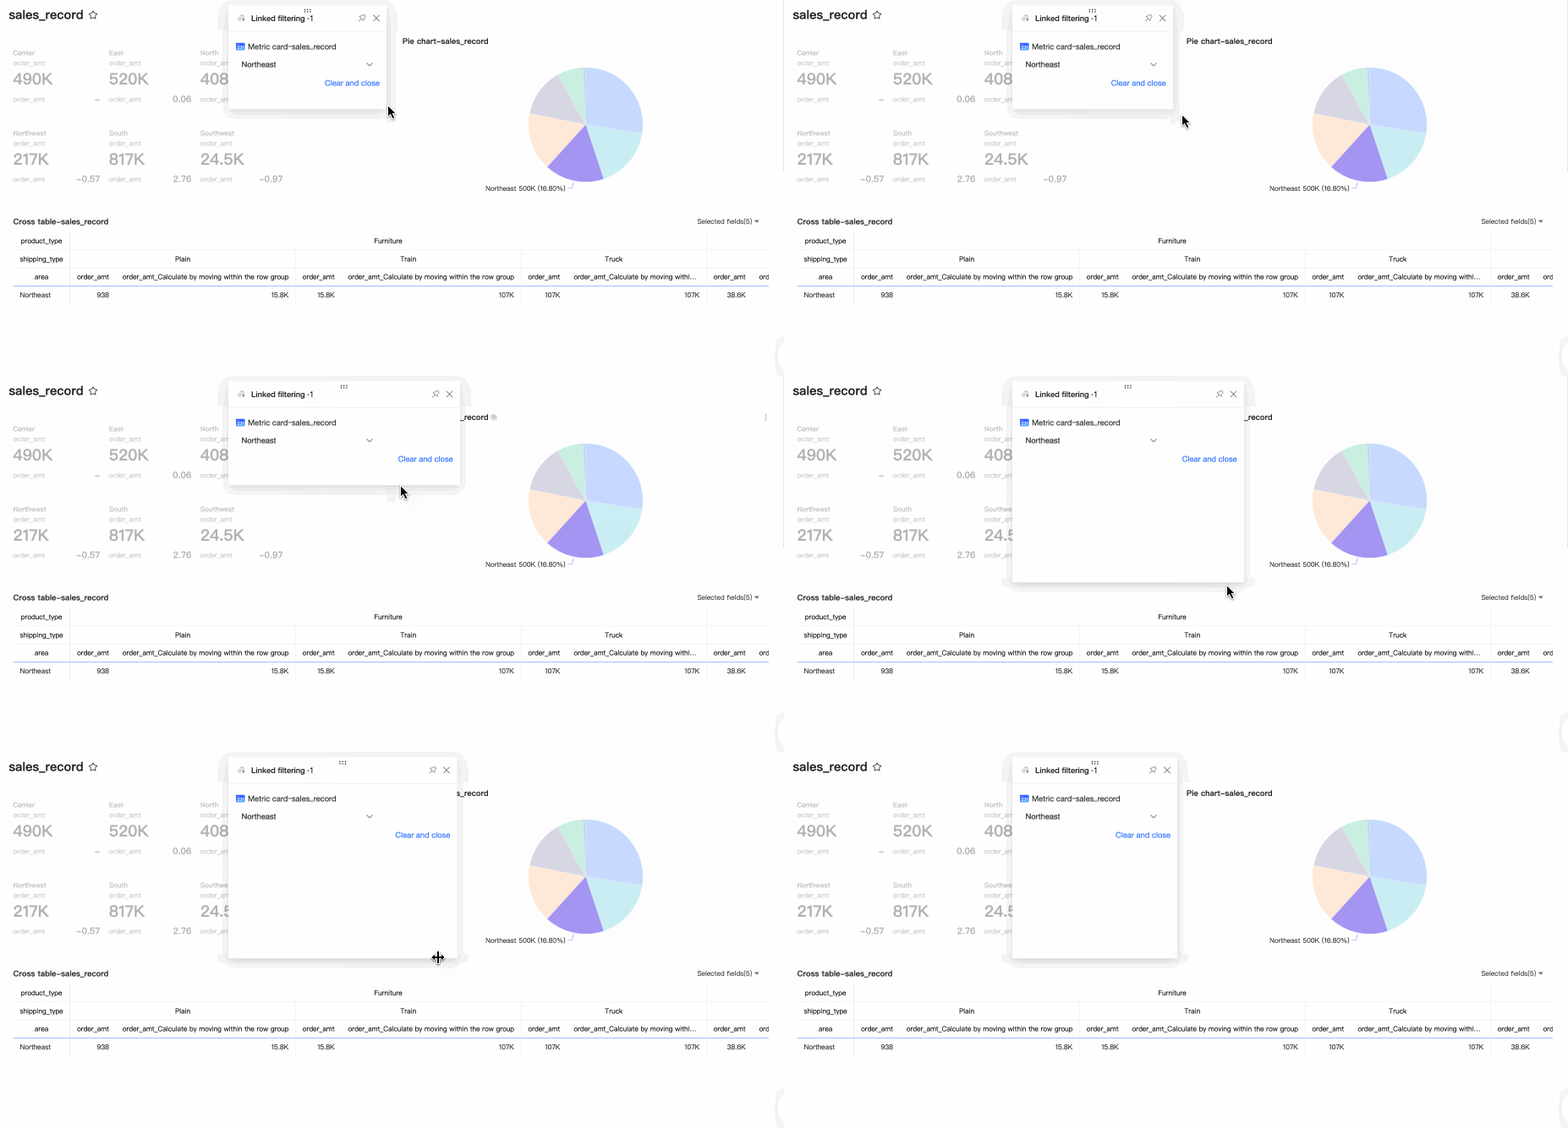
To resize the floating pane, drag its borders. |
|
Pin the pane |
Click the
|
|
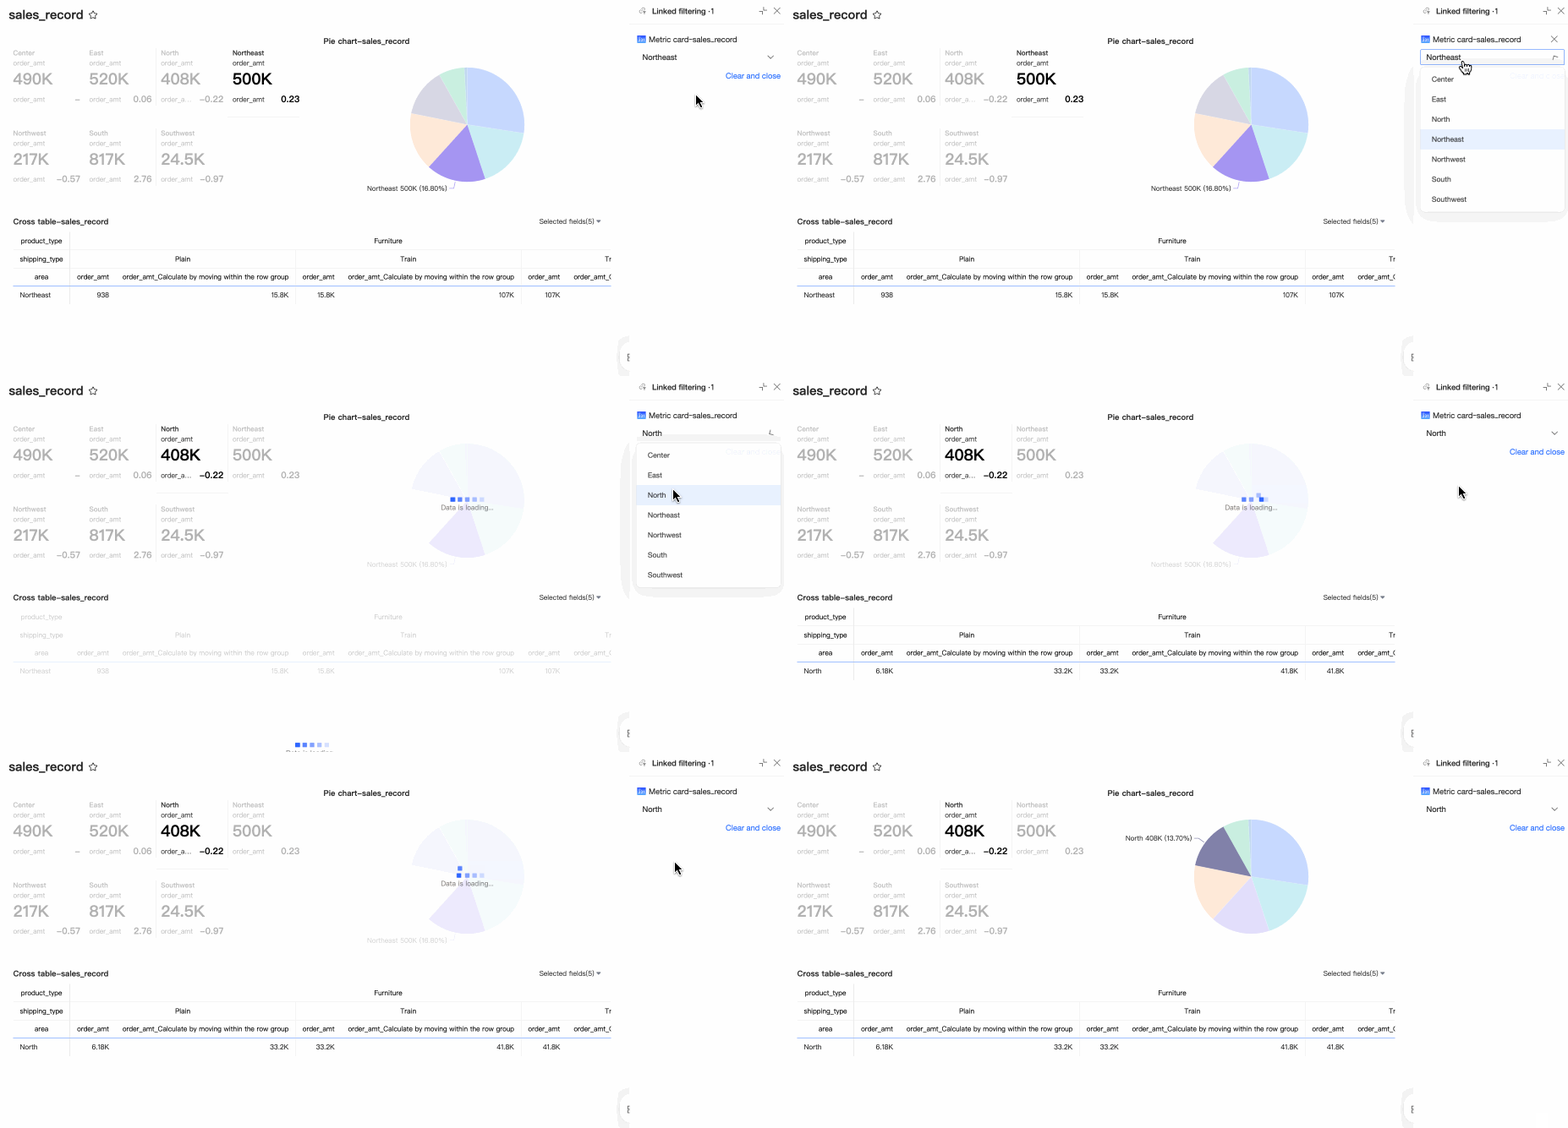
Switch linked values |
You can switch the linked value of the source chart in the linkage filter pane to dynamically adjust the analysis perspective of the global data. For example, when analyzing sales in different regions, you can switch the dimension value of the Region linkage filter condition to quickly compare the performance of different regions. |
|
Clear linked values |
In the linkage filter pane, you can clear a single linkage item or all linkage items in batches.
|
 icon and drag the pane to the desired location.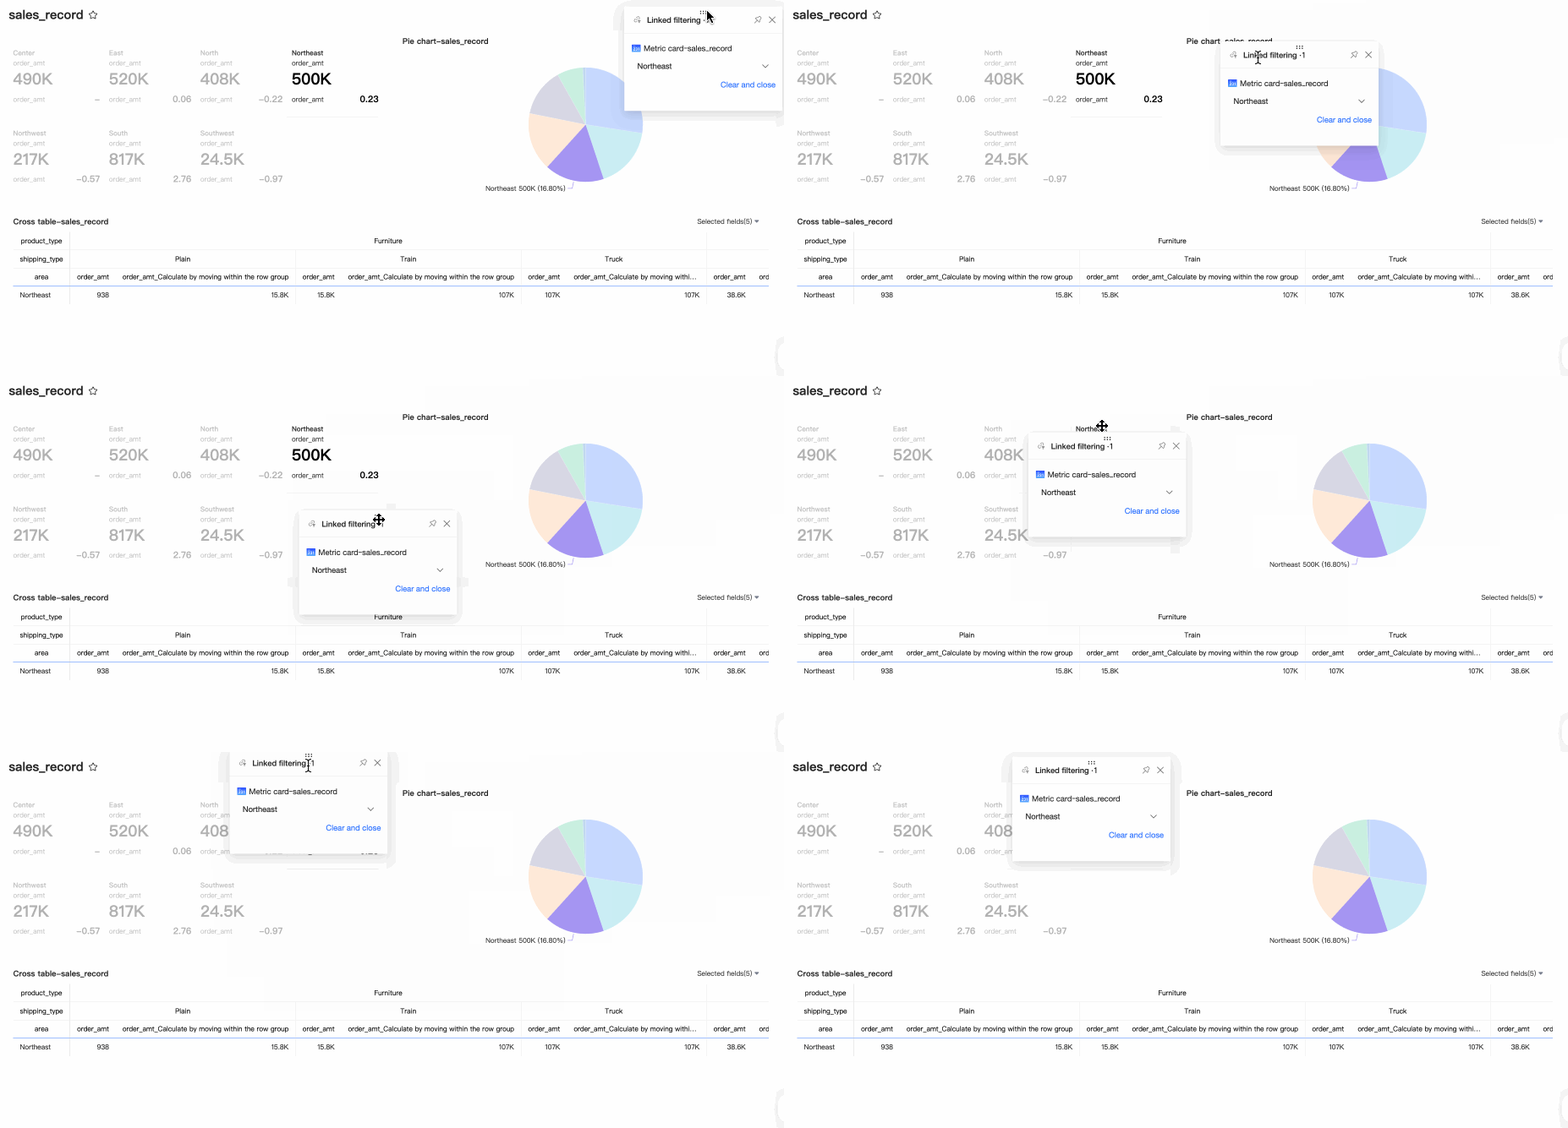
 icon in the upper-right corner of the floating linkage filter pane to pin it to the right side of the report. Click the
  icon to Unpin it and restore its floating state.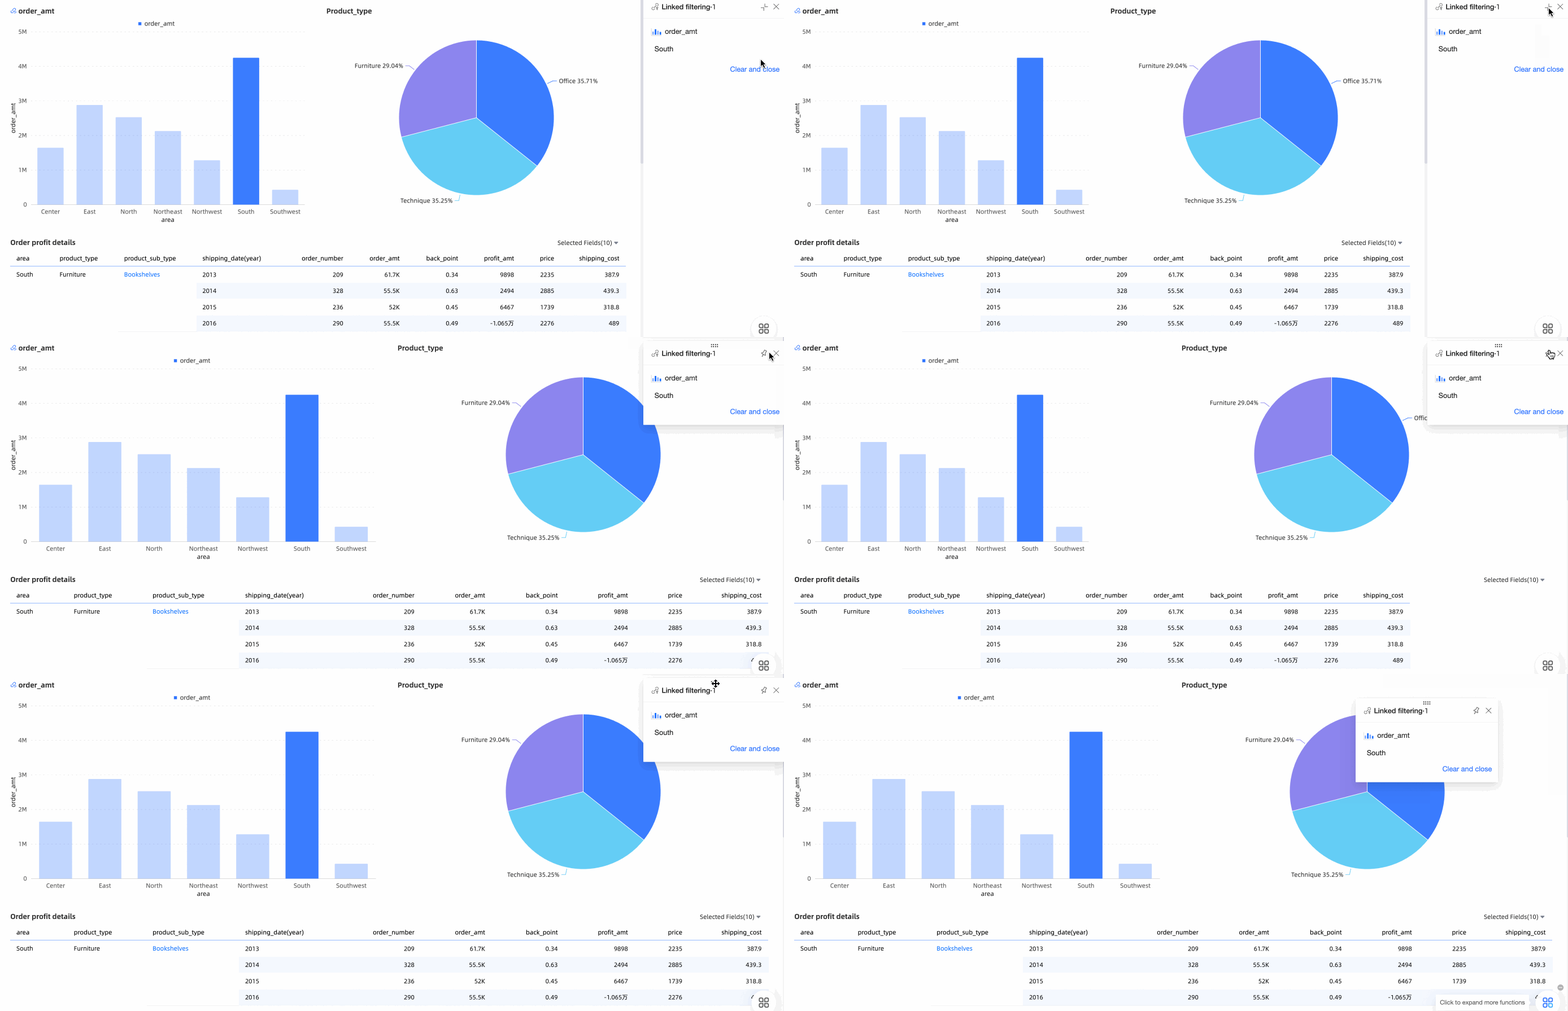
Set up synchronous drill-down
When a dimension field that initiates linkage is also configured for drill-down, setting the linkage initiation method to Apply Simultaneously allows both actions to occur at once. However, linked charts do not follow the source chart's drill-down and remain at their original analysis level.
To make linked charts drill down along with the source chart, use the synchronous drill-down feature. When you drill down in one chart, linked charts that share the same dimension field automatically update to the corresponding analysis level. The following table compares the two behaviors.
|
Apply simultaneously |
Synchronous drill-down |
|
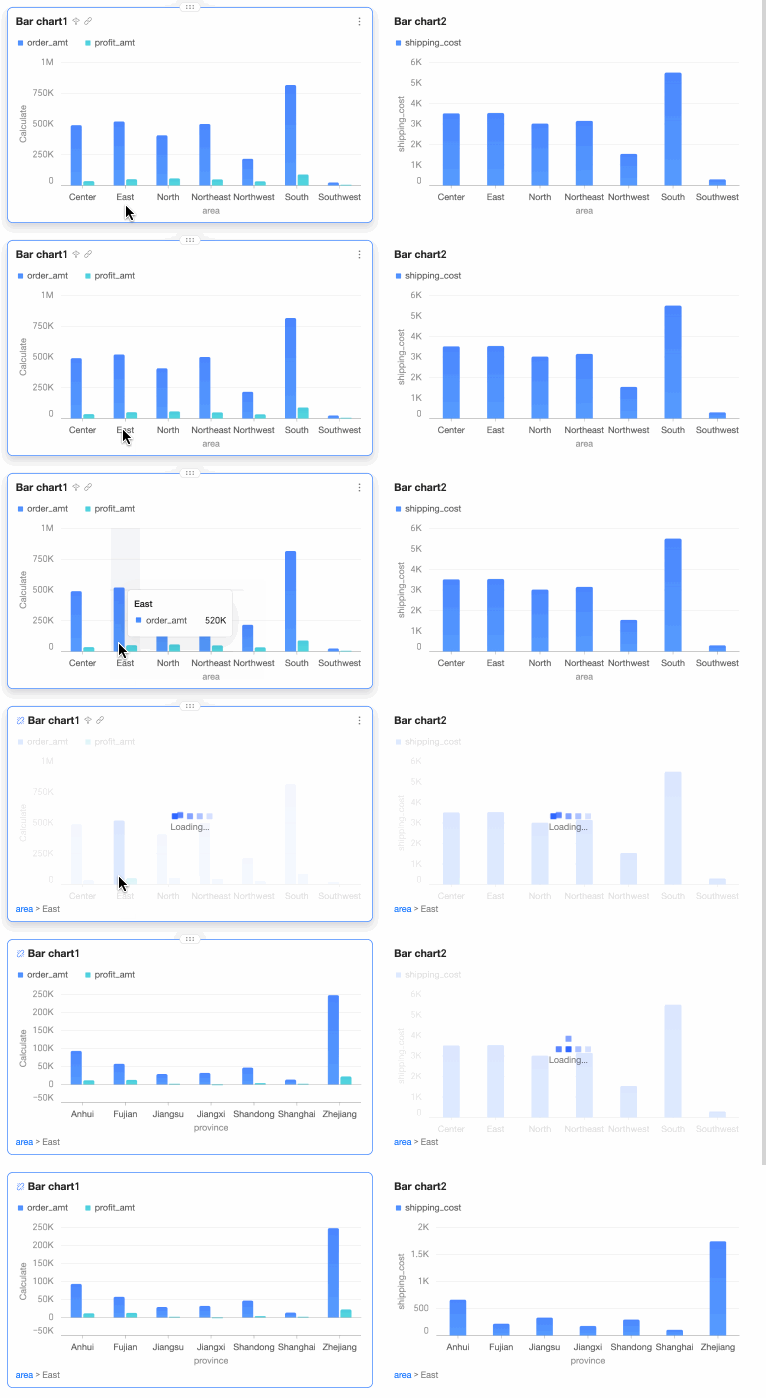
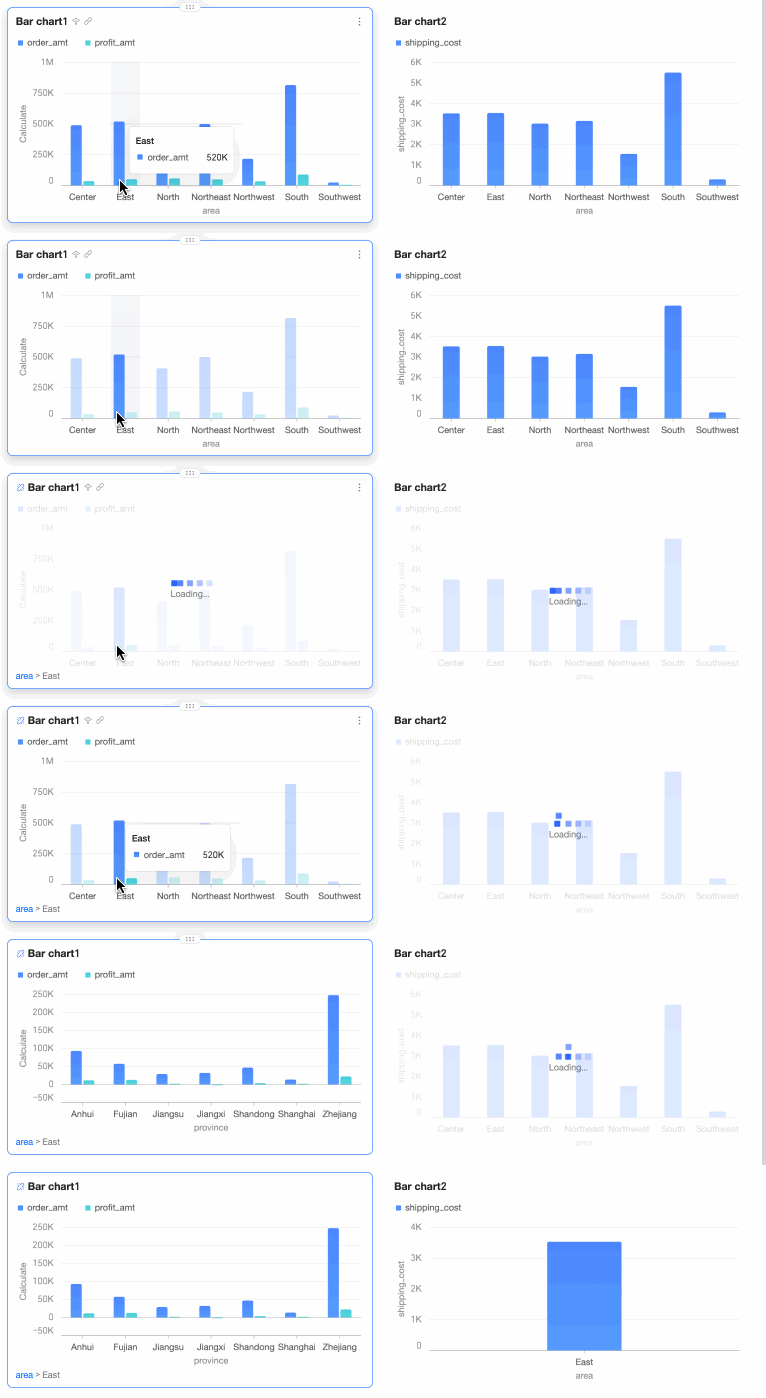
The data in the linked chart remains at the original analysis level. After you click the Northeast region in the source chart, the source chart drills down to the province level for that region. However, the linked chart remains at the Region level and cannot synchronously drill down to show the shipping costs for each province in the Northeast region.
|
The data in the linked chart follows the level of the source chart. After you click the Northeast region in the source chart, the source chart drills down to the province level for that region. The linked chart also synchronously drills down to the province level, showing the shipping costs for each province in the Northeast region.
|

Prerequisites
Ensure that your chart settings meet the following conditions. Otherwise, the linked chart is only filtered or highlighted and does not drill down.
-
Dataset configuration: The linked chart must use the same dataset as the source chart.
-
Field configuration: The linked chart must be configured with the same initial drill-down level field as the source chart (for example, both are configured with the Region field as the initial level), and this dimension field must support the drill-down function. Drill-down is not supported in the following cases:
-
Grouped dimensions and dimension groups do not support drill-down.
-
In a crosstab, drill-down is not supported when the drill-down field is hidden.
-
-
Chart limitations
-
The linked chart must support the drill-down function. For example, indicator trend charts do not support drill-down. For a list of charts that support drill-down, see Drill-down > Limitations.
-
The linked chart must be able to accept the dimension field type passed from the source chart. For example, a map chart requires a geographic dimension field.
-
If a crosstab is configured with an auxiliary field and triggers a synchronous drill-down, the synchronously drilled-down chart will not carry over the auxiliary field, only the basic drill-down field.
-
-
Linkage initiation method configuration: The synchronous drill-down function is only supported when the chart's linkage initiation method is set to Apply Simultaneously. If it is set to Select Linkage or Drill-down in pop-up, synchronous drill-down is not supported.
Procedure
The following example configures synchronous drill-down between the source chart Regional Order Sales and the linked chart Regional Shipping Costs. When you drill down on the Northeast region in the source chart, the linked chart also drills down to show data for the provinces in the Northeast region.
-
Add two blank column charts to the dashboard edit page and configure their data fields.
The linked chart must use the same dataset and be configured with the same initial drill-down field as the source chart. Therefore, both charts use the sales dataset and are configured with the Region field.
-
Configure drill-down for the Region field in both charts.
Click the
icon next to the Region field, select Apply Simultaneously in the pop-up window, and click OK.Note-
The synchronous drill-down feature requires the Apply Simultaneously setting. Therefore, you must select this option. Otherwise, the linked chart will only be filtered or highlighted, but will not drill down.
-
For more information about configuring drill-down, see Drill-down.
-
-
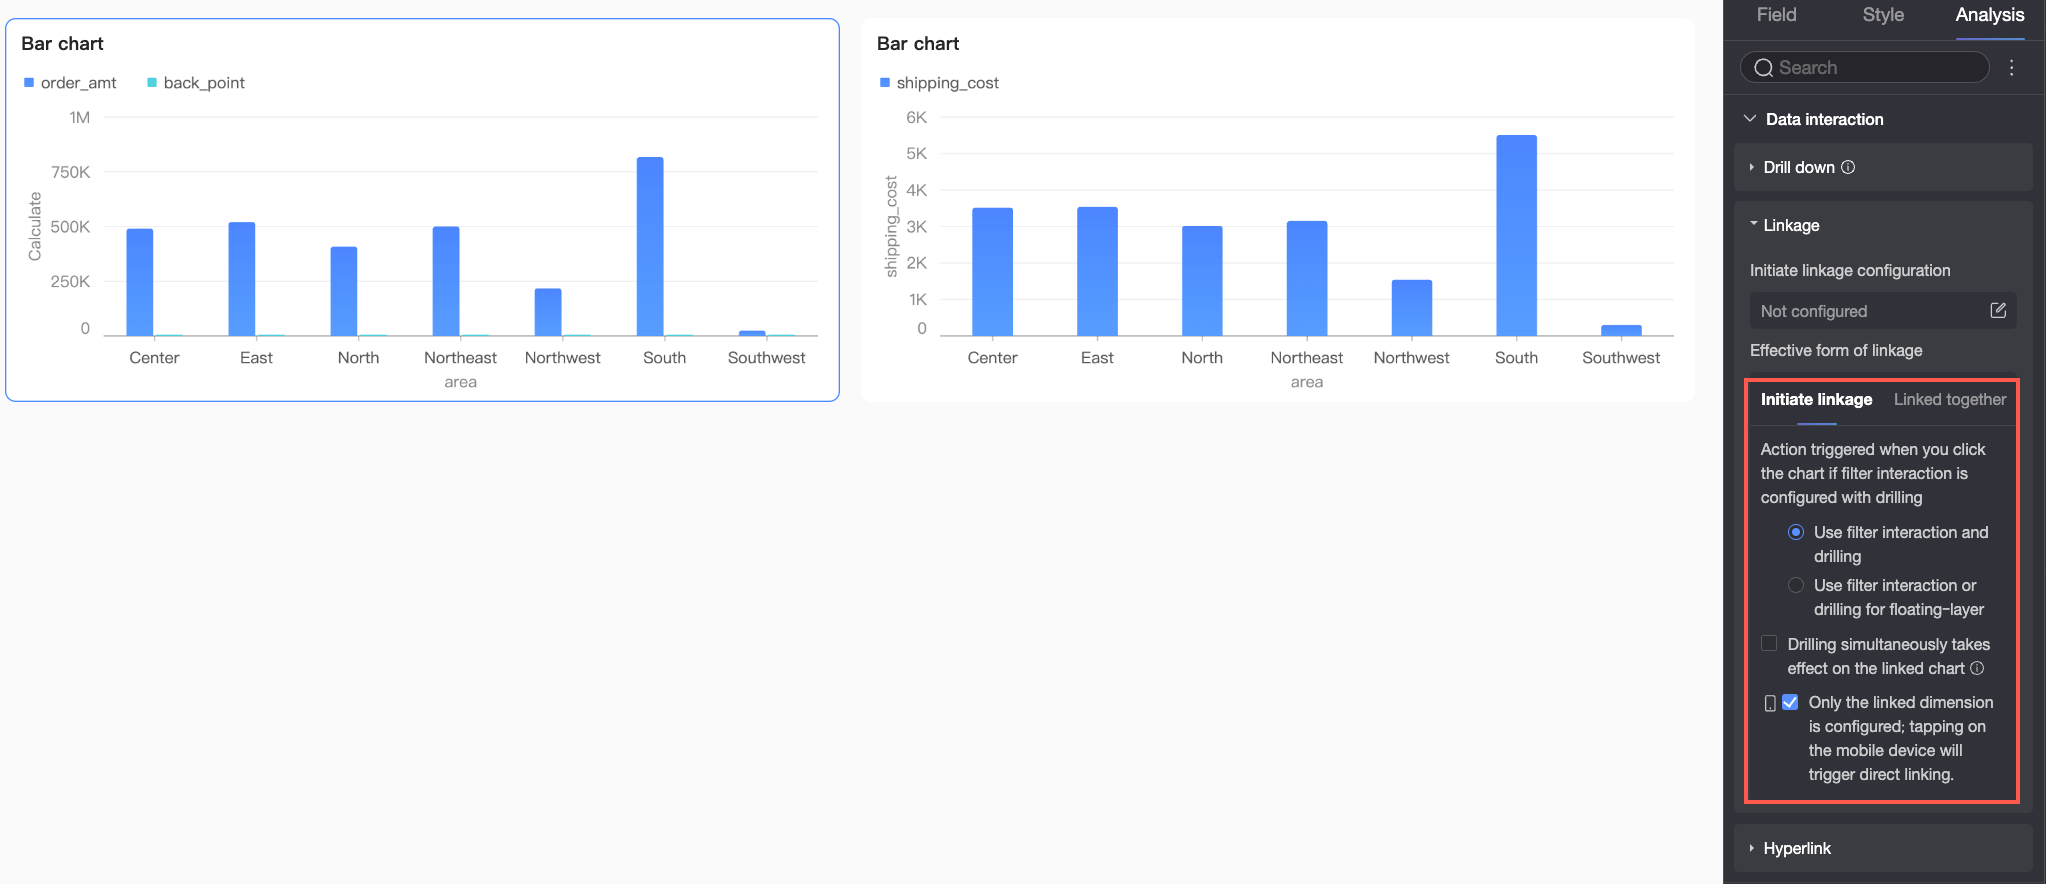
In the Analysis panel of the source chart, go to Data Interaction > Linkage to configure the linkage activation mode.
With the linkage initiation method set to Apply Simultaneously, select the Apply to linked charts during drill-down checkbox to enable the synchronous drill-down feature.
NoteWhen a chart is in synchronous drill-down mode, the Clear option under the chart's "When the chart is linked, the chart already has a drill-down level" setting has no effect. The behavior defaults to Keep for charts in a synchronous drill-down group.
-
Once configured, selecting the Northeast region in the source chart causes both it and the linked chart to synchronously drill down to the province dimension for the Northeast region.

 icon next to the Region field, select Apply Simultaneously in the pop-up window, and click OK.