Data lineage
This topic describes how to view details about a report, including its workspace, name, type, and the datasets, data tables, and data sources it uses.
Background
The data lineage feature is available only in the Advanced and Professional editions.
Only workspace administrators, organization administrators, and users with custom roles that include intelligent O&M permissions can use the data lineage feature.
Organization-level data lineage supports both graph and list views, while workspace-level data lineage supports only the graph view.
Data lineage analyzes only published resources.
Organization-level data lineage
Graph view
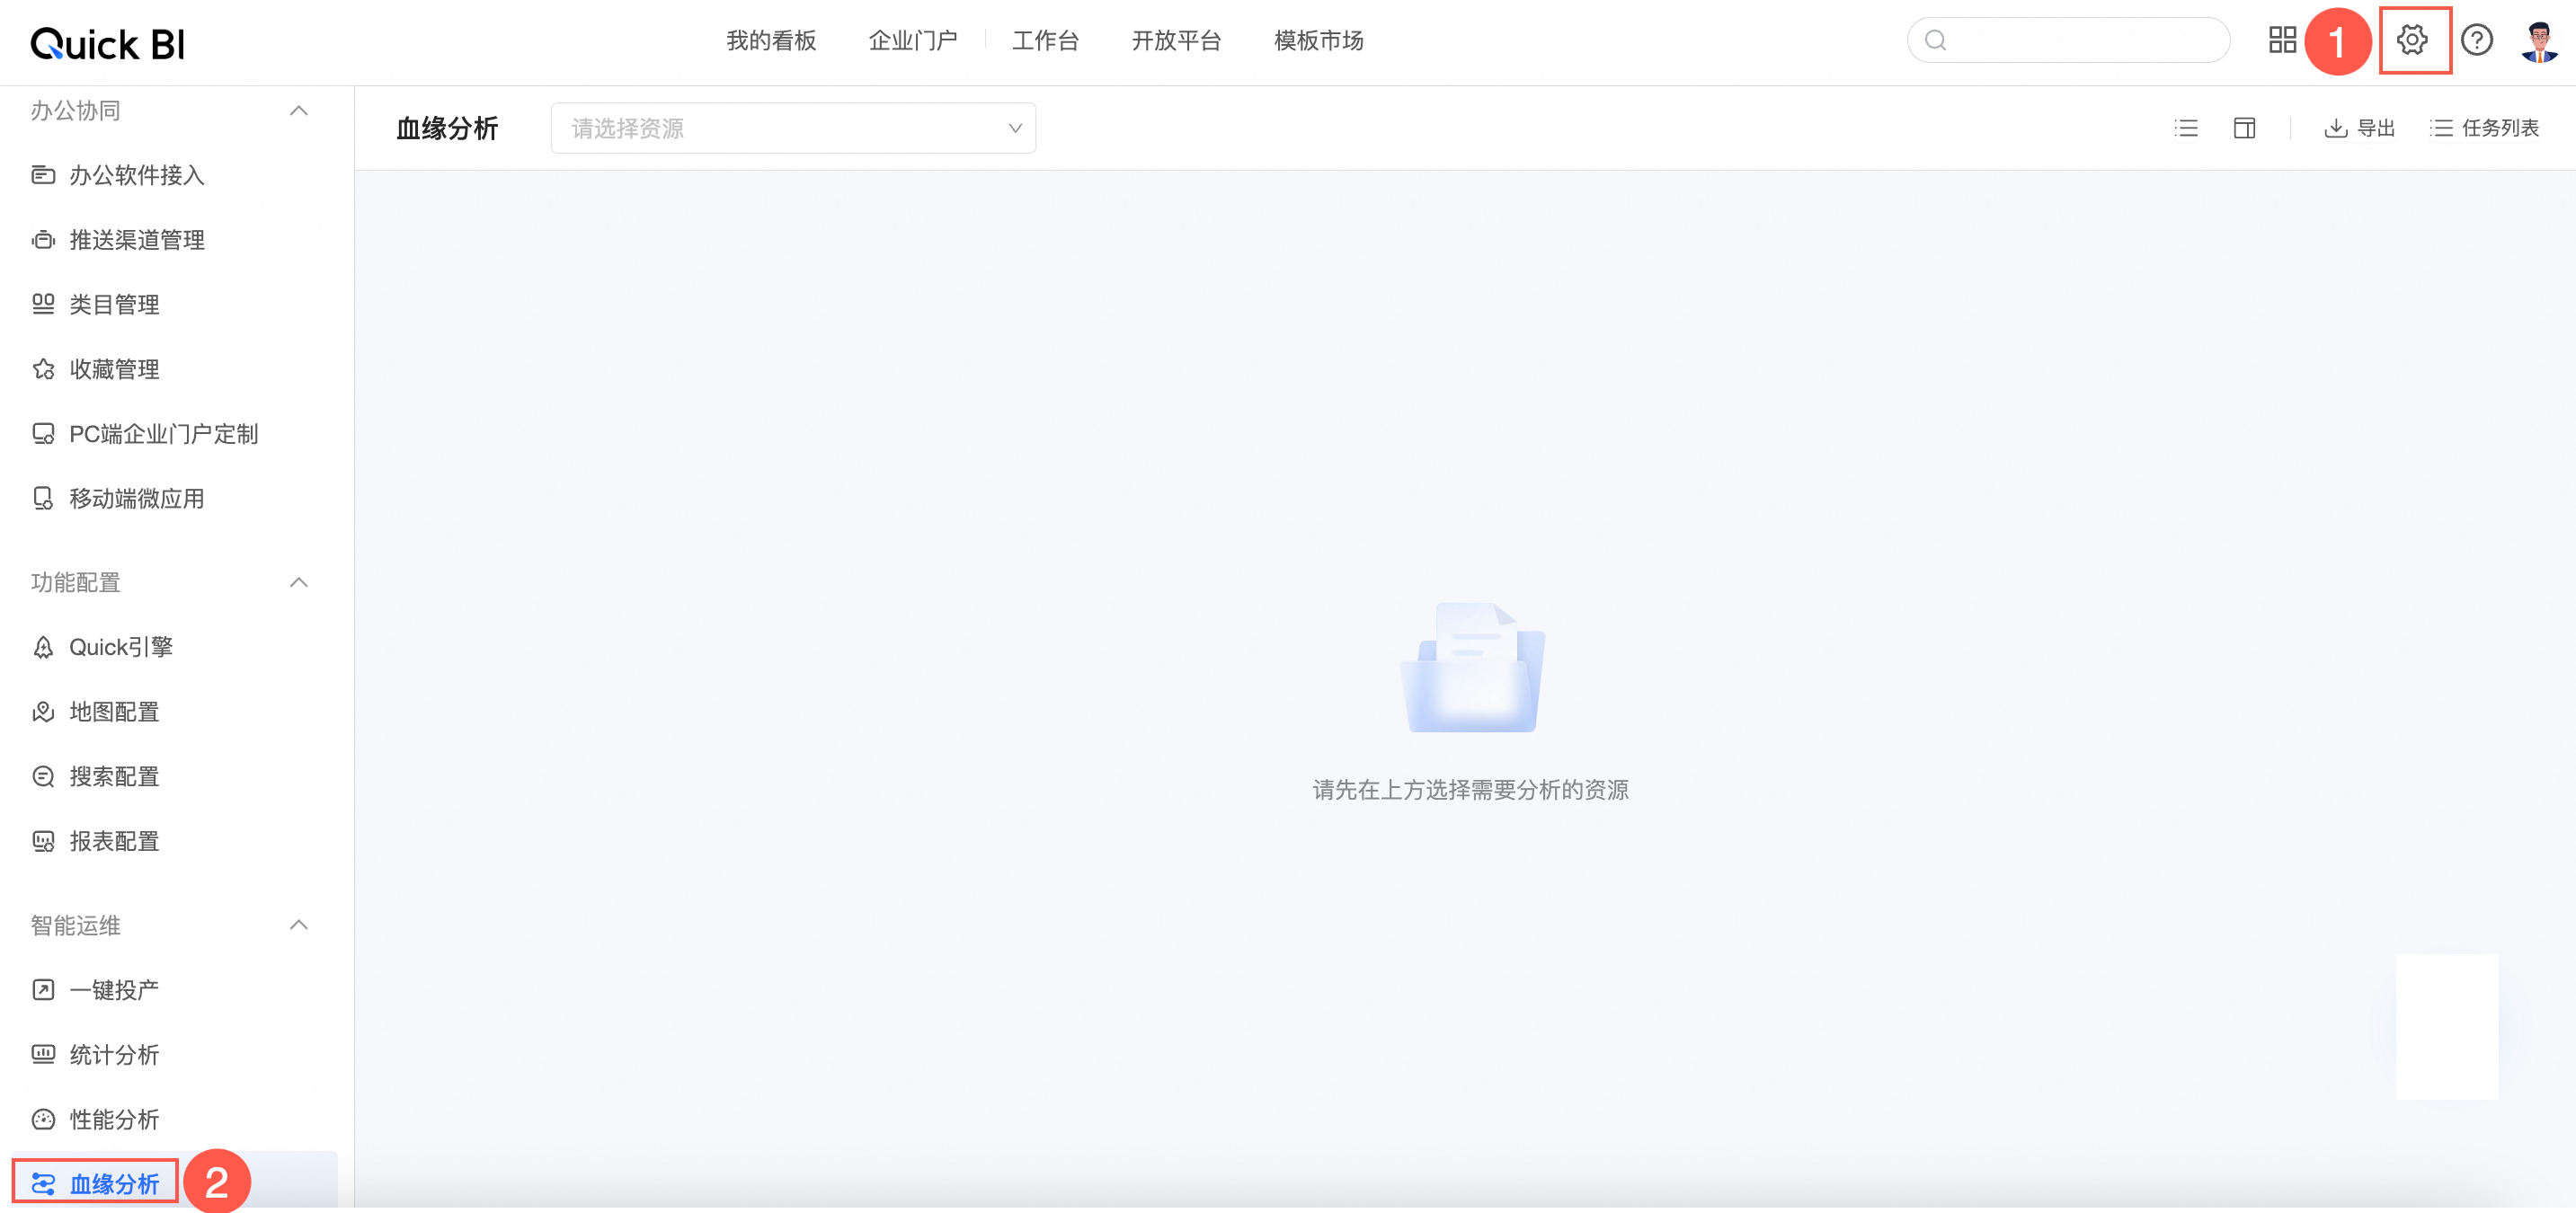
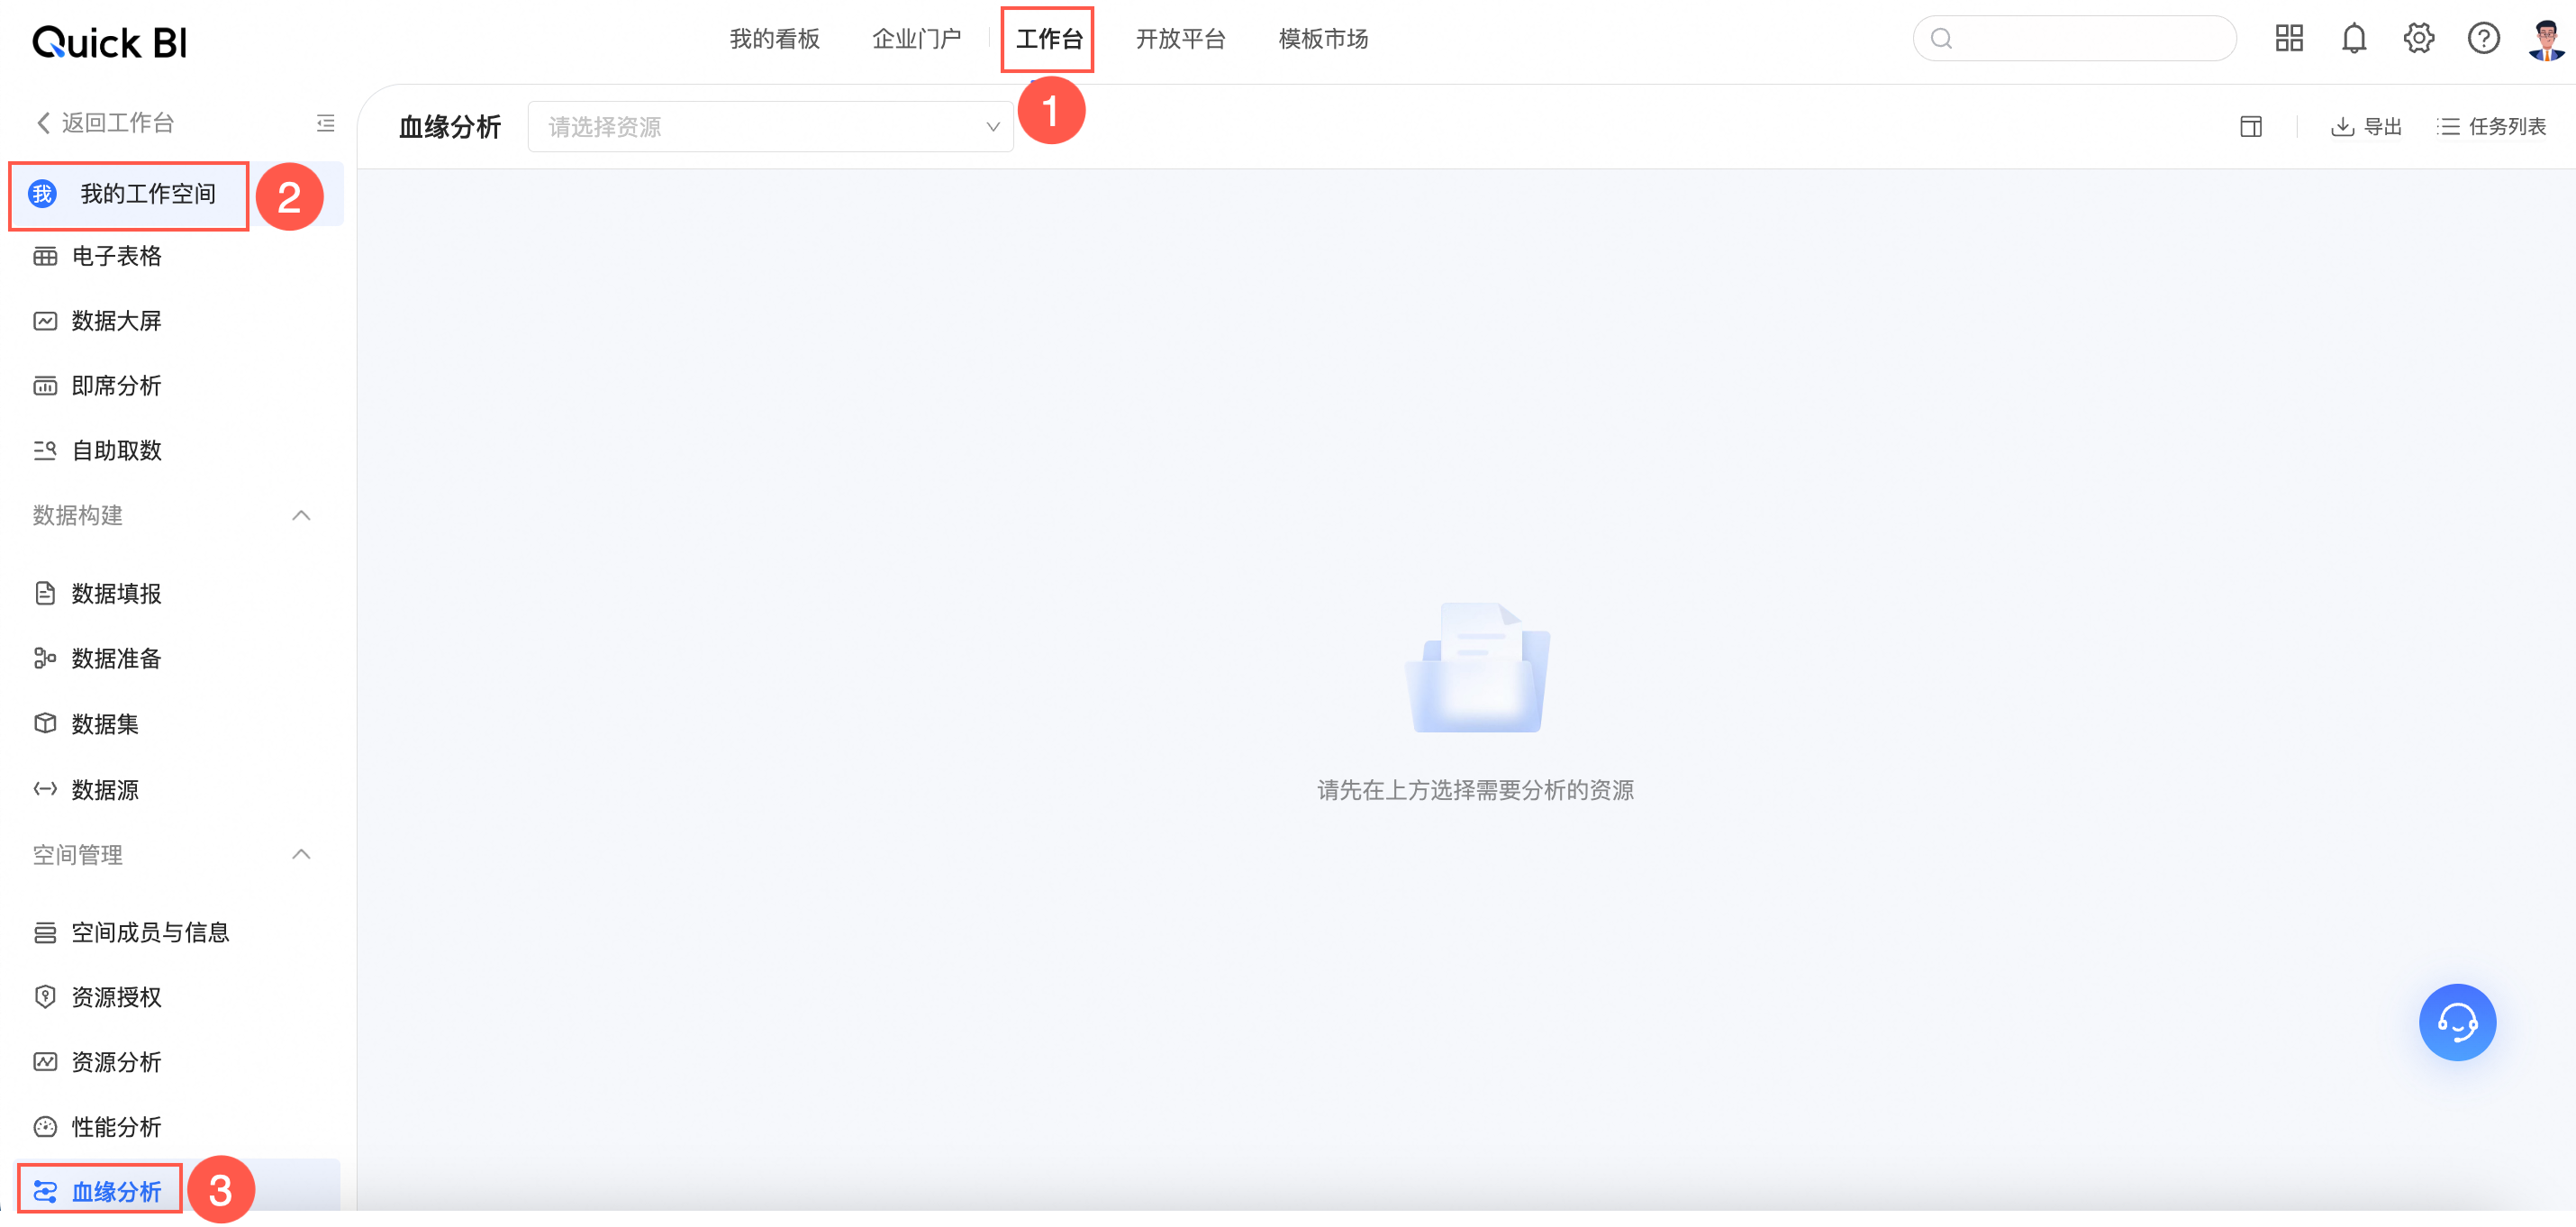
To go to the organization-level data lineage page, follow the steps in the figure.
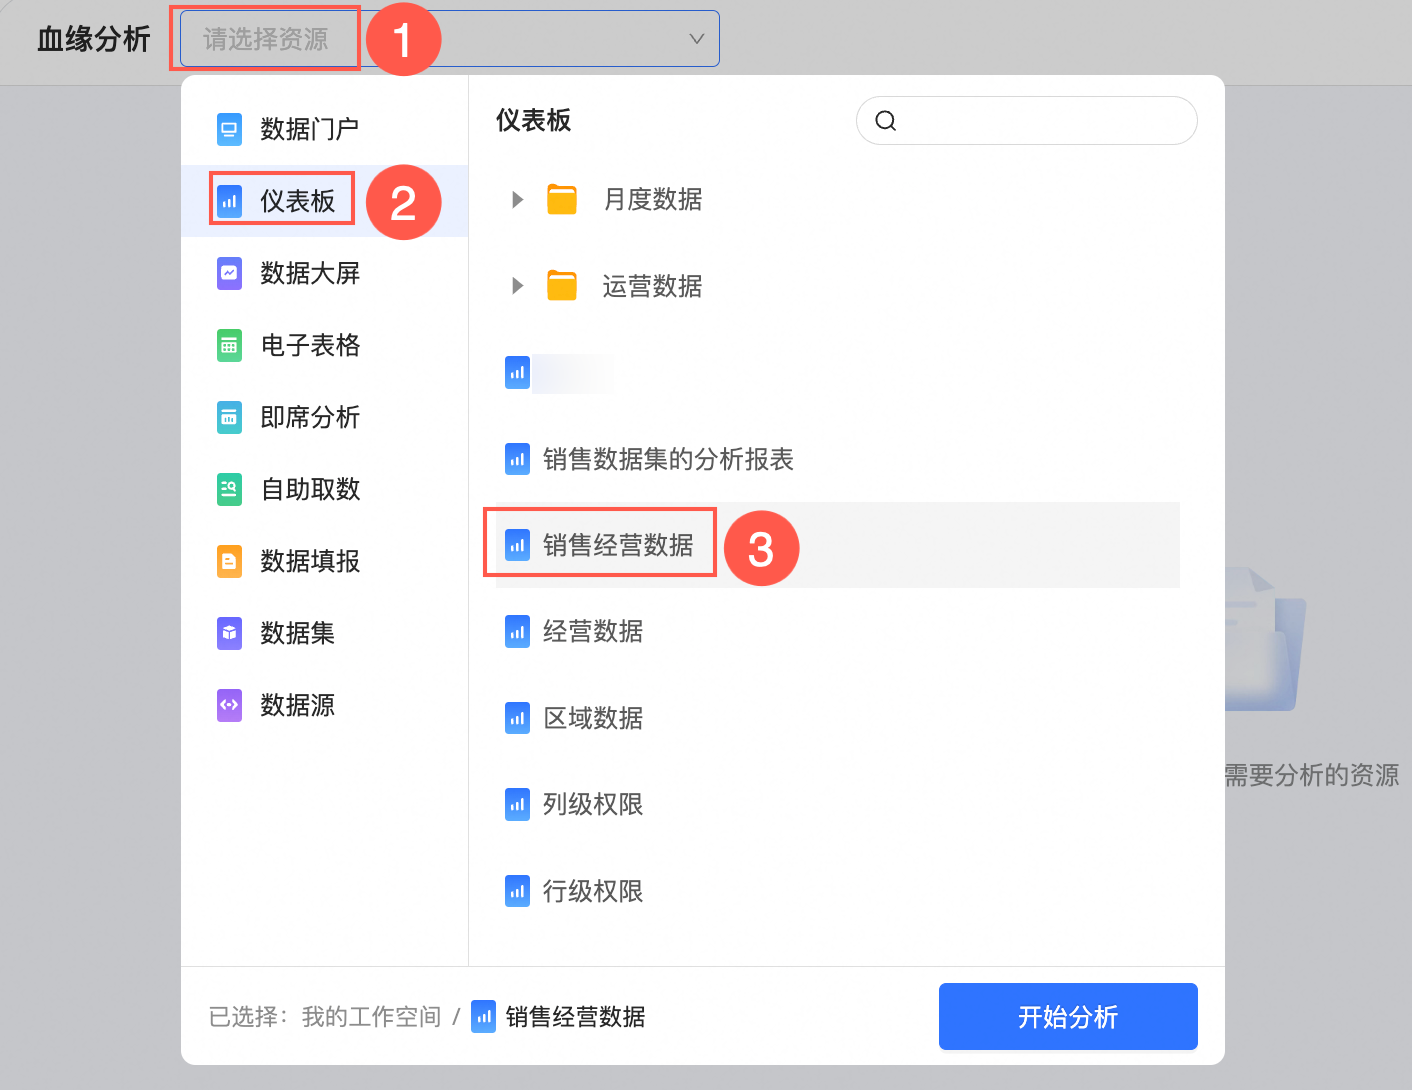
Select an analysis object.
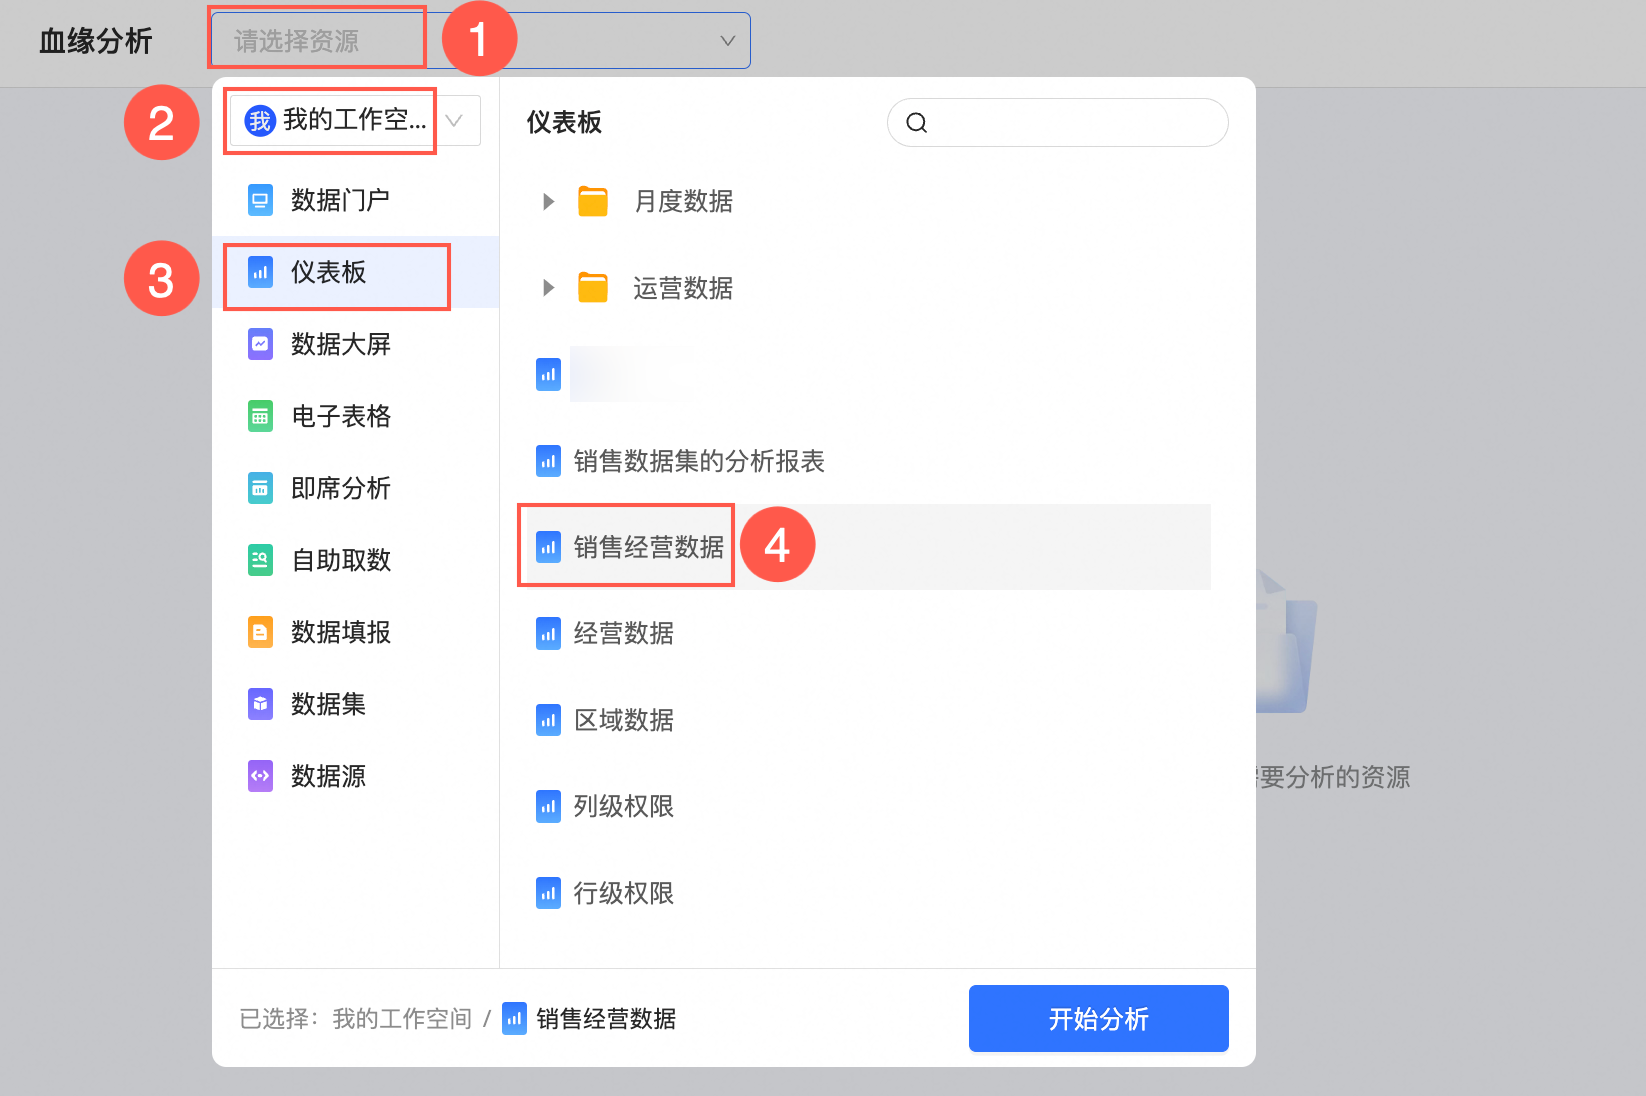
Start the analysis.
Click Start Analysis to open the data lineage page for the selected analysis object.
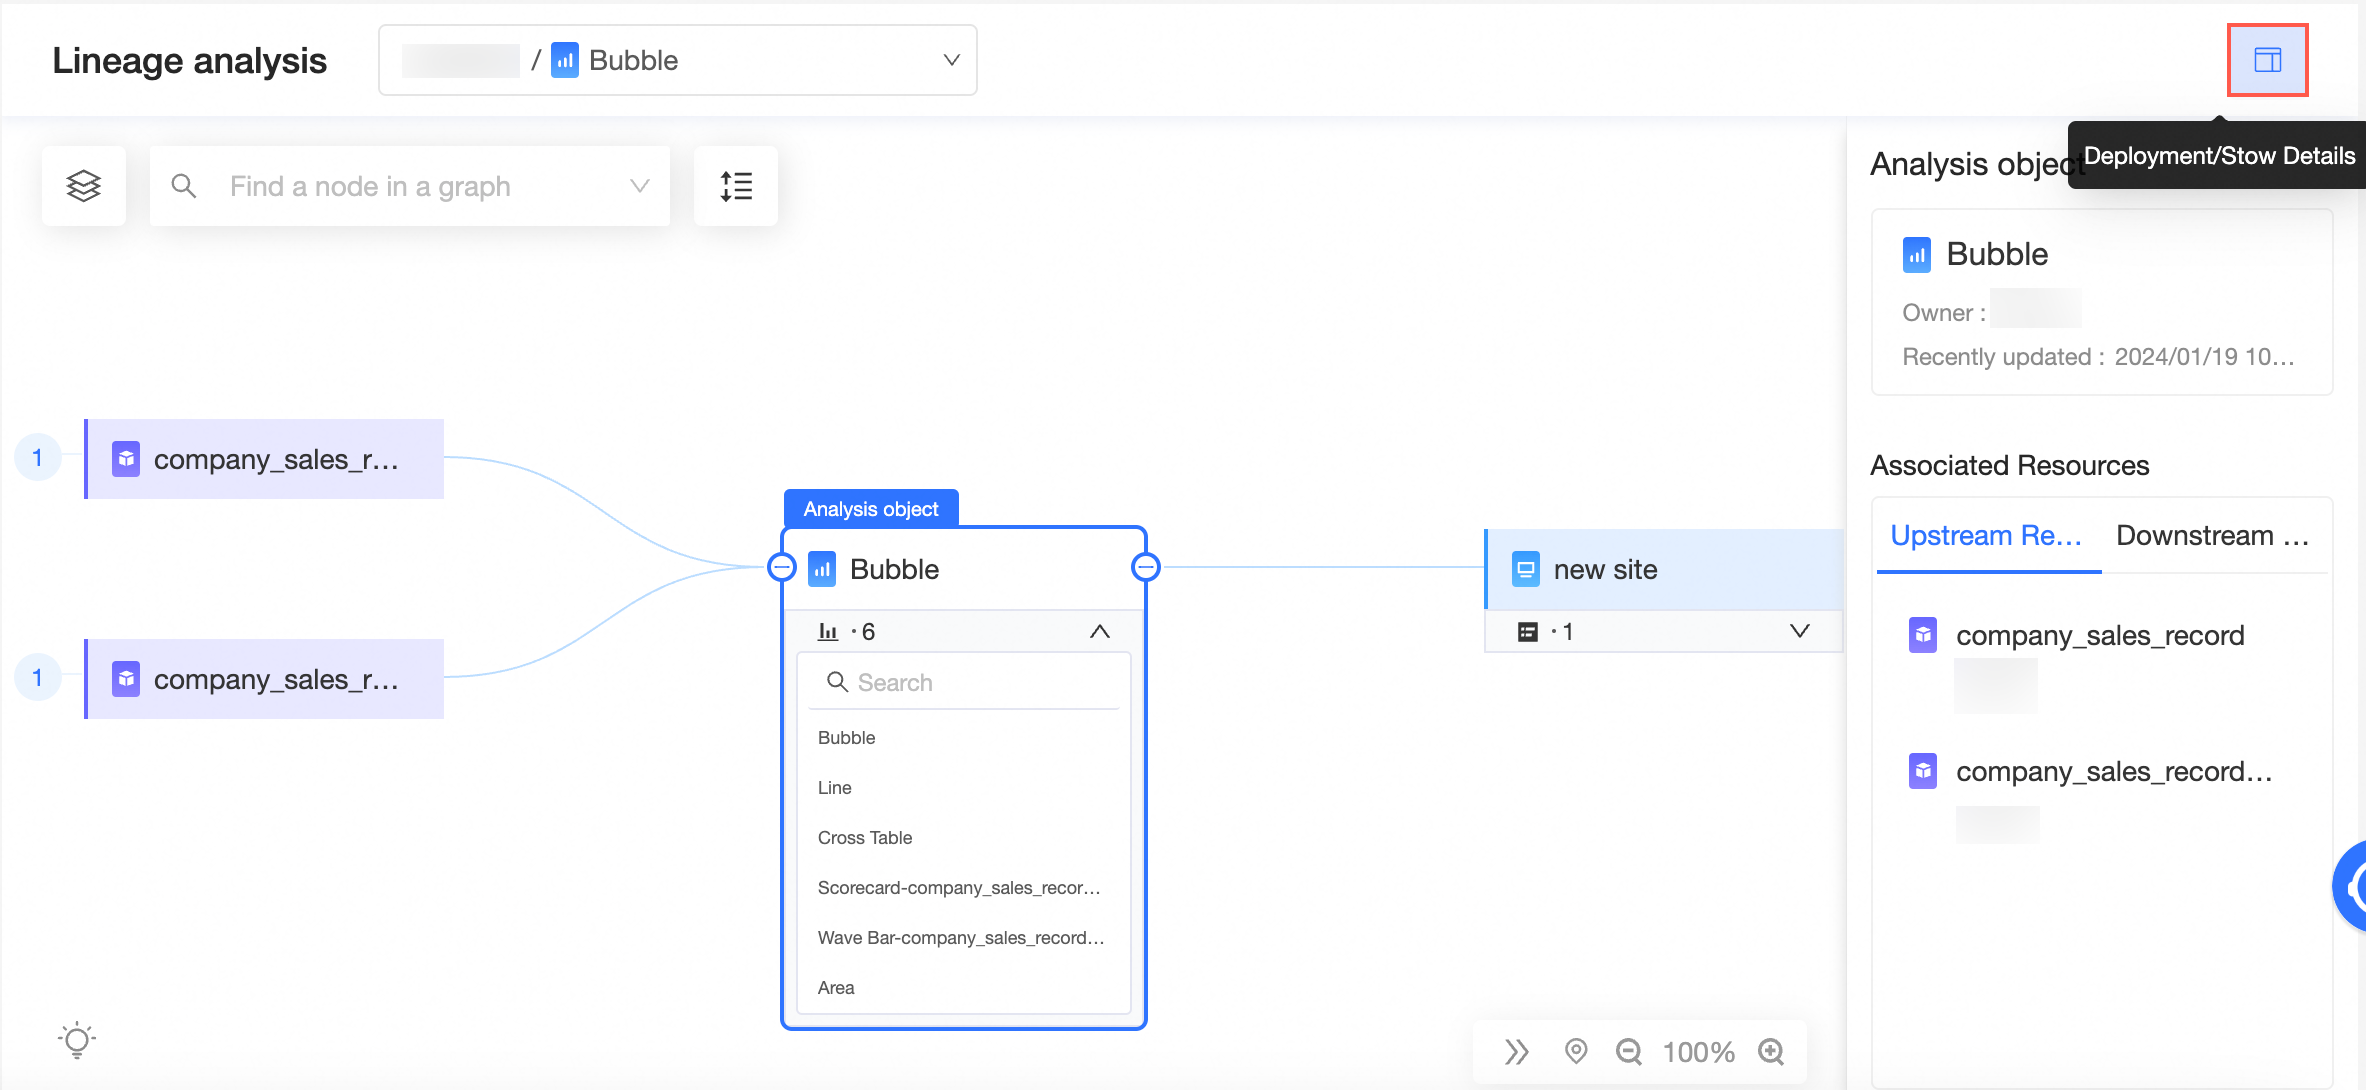
You can view the owner and access information for the analysis object, as well as its related upstream and downstream resources. Click a resource to analyze it. The analysis can trace lineage down to the component level for dashboards and the block level for spreadsheets.
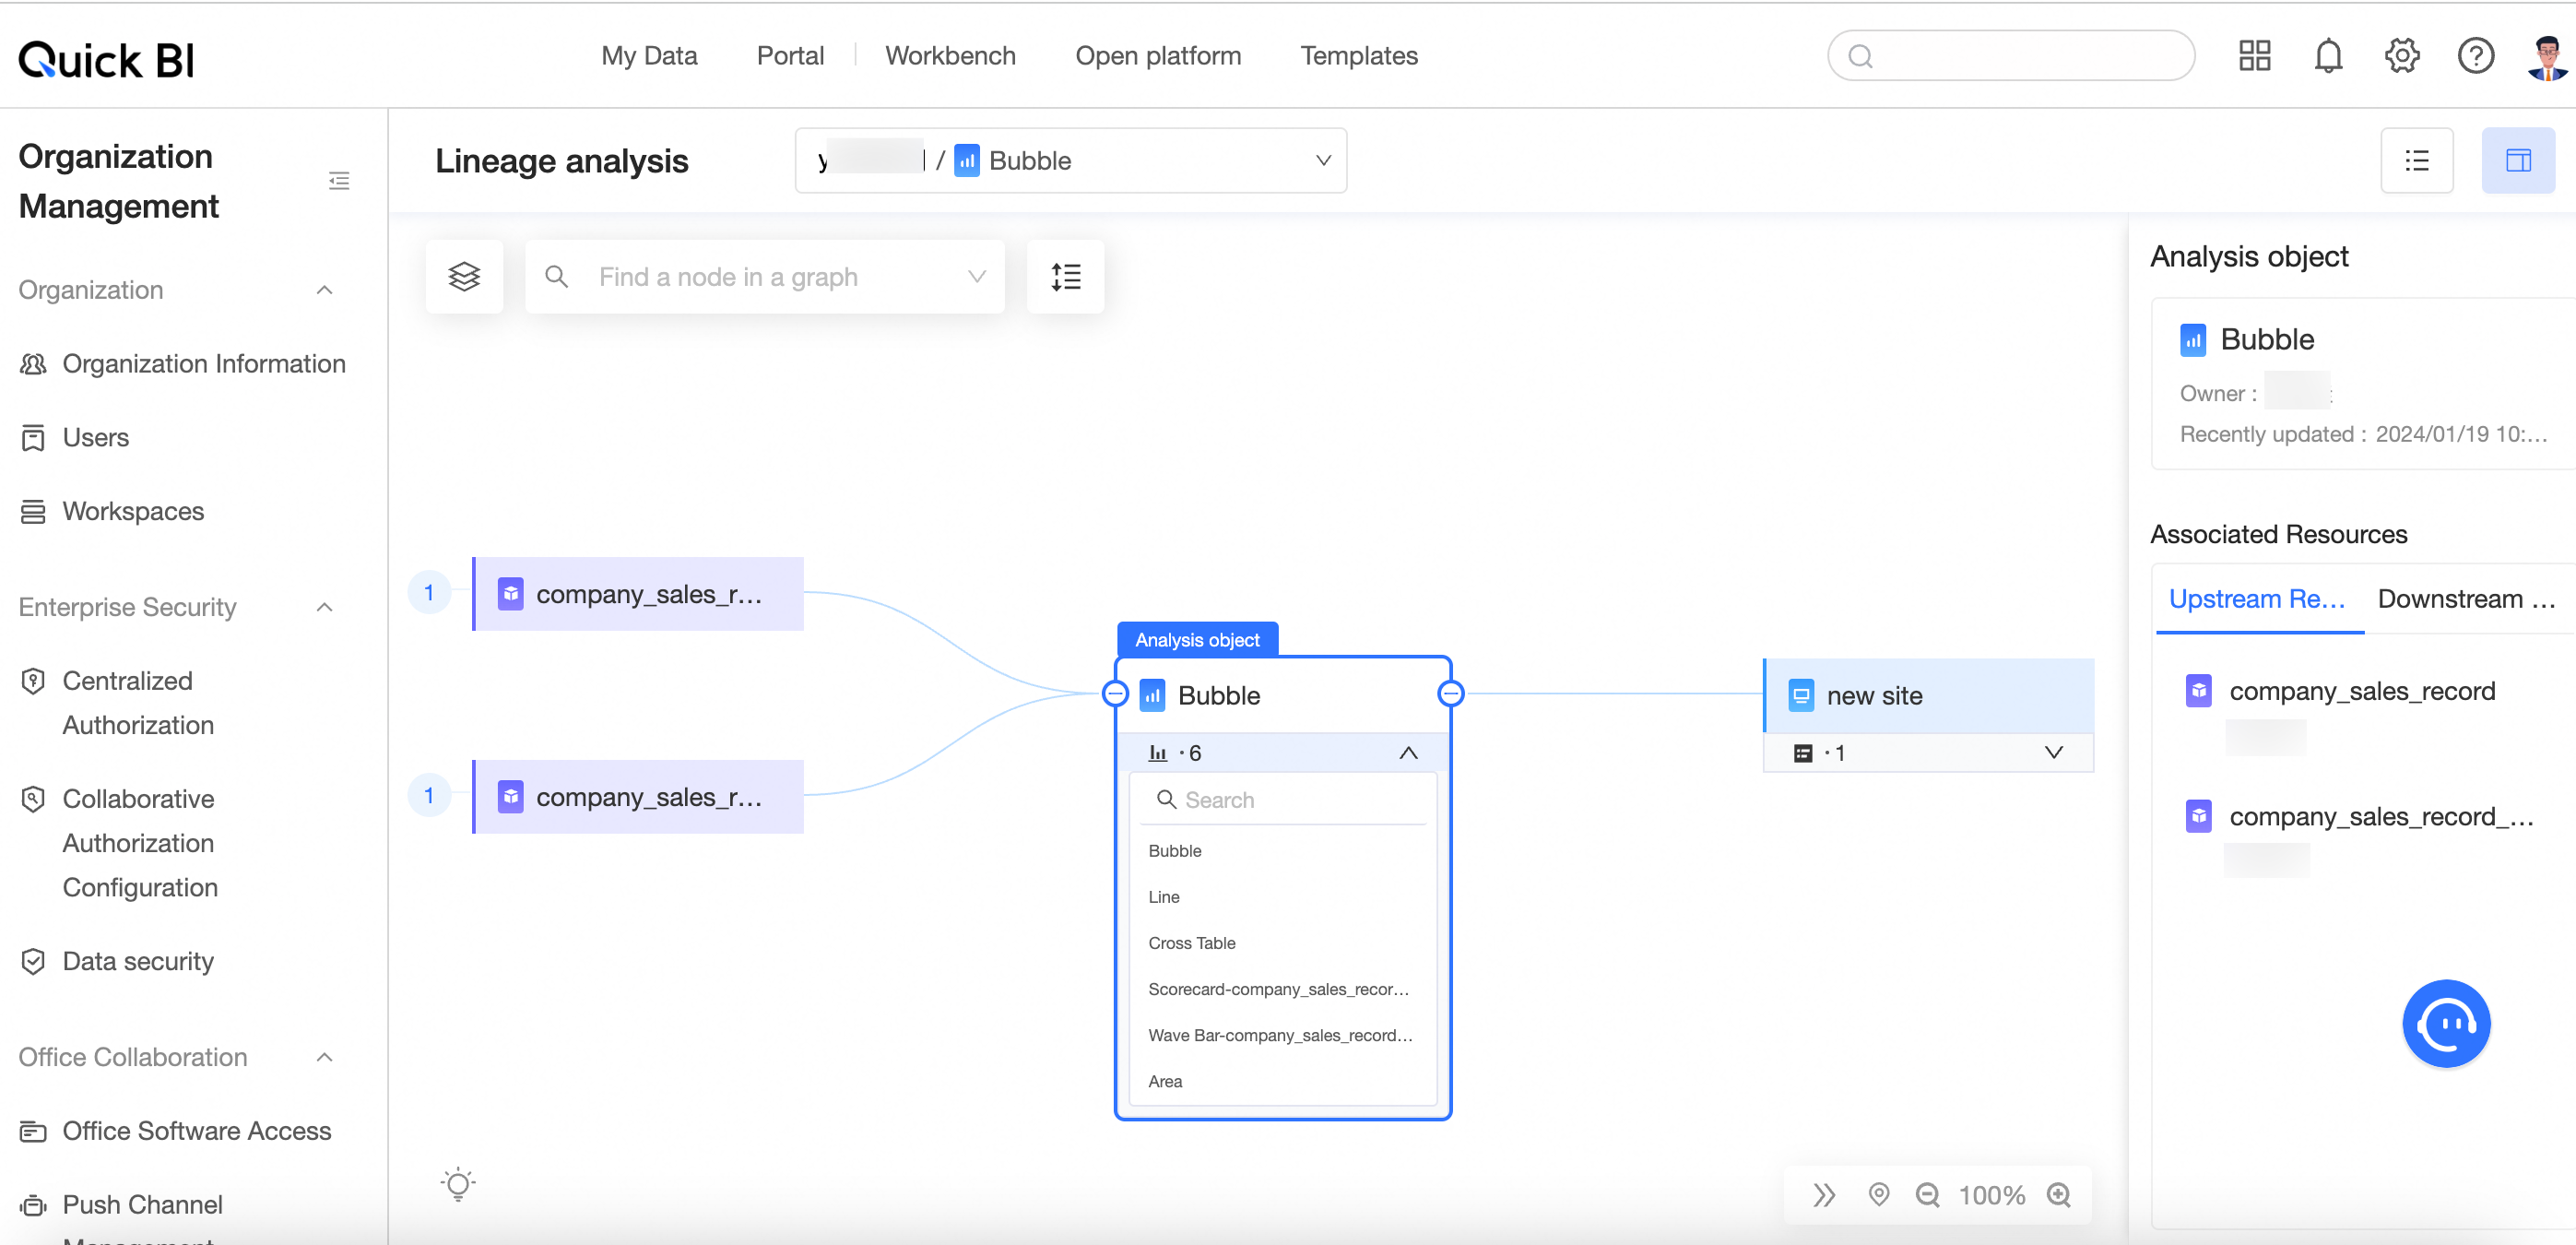
You can double-click a resource to switch the analysis object.
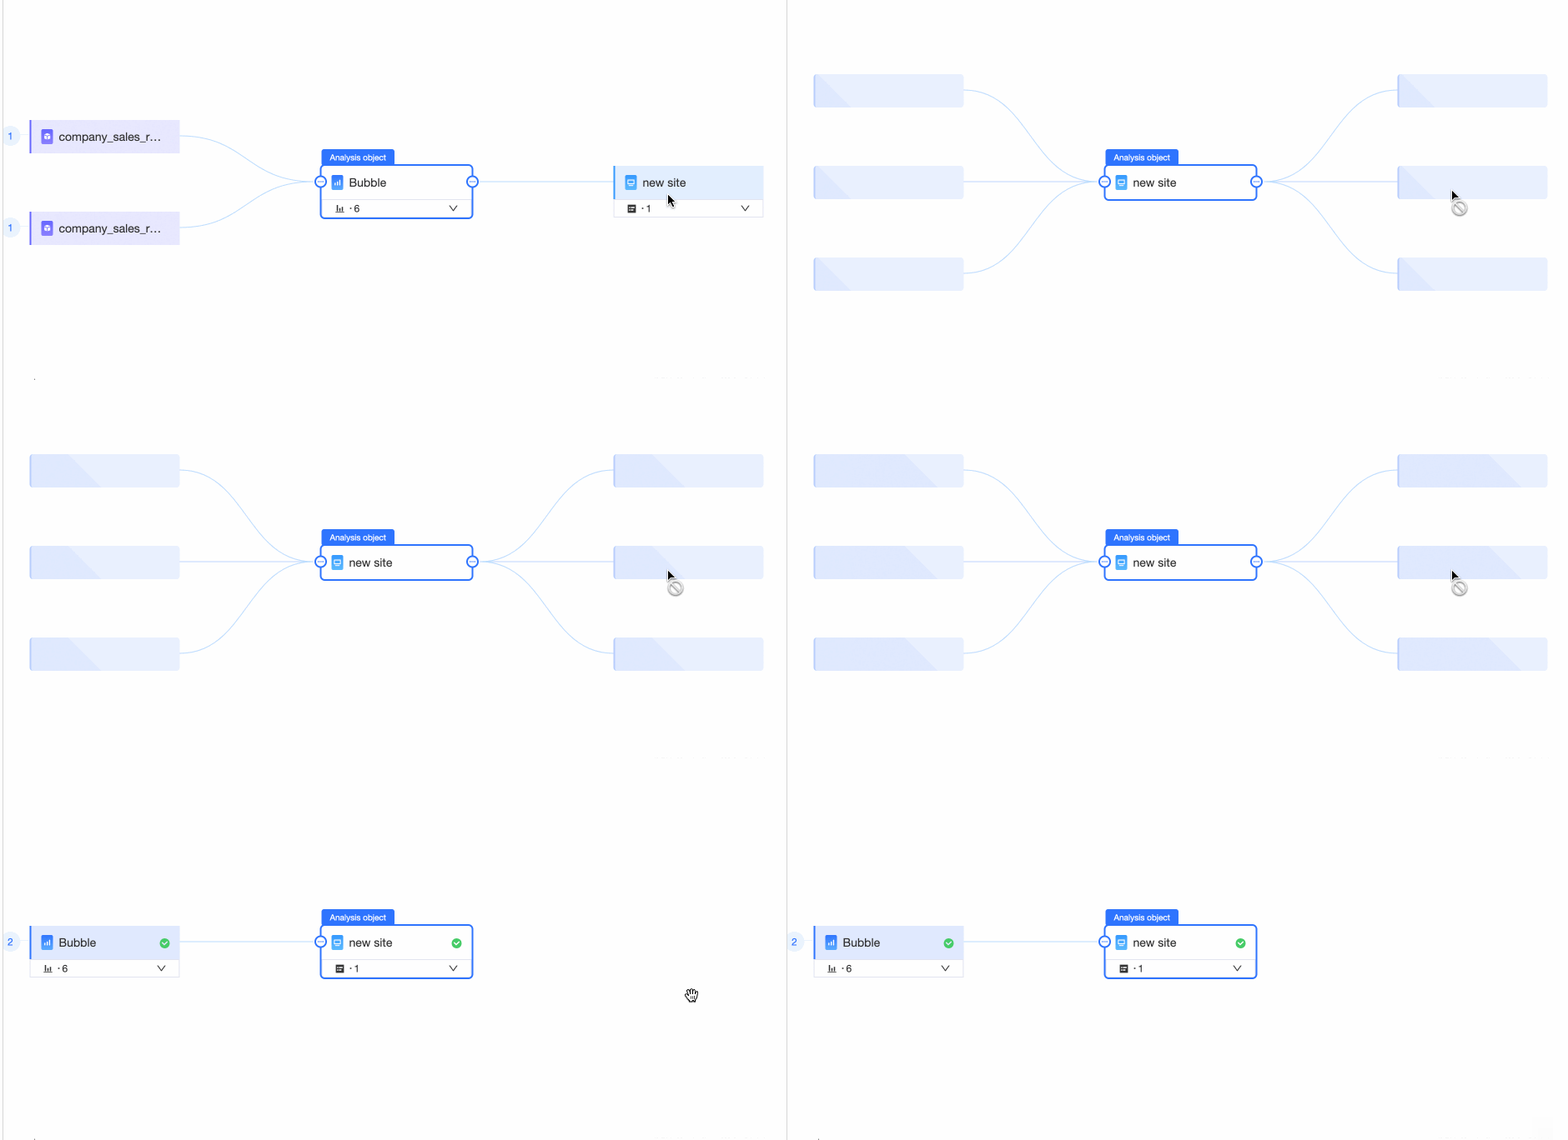
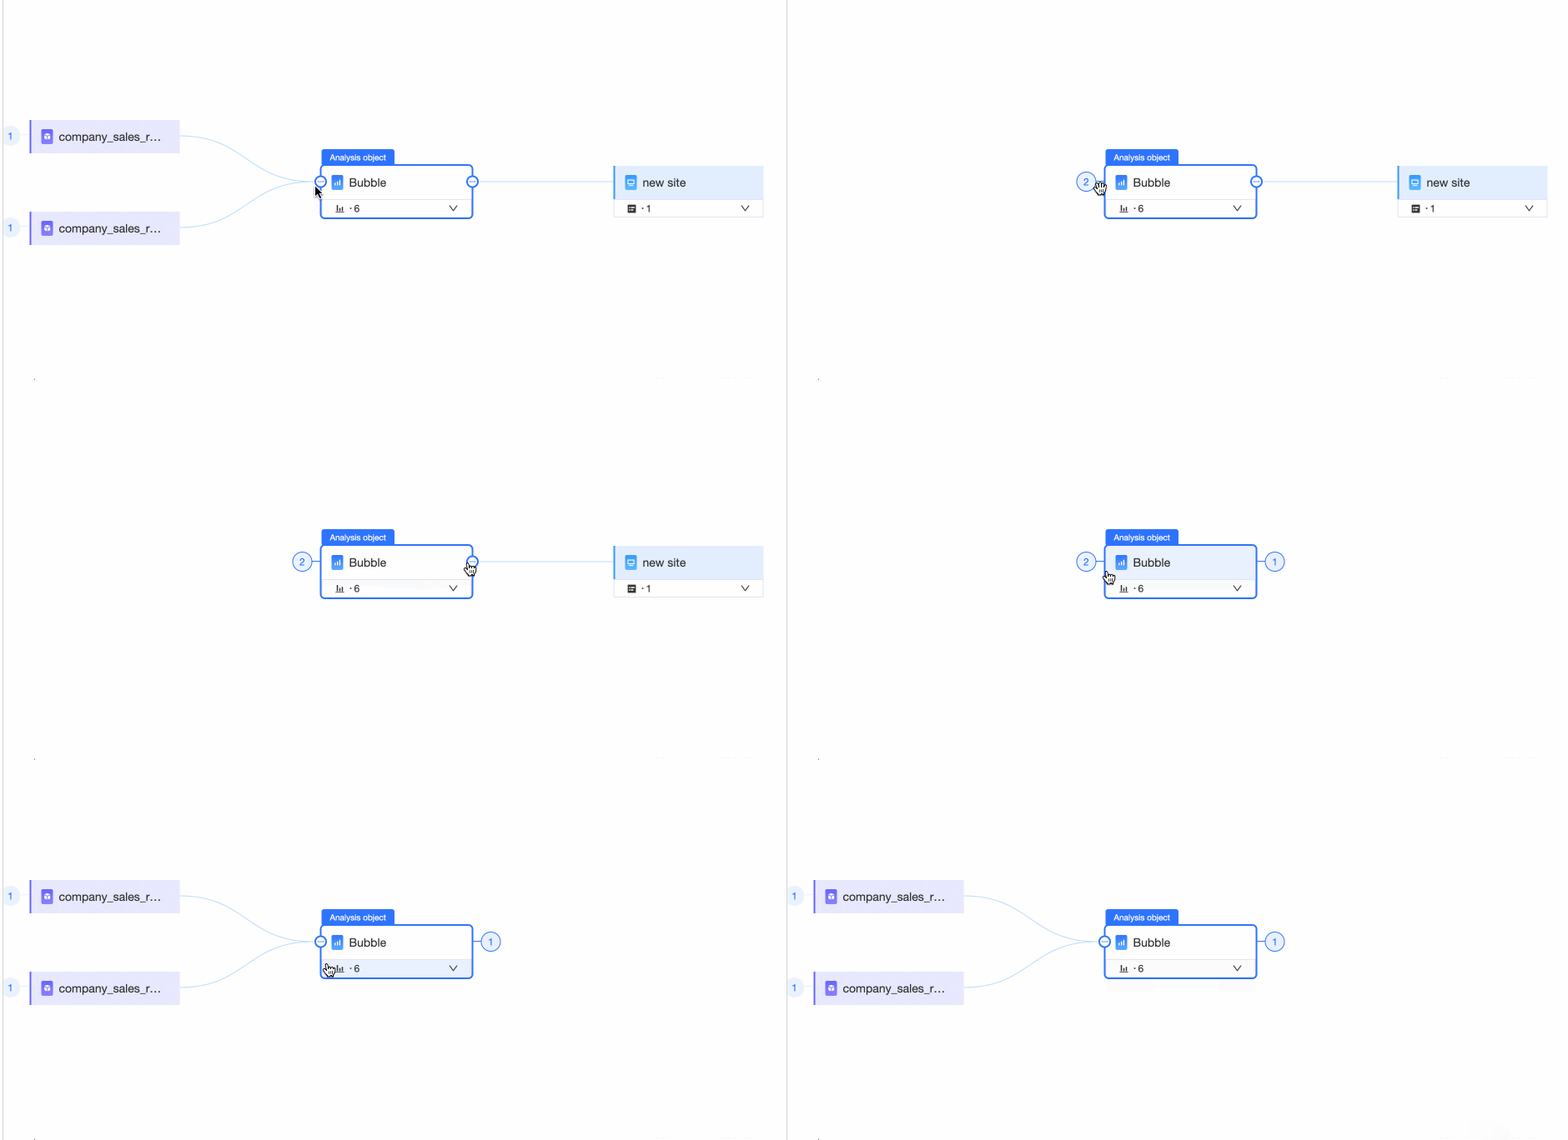
You can expand or collapse the upstream and downstream resources.
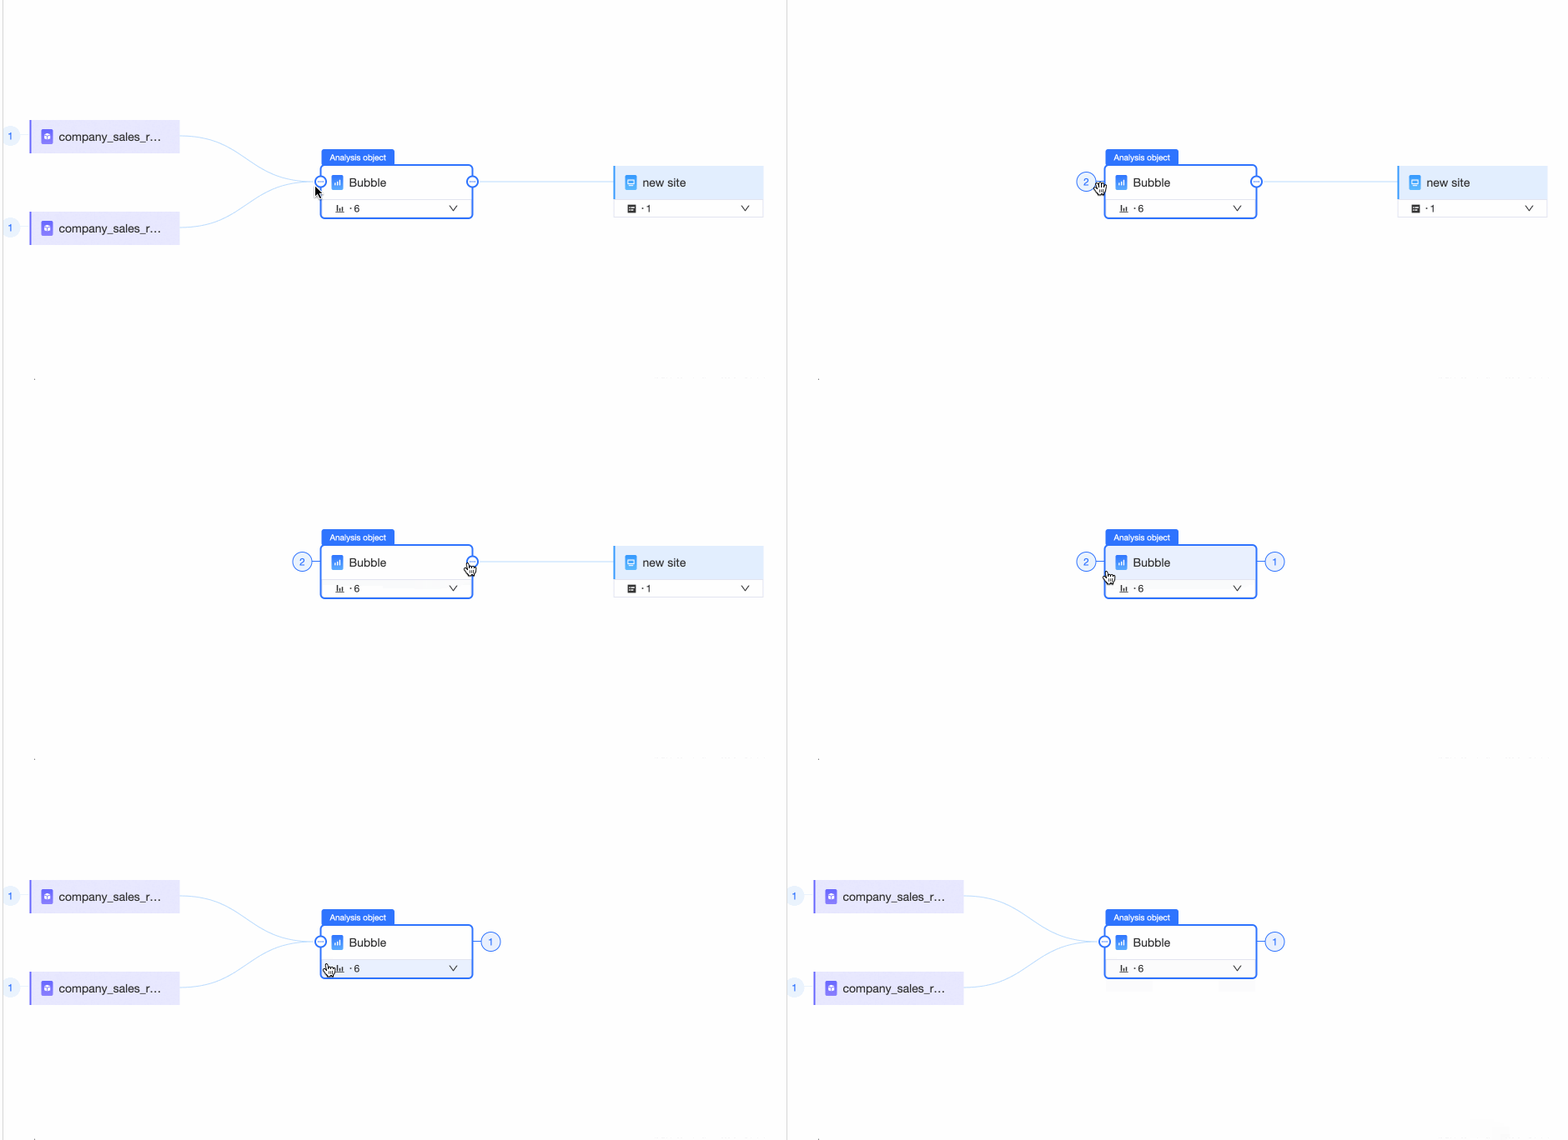
You can expand or collapse the details panel.

You can display the legend based on resource type and status.
You can search for nodes in the graph by keyword.
You can set the sort order.
By default, resources are not sorted. You can sort them by upstream/downstream resources or by resource name.
You can export the data.
To export the data, follow the steps in the figure.
Clicking OK automatically redirects you to the task list page.
On the task list page, you can export the current task or any historical tasks.
Switch back to list view.
Switching to list view clears the current data lineage graph. For details on using the list view, see List view.
If the number of upstream and downstream nodes is high, use the list view for a clearer analysis.


List view
On the data lineage page, select the workspace, query type, and report type, enter the report name, and then click Query.
NoteThe query type can be report, dataset, or data source & data table. Report types include dashboard, spreadsheet, and ad-hoc analysis.
Click Export to save the query results as a local Excel file.

Workspace-level data lineage
Graph view
To go to the workspace-level data lineage page, follow the steps in the figure.
Select an analysis object.
Start the analysis.
Click Start Analysis to open the data lineage page for the selected analysis object.
You can view the owner and access information for the analysis object, as well as its related upstream and downstream resources. Click a resource to analyze it. The analysis can trace lineage down to the component level for dashboards and the block level for spreadsheets.
You can double-click a resource to switch the analysis object.
You can expand or collapse the upstream and downstream resources.
You can expand or collapse the details panel.
You can display the legend based on resource type and status.
You can search for nodes in the graph by keyword.
You can set the sort order.
By default, resources are not sorted. You can sort them by upstream/downstream resources or by resource name.
You can export the data.
To export the data, follow the steps in the figure.
Clicking OK automatically redirects you to the task list page.
On the task list page, you can export the current task or any historical tasks.



Use cases
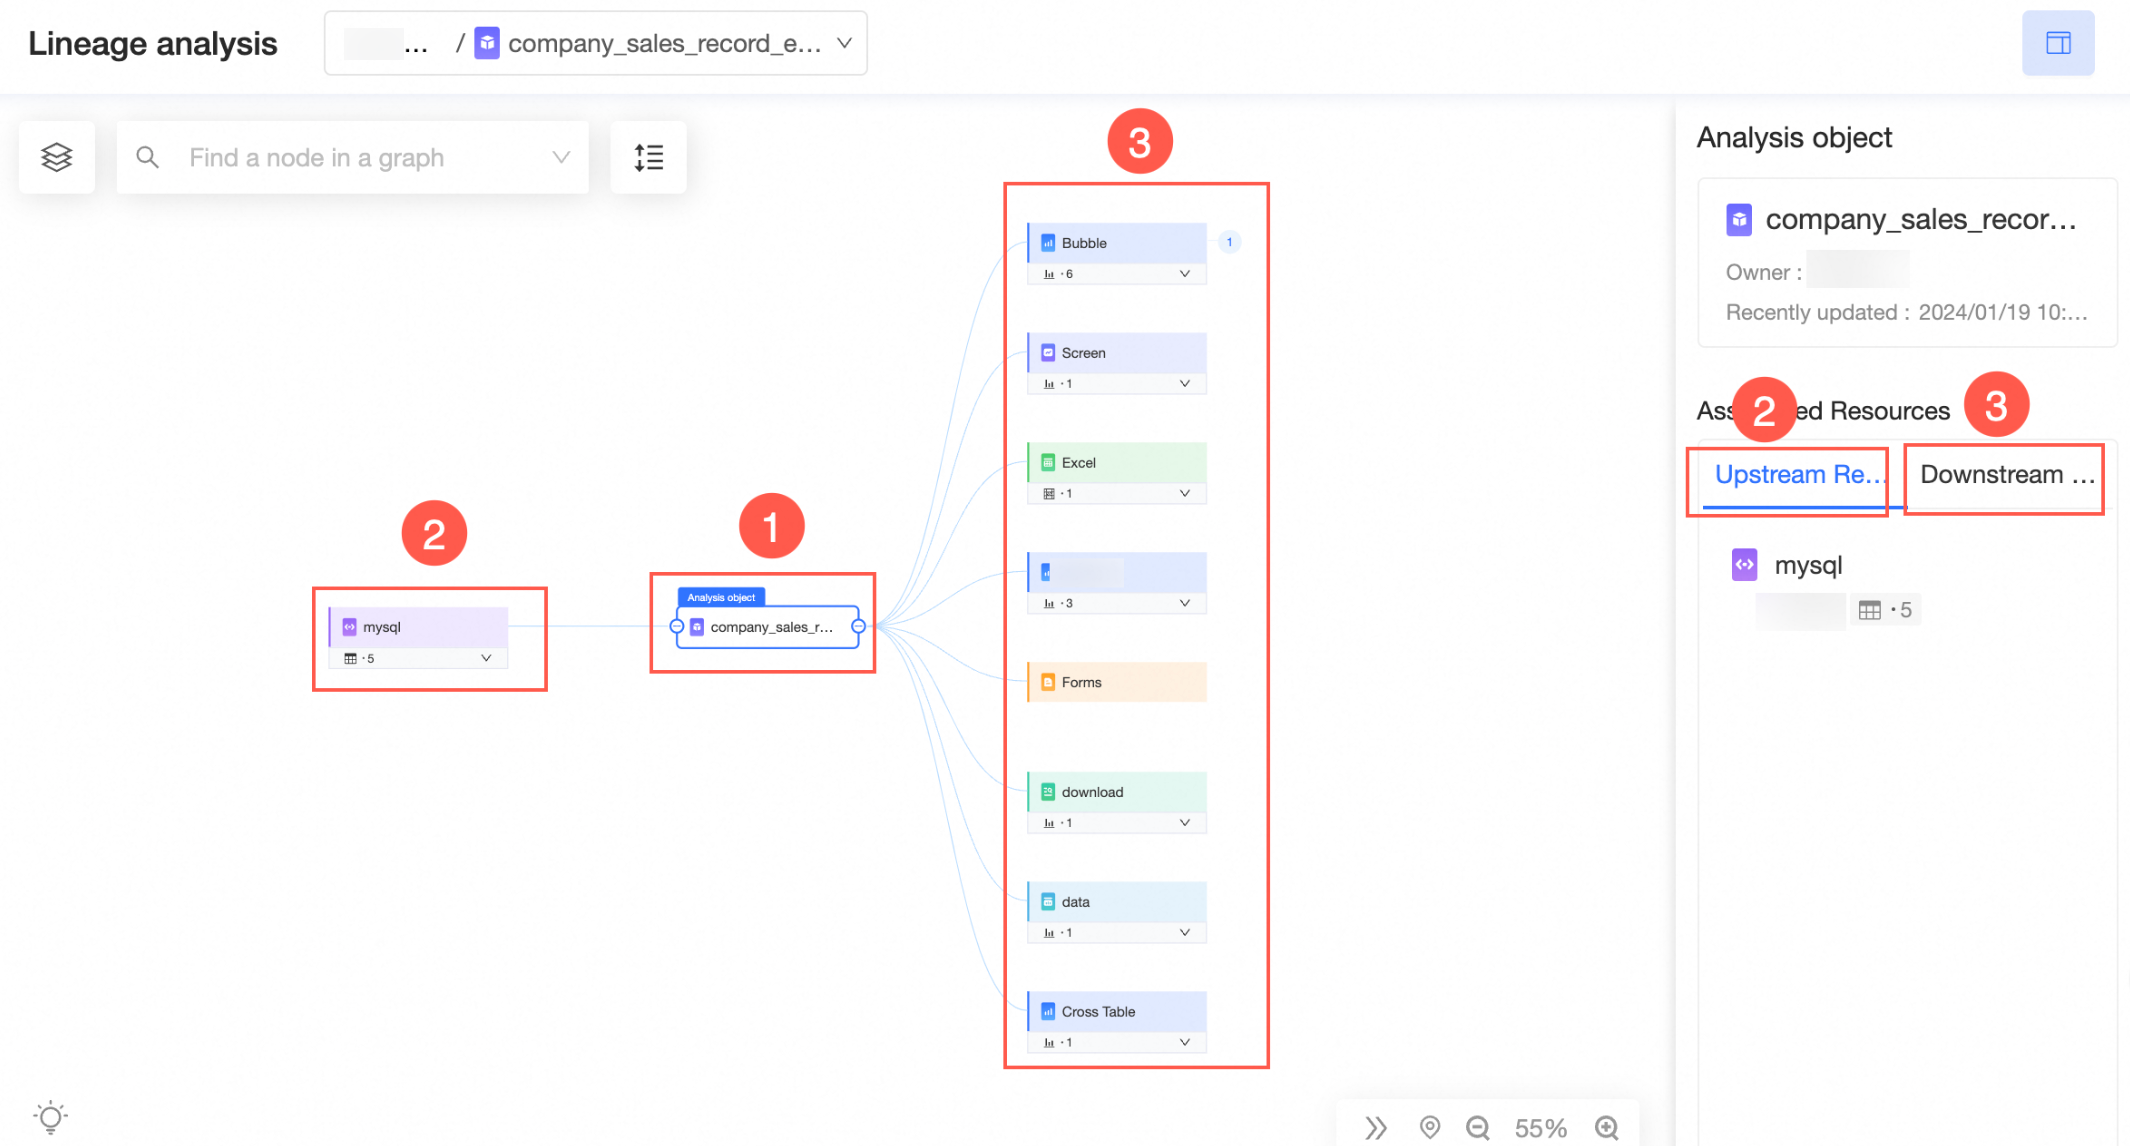
Analysis object: dataset
①Analysis object: dataset
②Upstream resources: data source
③Downstream resources: dashboard/spreadsheet/large-screen display/ad-hoc analysis/data portal/exploratory analysis/monitoring and alerts/email subscription
Analysis object: dashboard
①Analysis object: dashboard
②Upstream resources: dataset/data source
③Downstream resources: dashboard/data portal/monitoring and alerts/email subscription
Analysis object: spreadsheet
①Analysis object: spreadsheet
②Upstream resources: dataset/data source
③Downstream resources: data portal/monitoring and alerts/email subscription