View Q-Insight
Q-Insight features two core capabilities: Business Insight and Metric Insight.Metric Insight is a key feature of the intelligent module. It uses automated attribution algorithms to perform multi-dimensional, multi-level root cause analysis on metric fluctuations within a single dataset. It automatically generates attribution summaries and data tables to help you quickly pinpoint the source of issues.Business Insight integrates multiple key business metrics to create a unified, comprehensive business overview. It provides a complete and accurate picture of your company's overall performance, offering decision support and actionable guidance for your business teams. This topic explains how to view Q-Insight results.
Q-Insight is a value-added module that requires a separate purchase.
Access Q-Insight
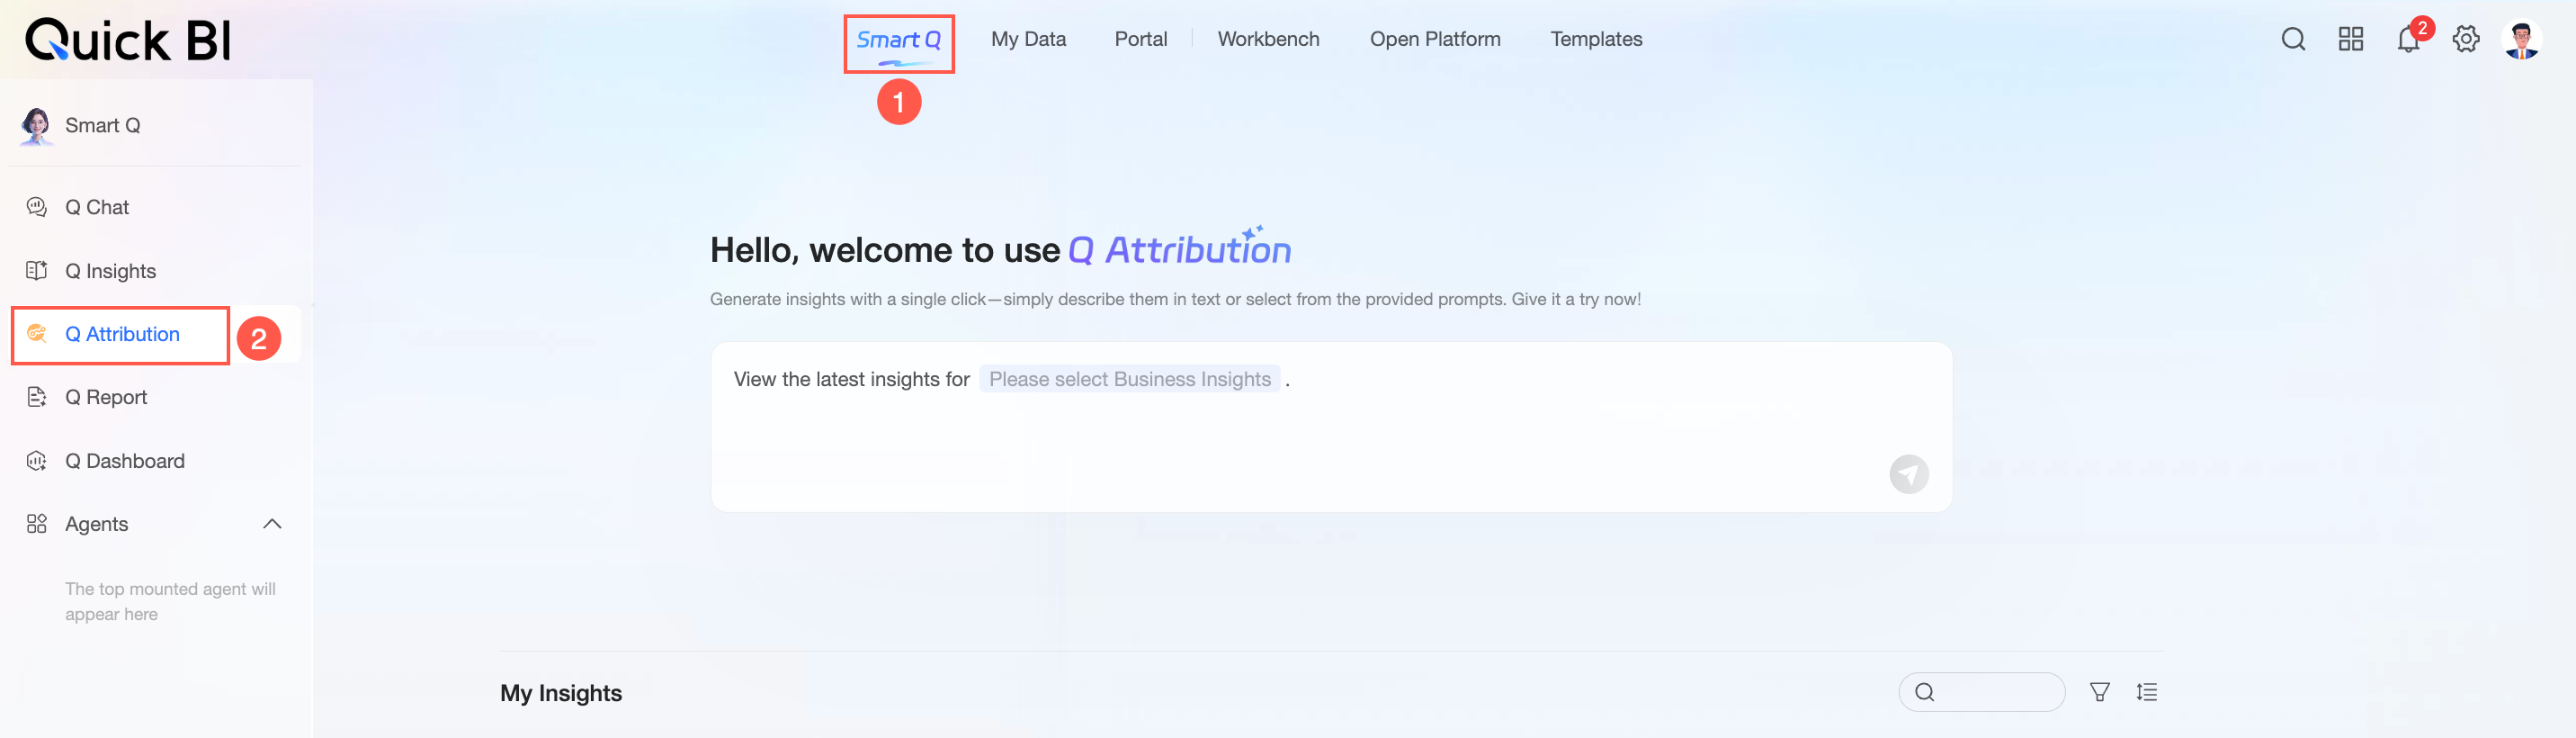
On the Quick BI homepage, click Intelligent Q, and then select Q-Insight from the left-side navigation pane.
Prerequisites
You have configured Business Insight and Metric Insight.
View Business Insight
In the Q-Insight dialog box, select the Business Insight you want to view.
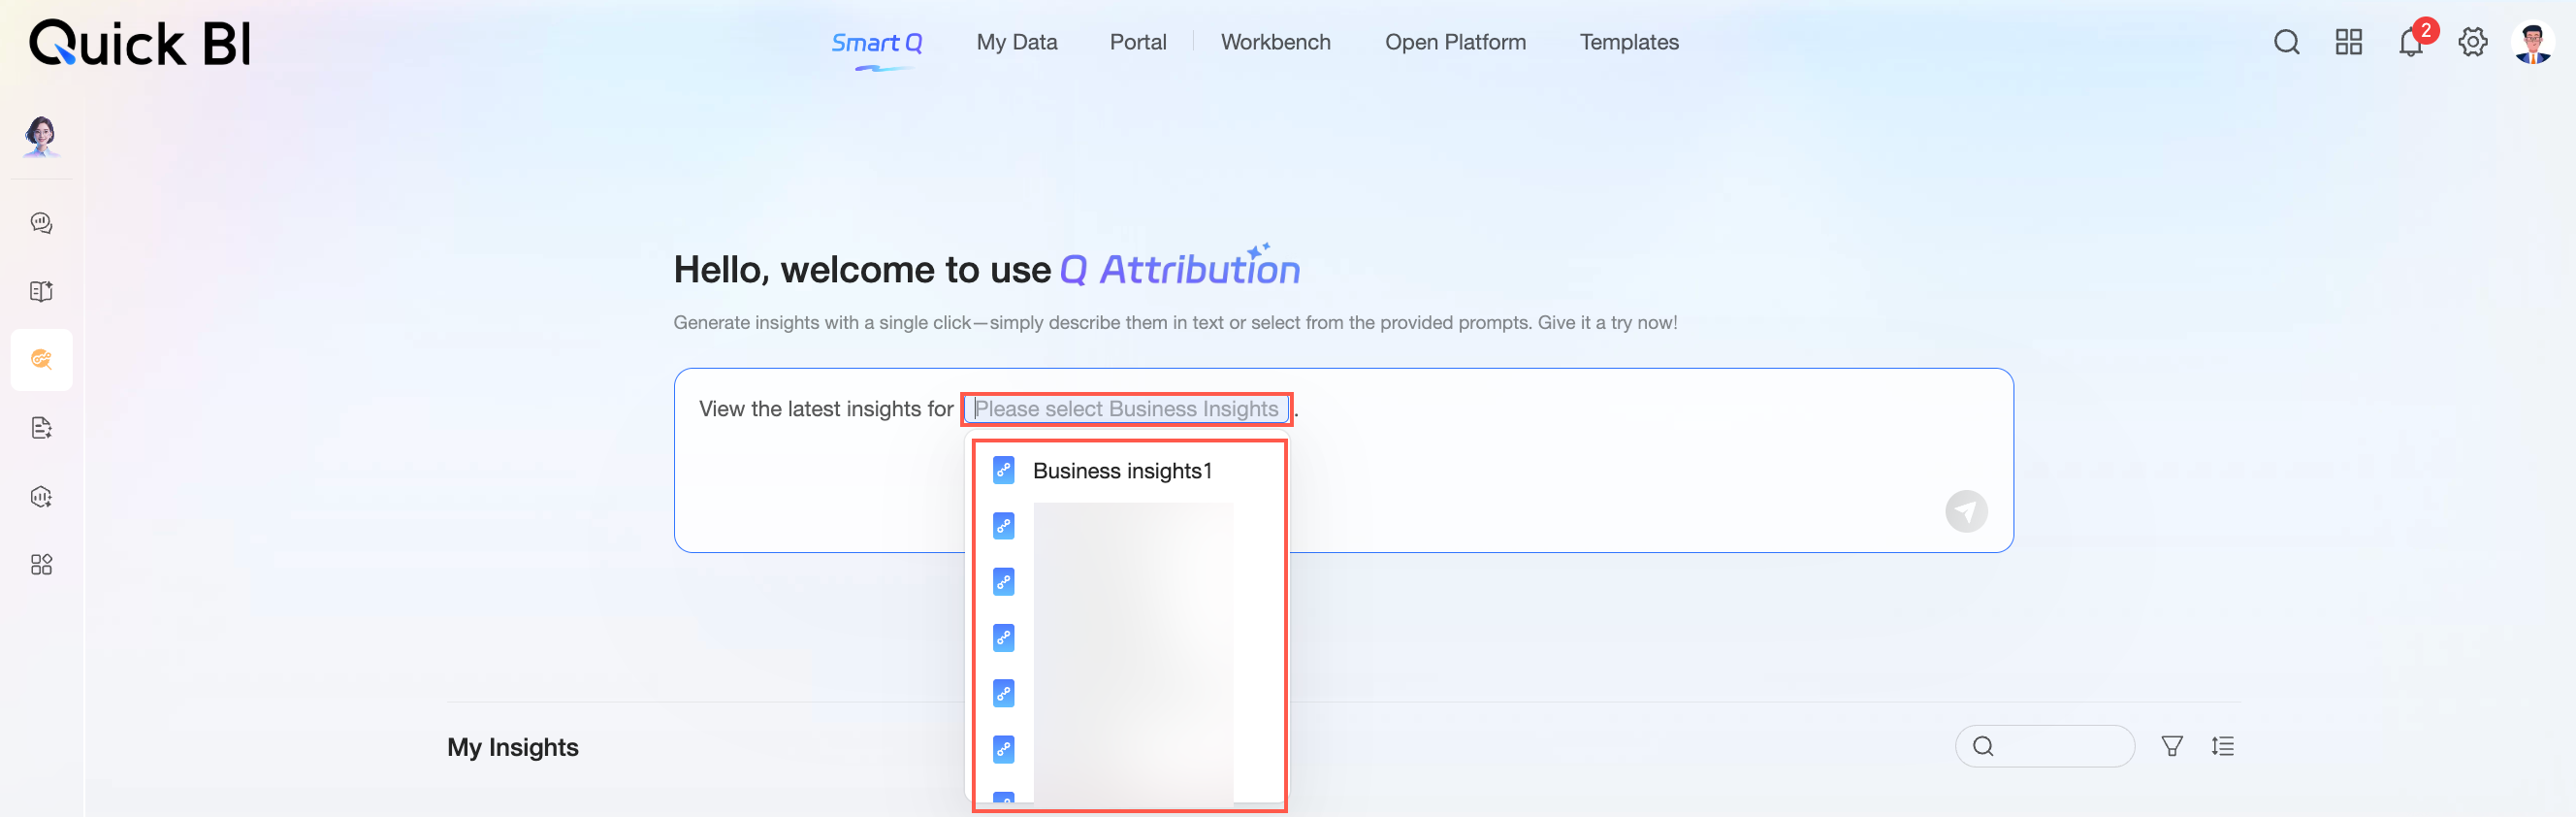
Click the send icon in the lower-right corner of the dialog box.

You can now view the latest results for the selected Business Insight.
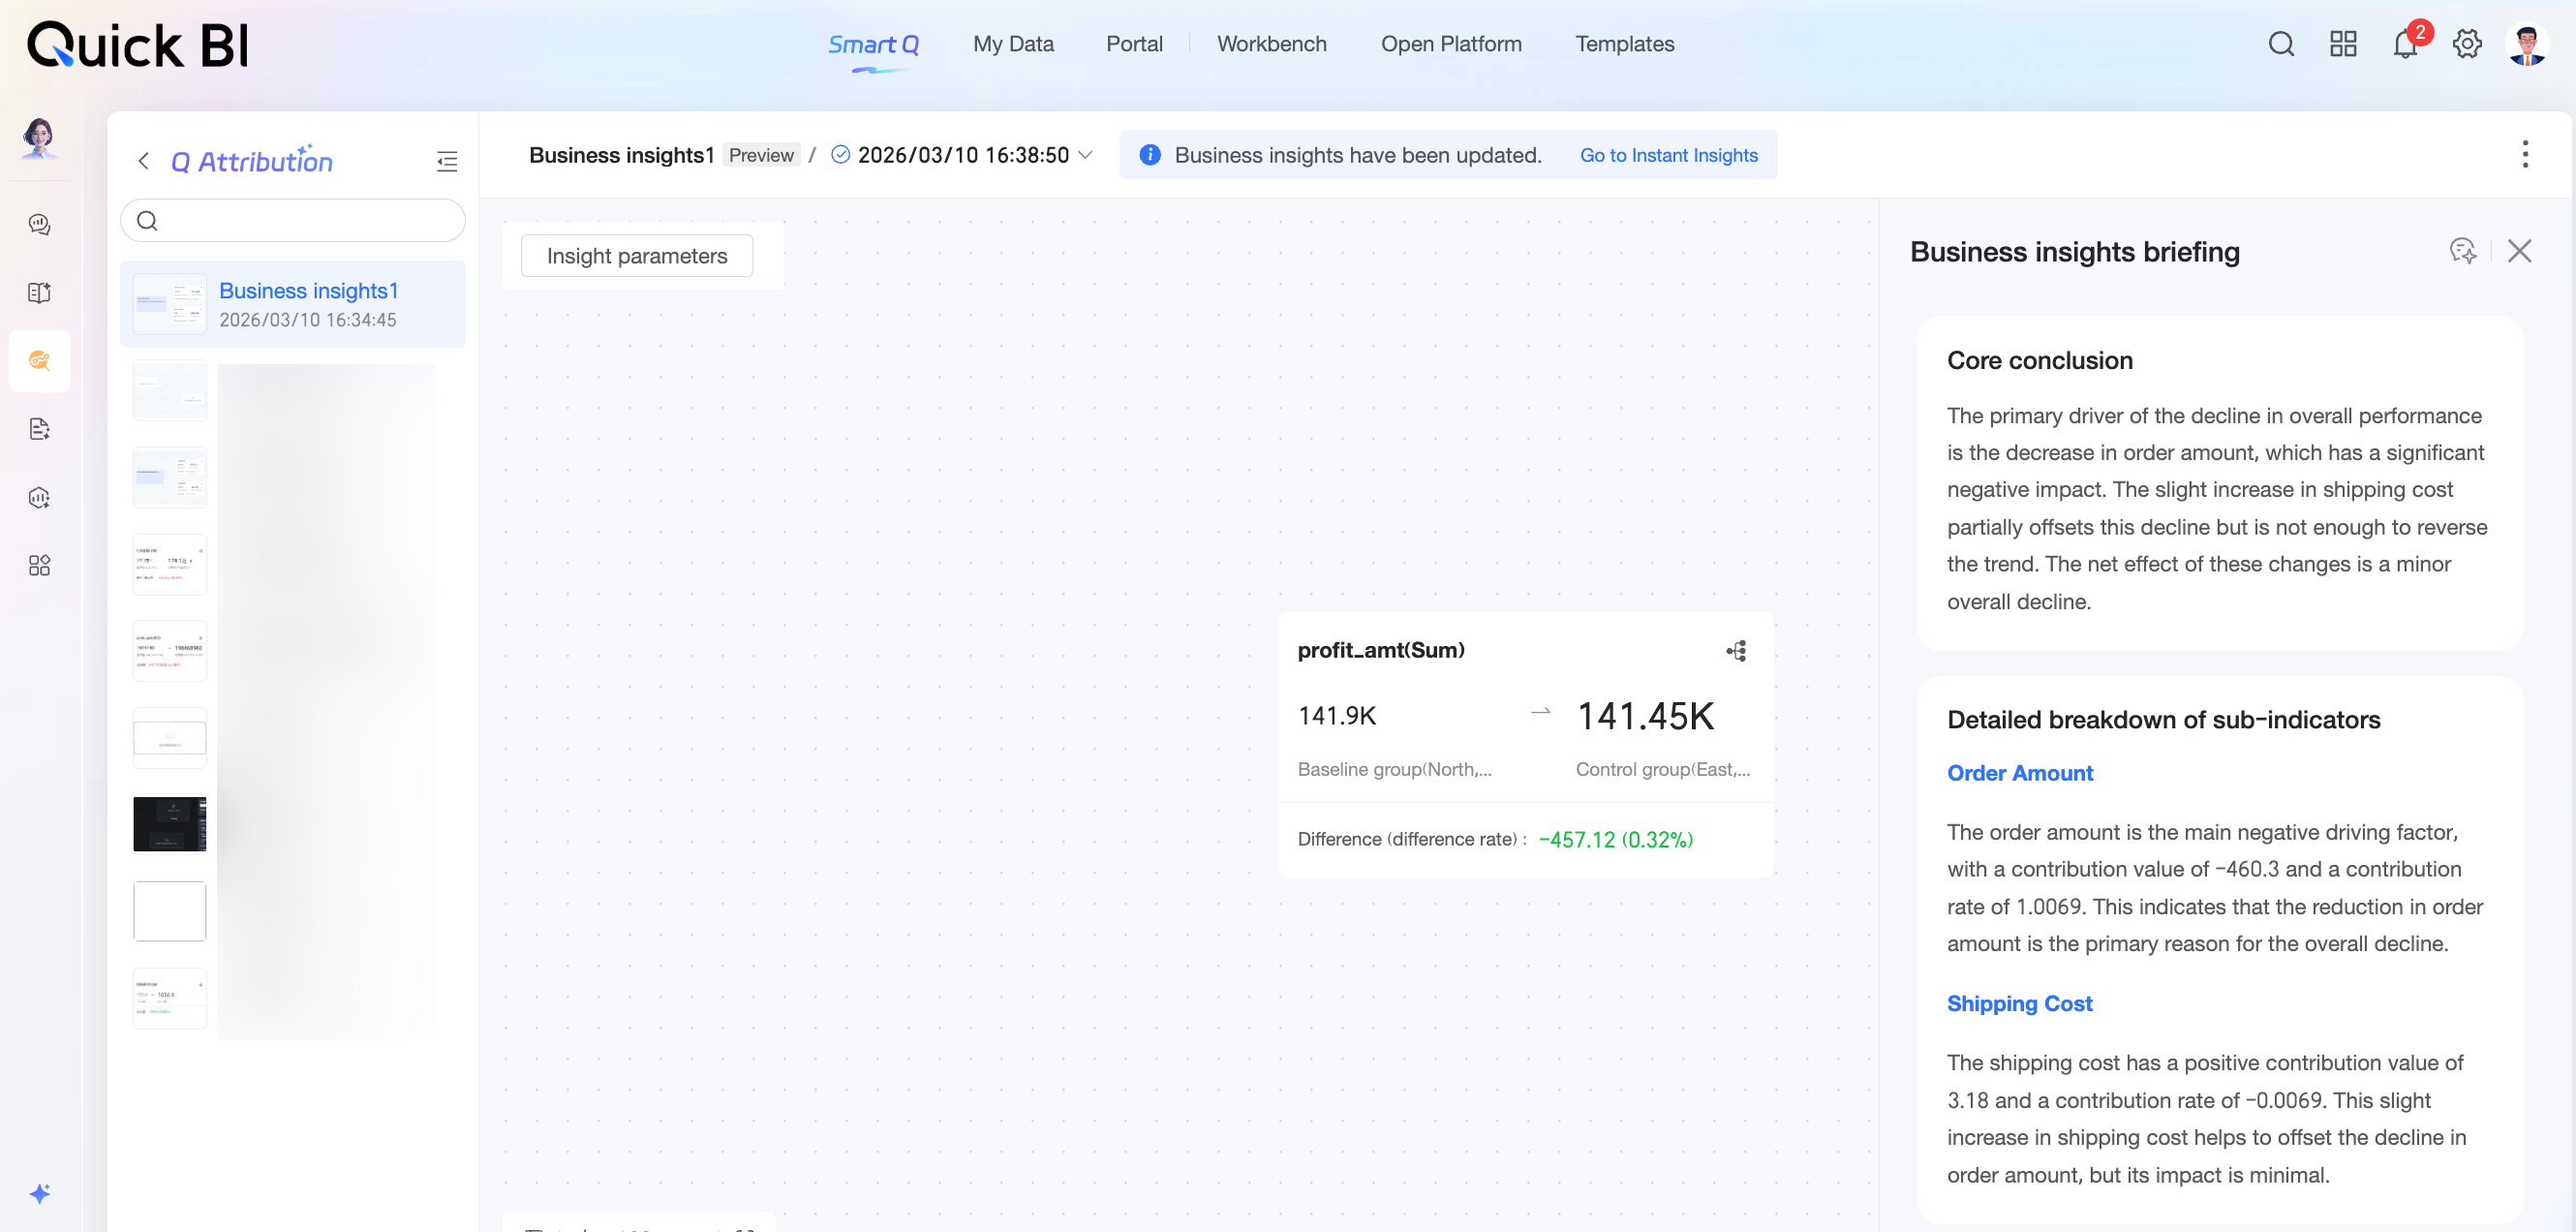
If no data appears, click run to update the insight results.
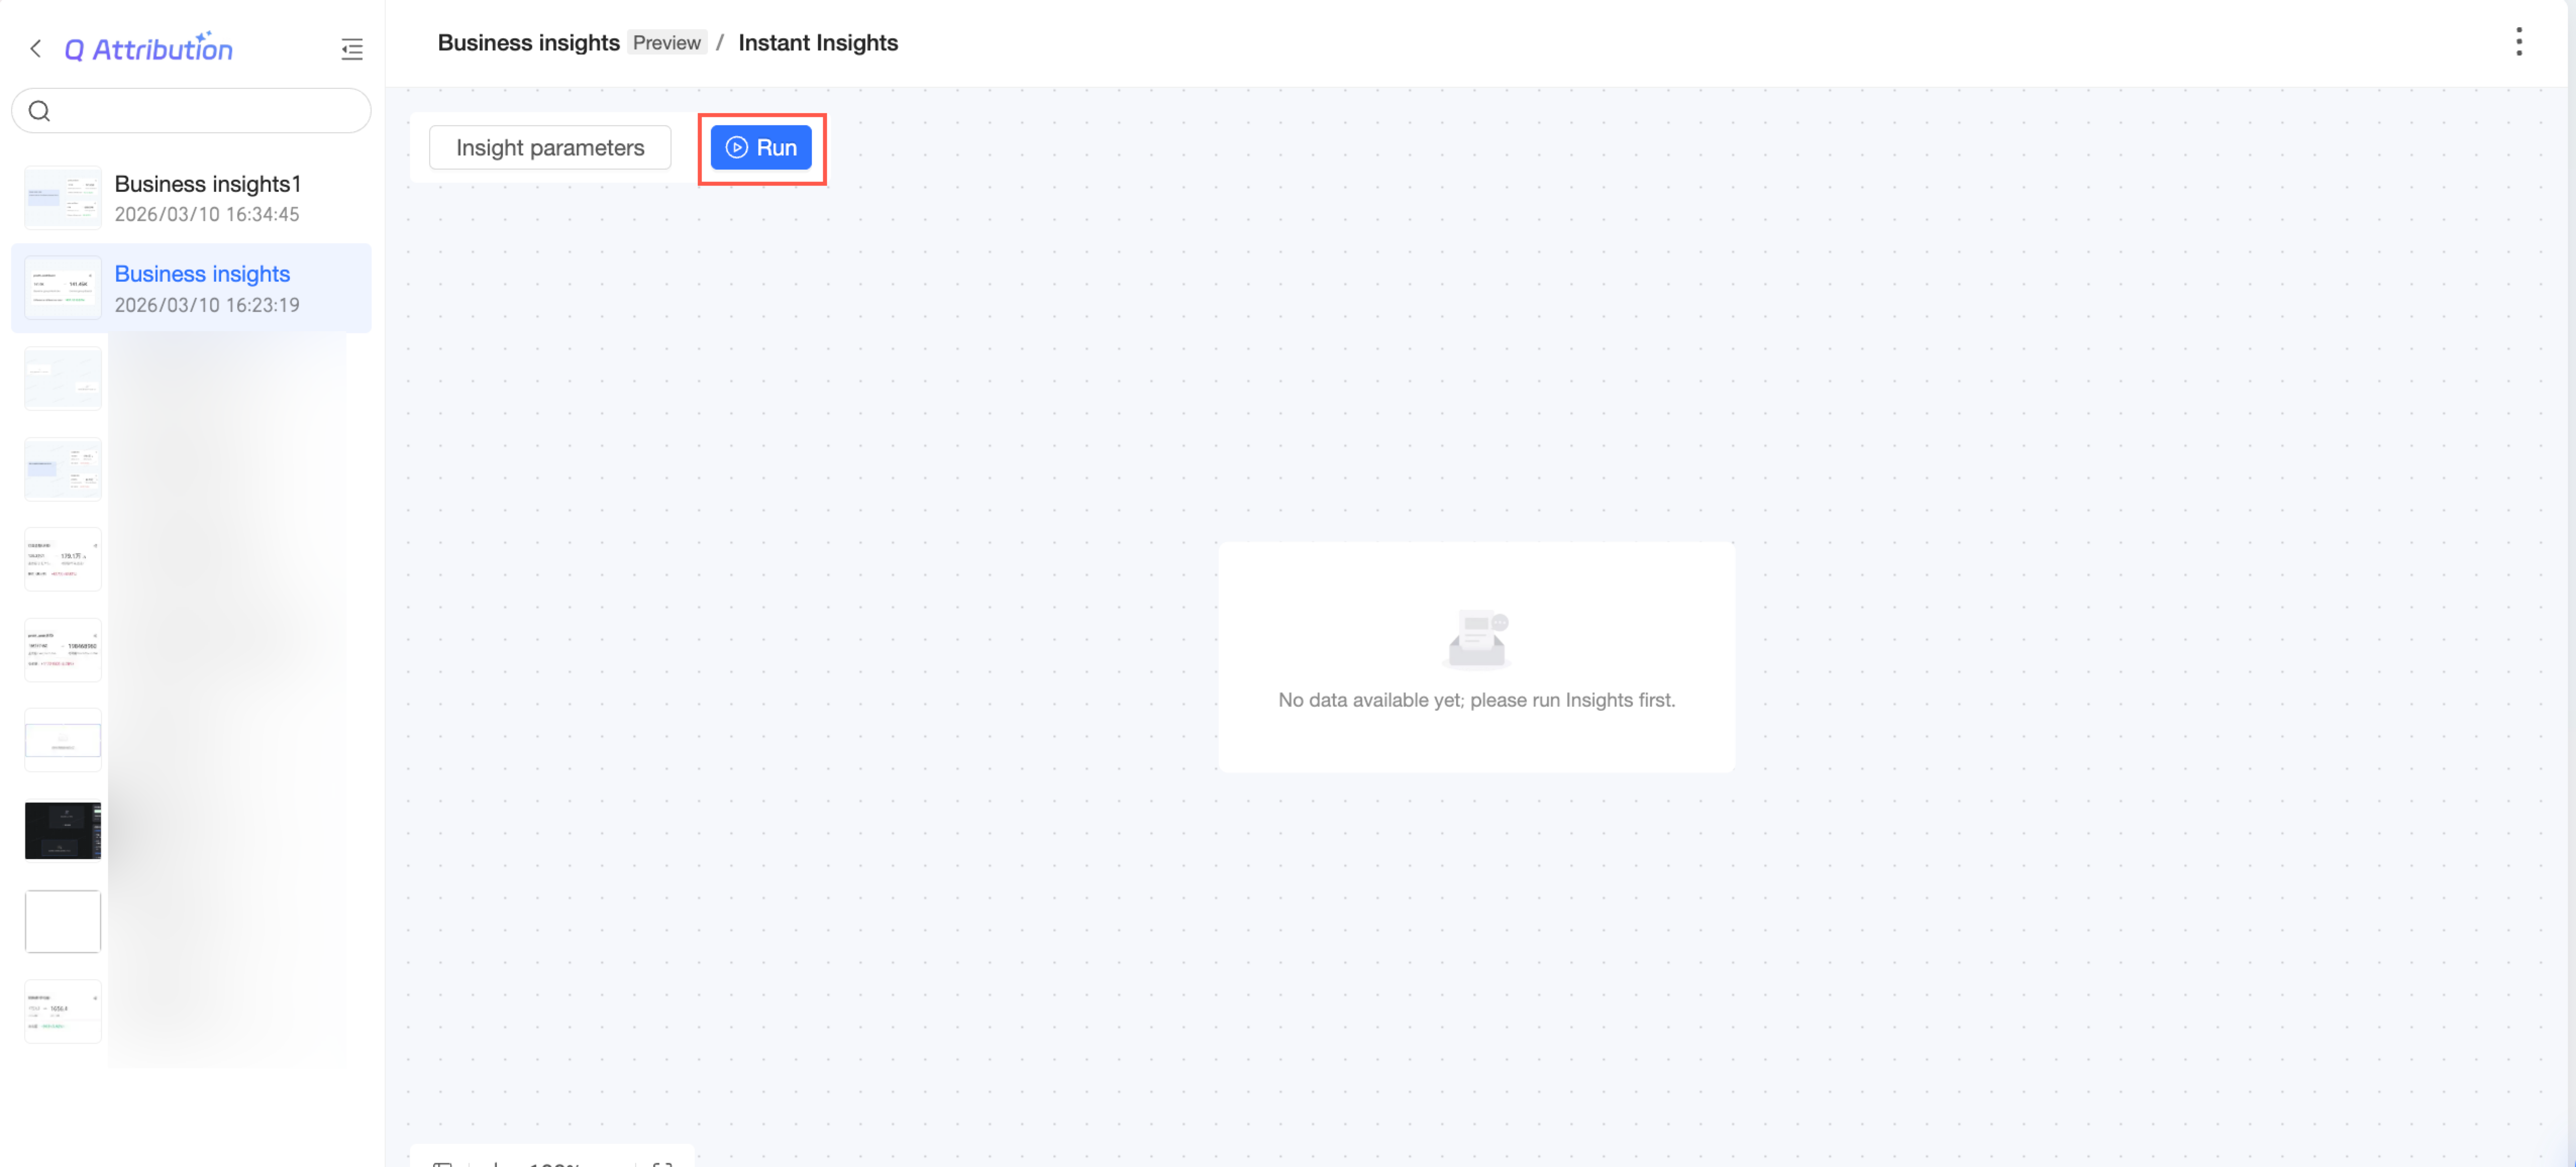
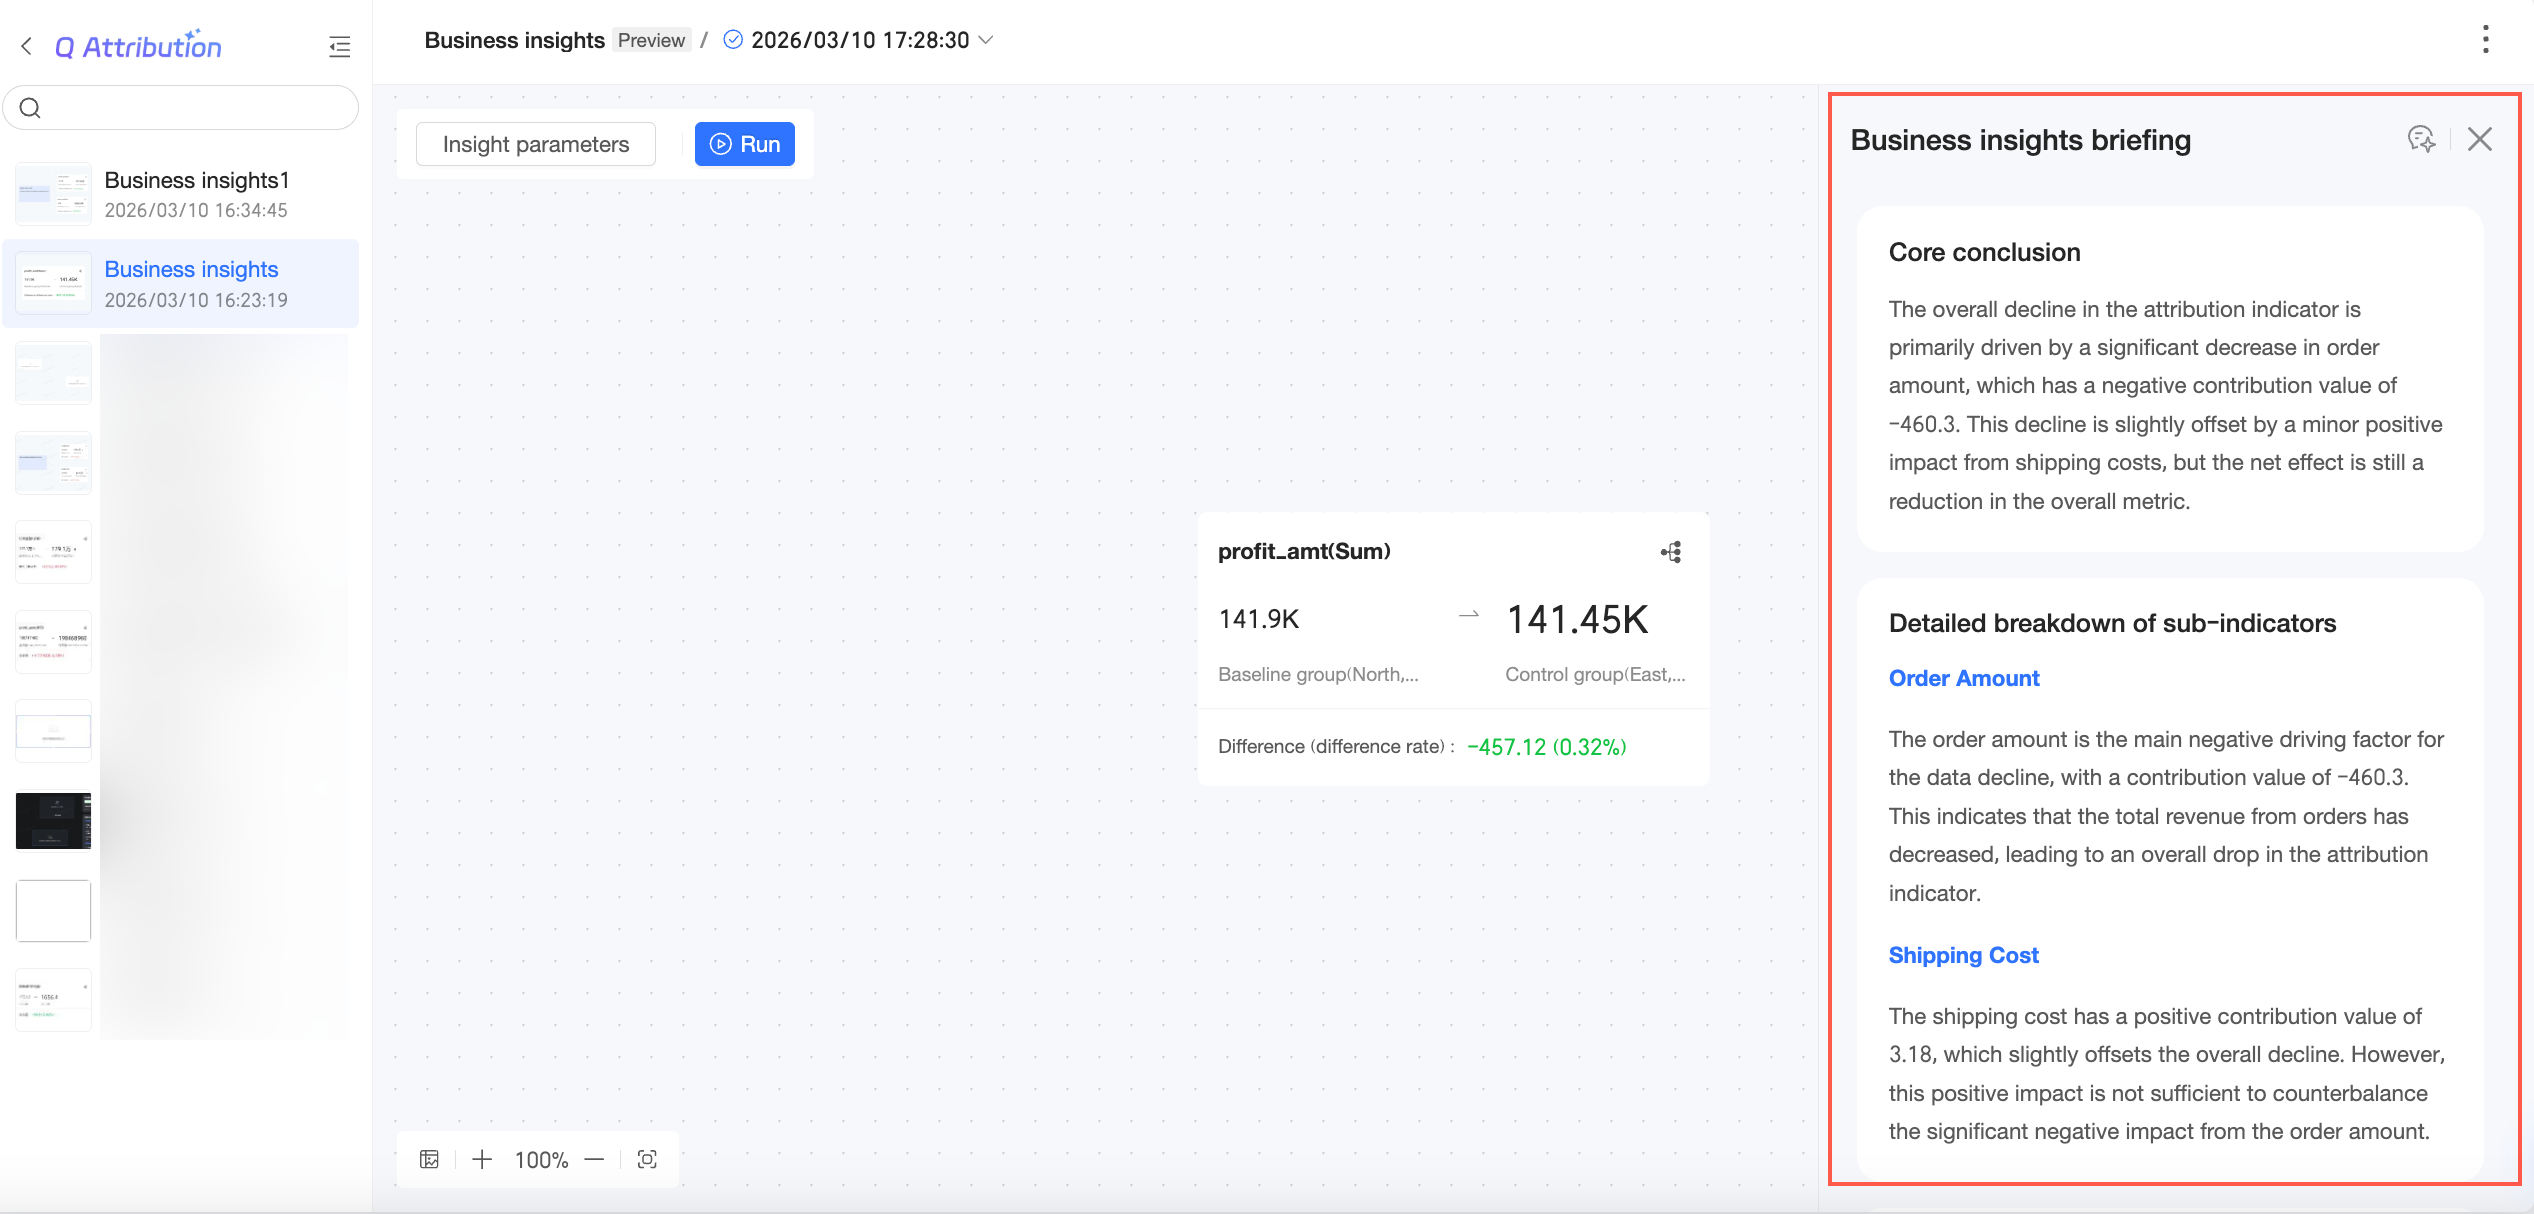
Click the
 icon in the upper-right corner to view the Business Insight Briefing.
In the Business Insight Briefing, click the
icon at the top to view the execution process.
 icon in the upper-right corner to view the Business Insight Briefing.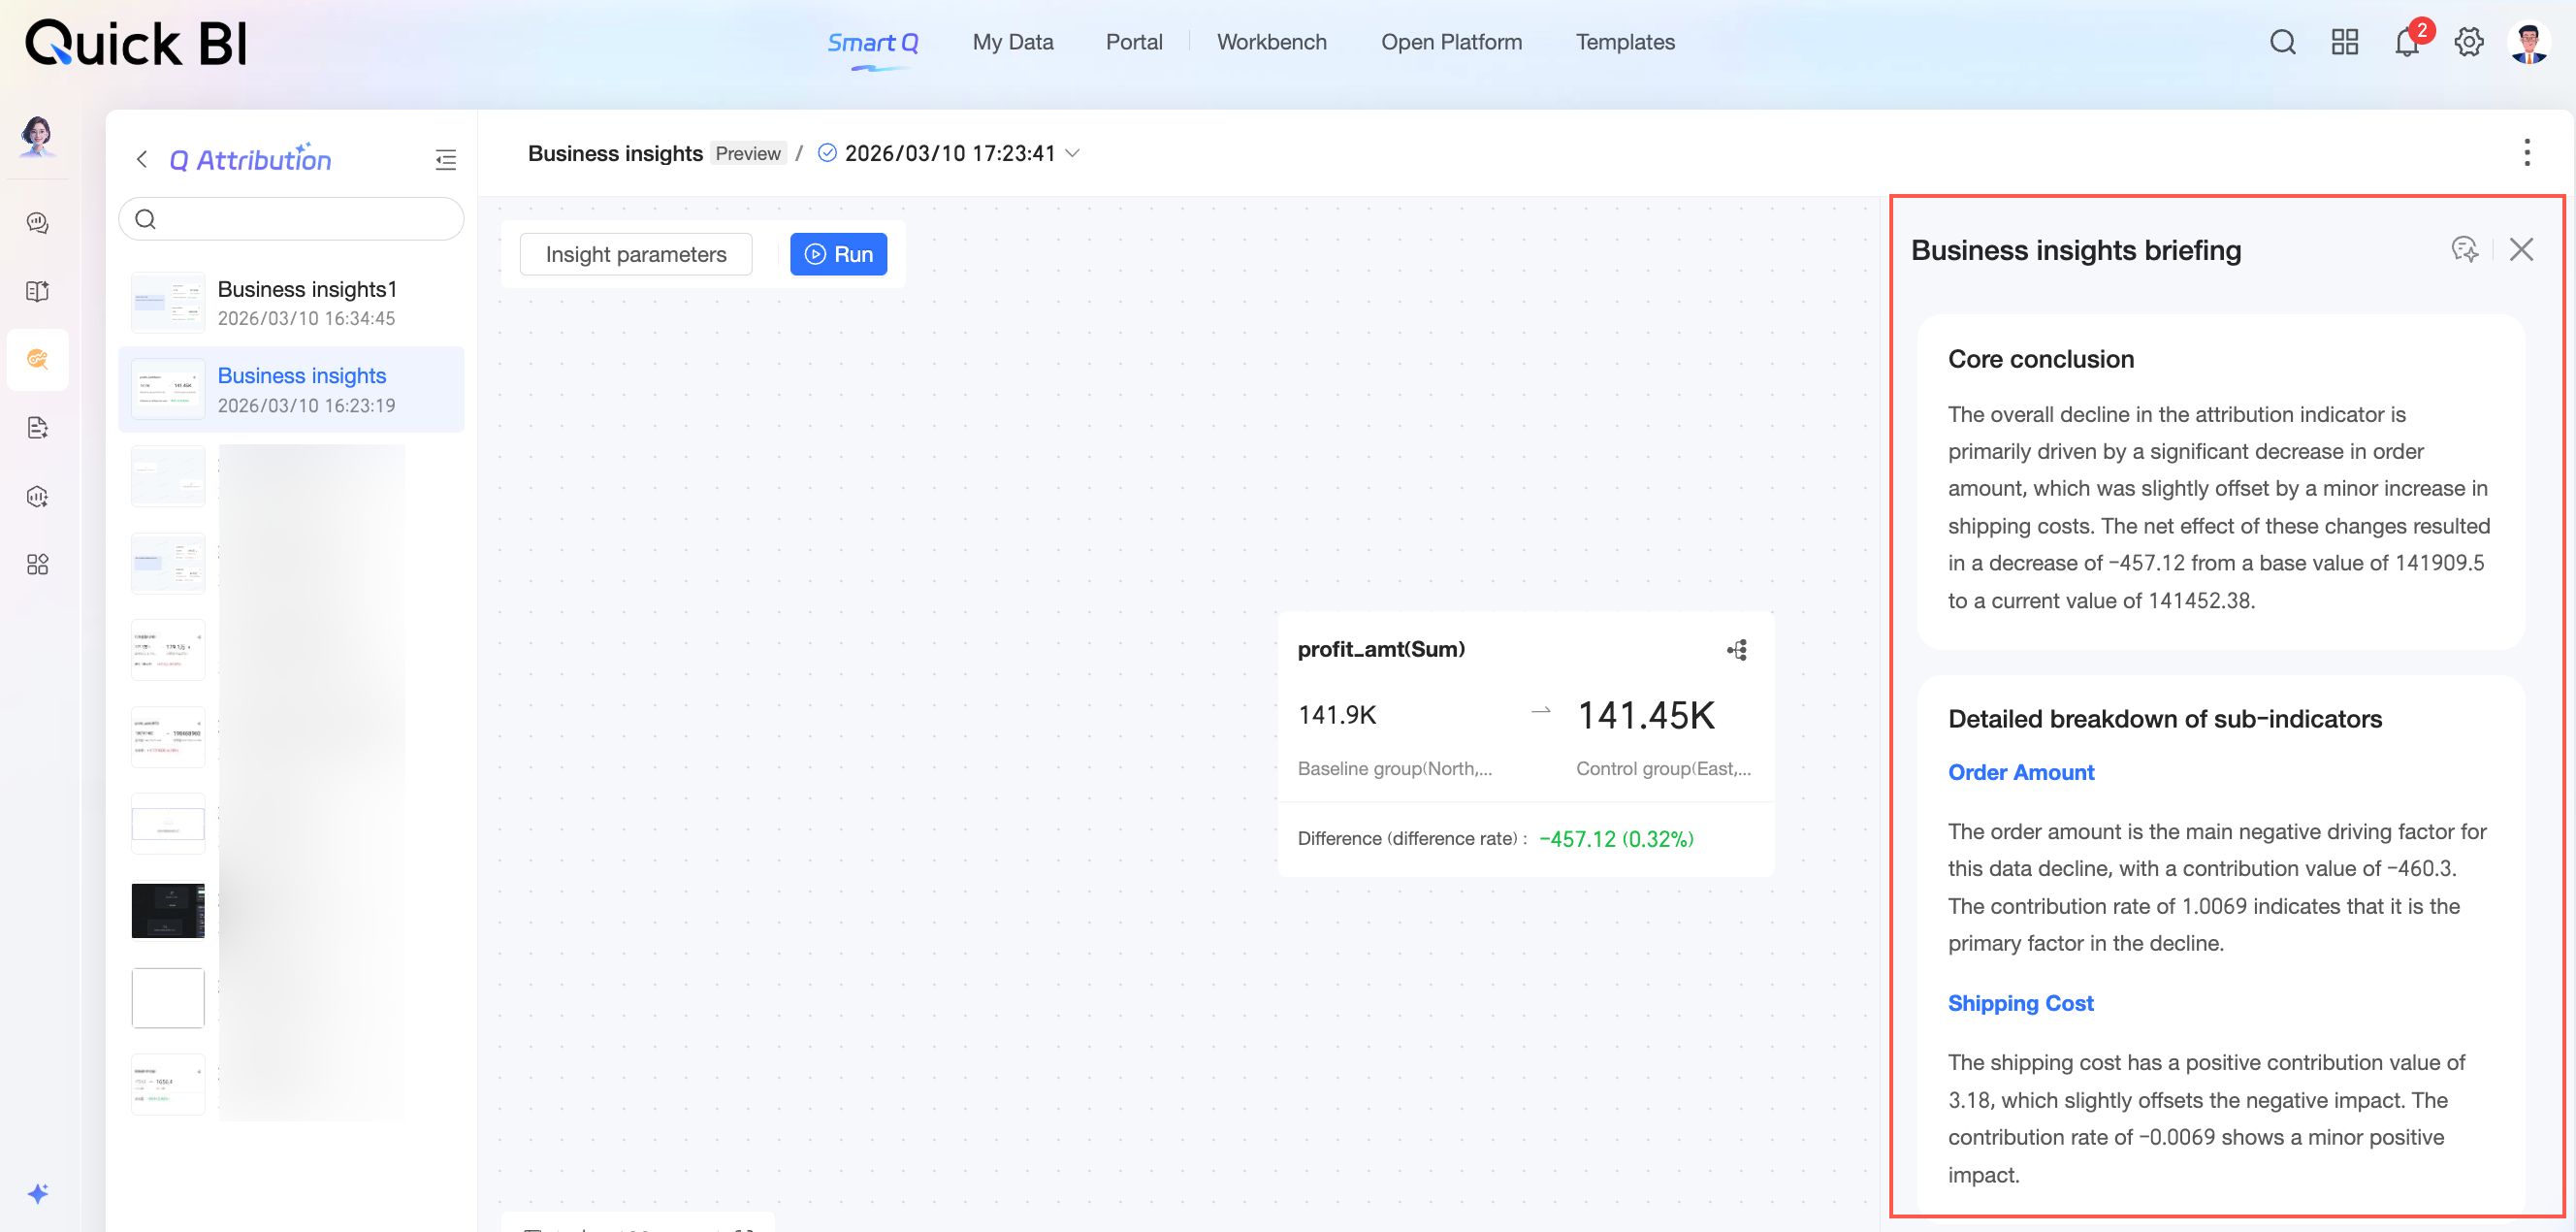
 icon at the top to view the execution process.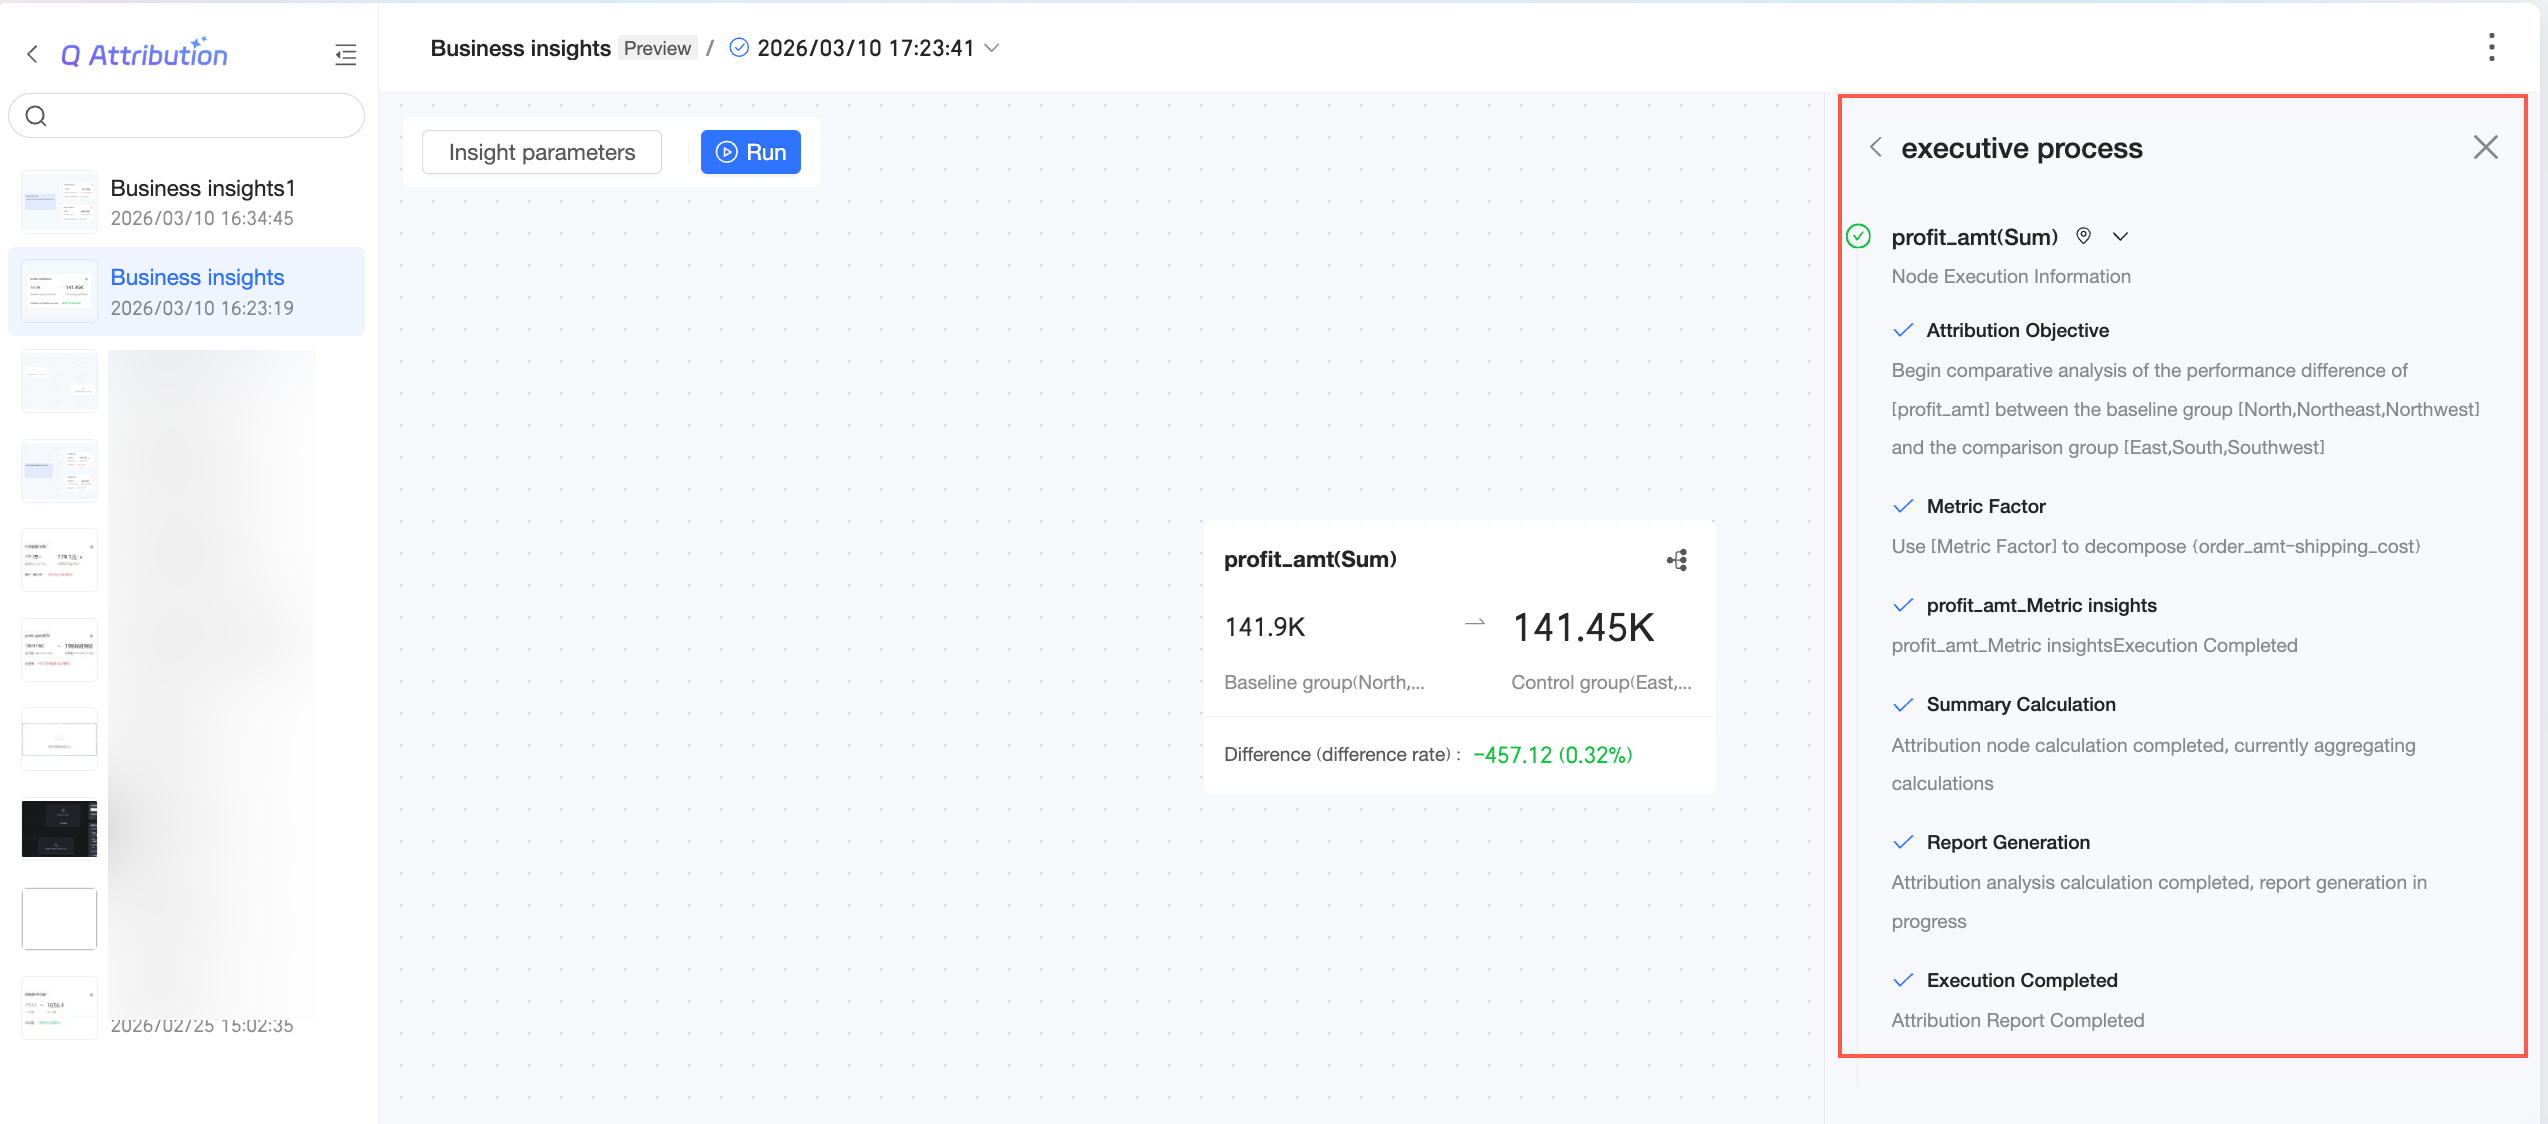
Insight Parameters
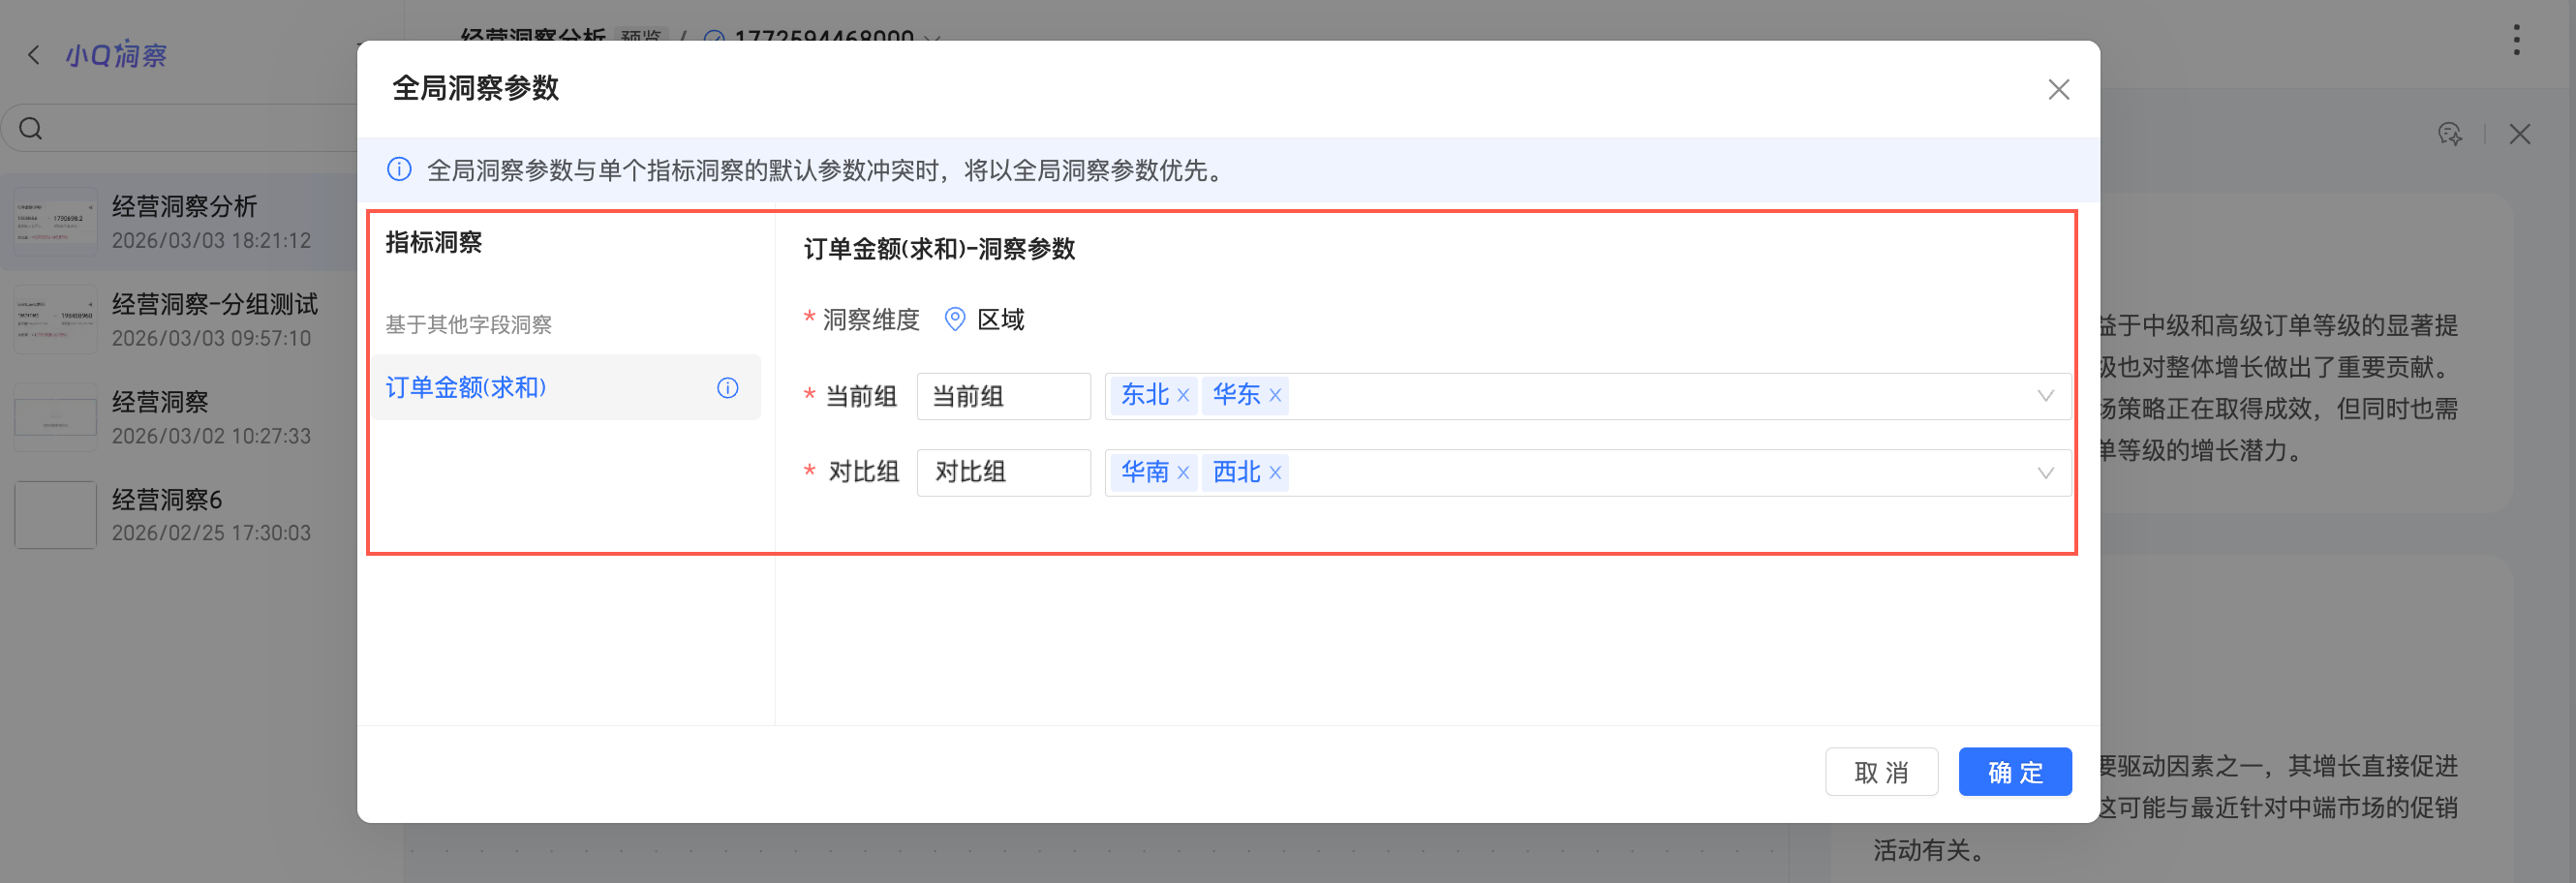
If global insight parameters conflict with the default parameters of a single Metric Insight, the global insight parameters take precedence. Use the following steps to configure the global insight parameters.
Click the Insight Parameters button in the upper-left corner.
Modify the names and dimension values for the items to be compared. If the insight dimension is a date, these are the current period and comparison period. If it is text, these are the current group and comparison group.
Click OK.
Run an insight task
Click run to execute the insight task.
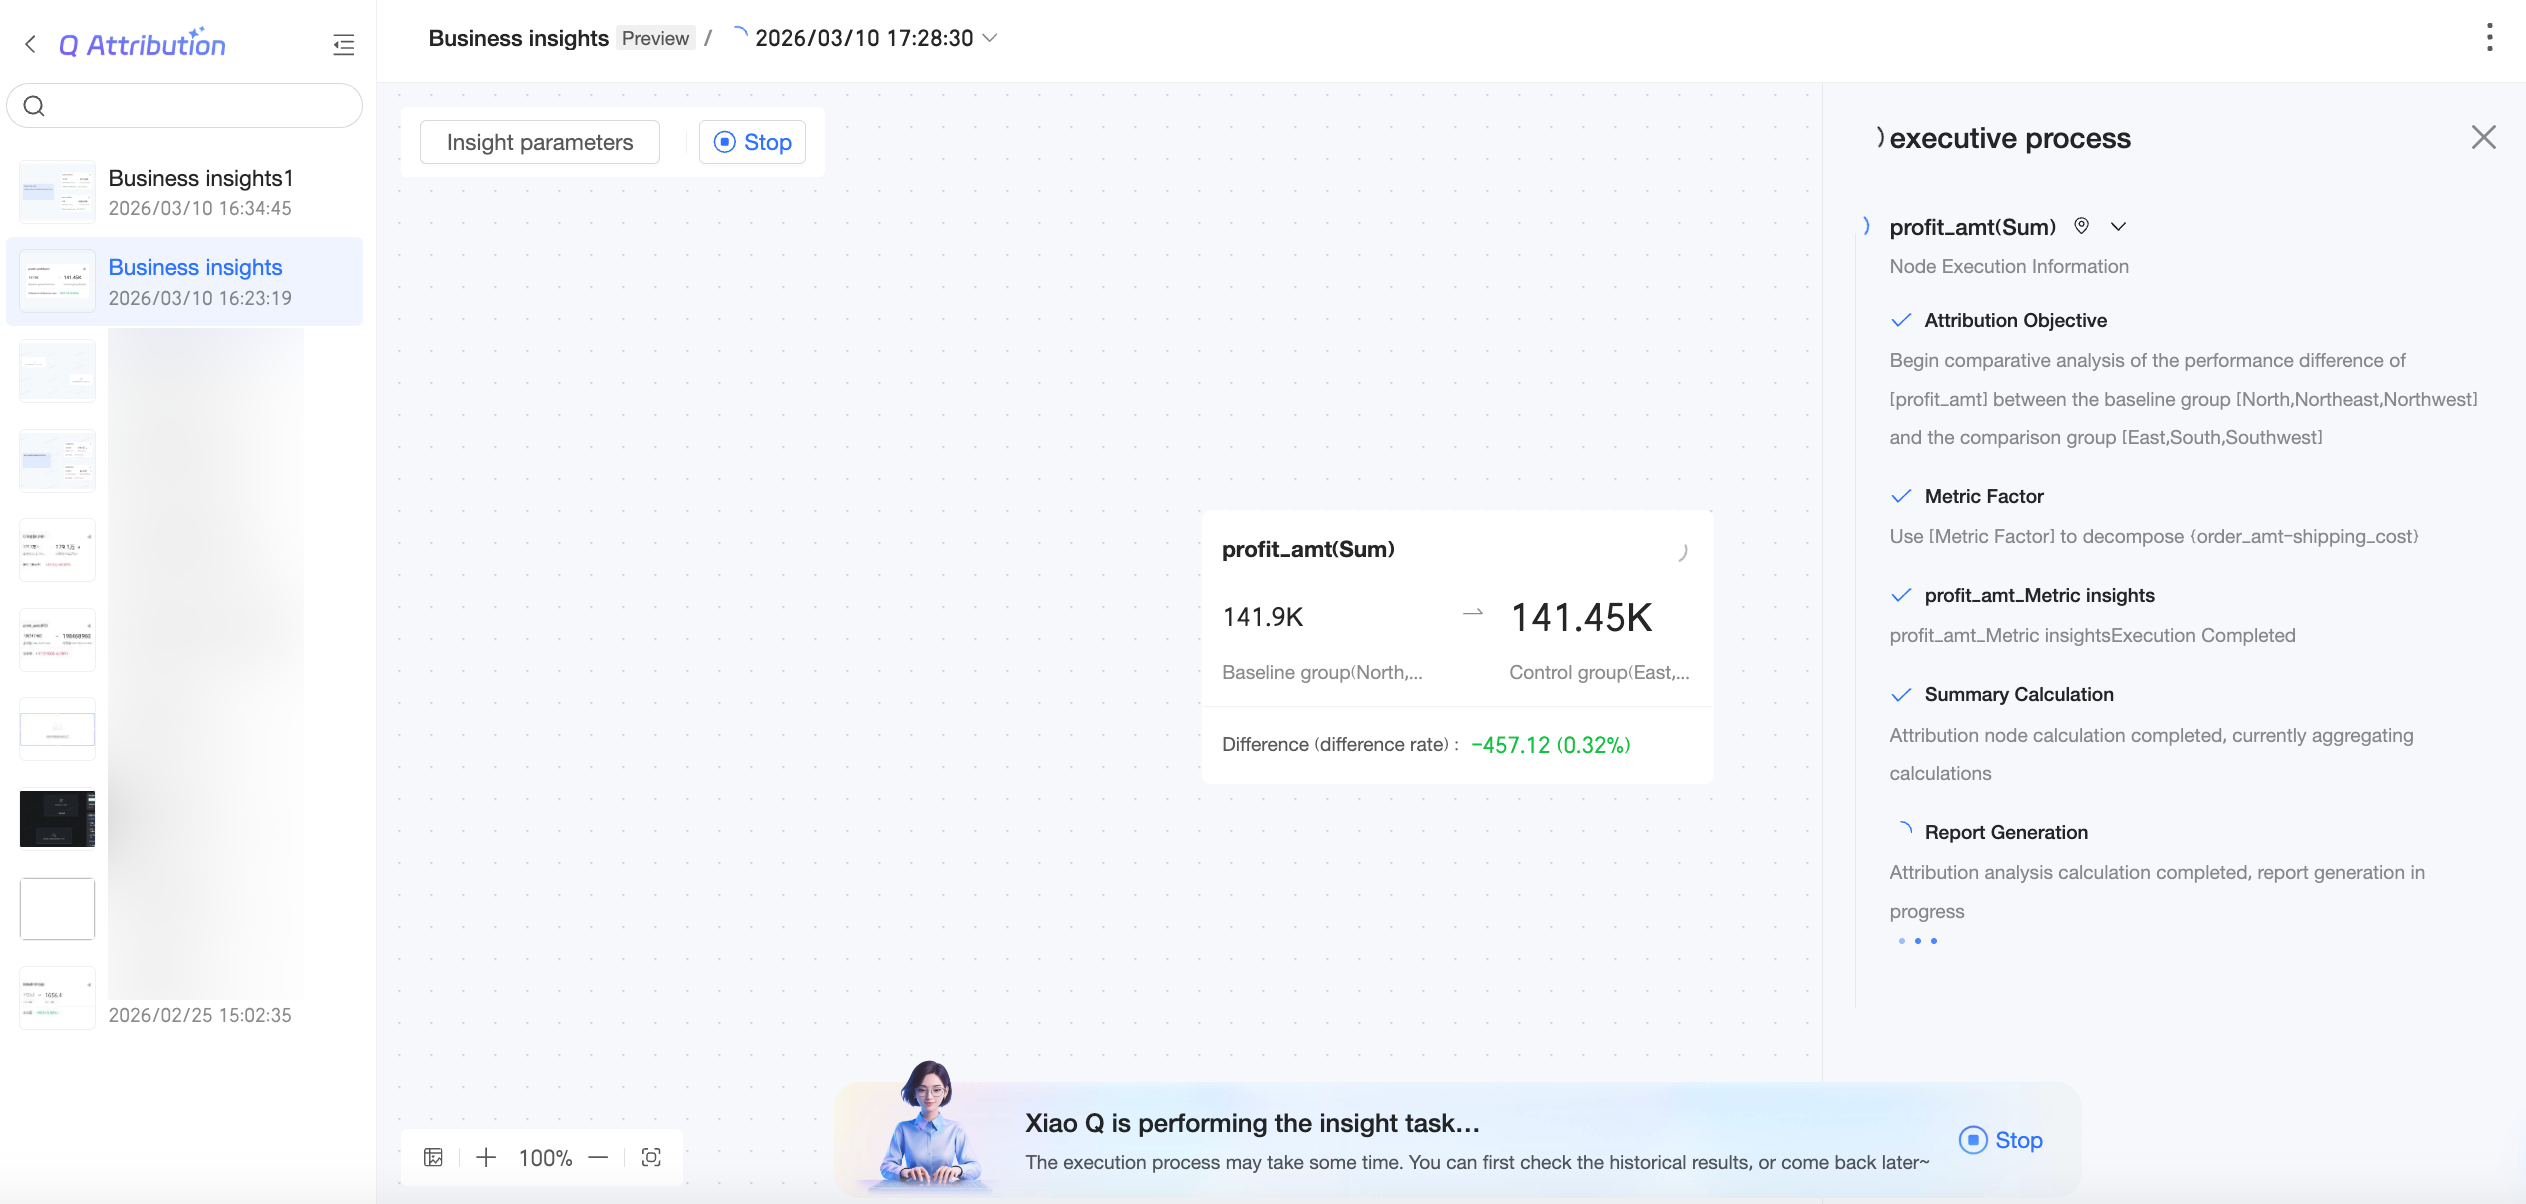
You can stop the execution while it is in progress.
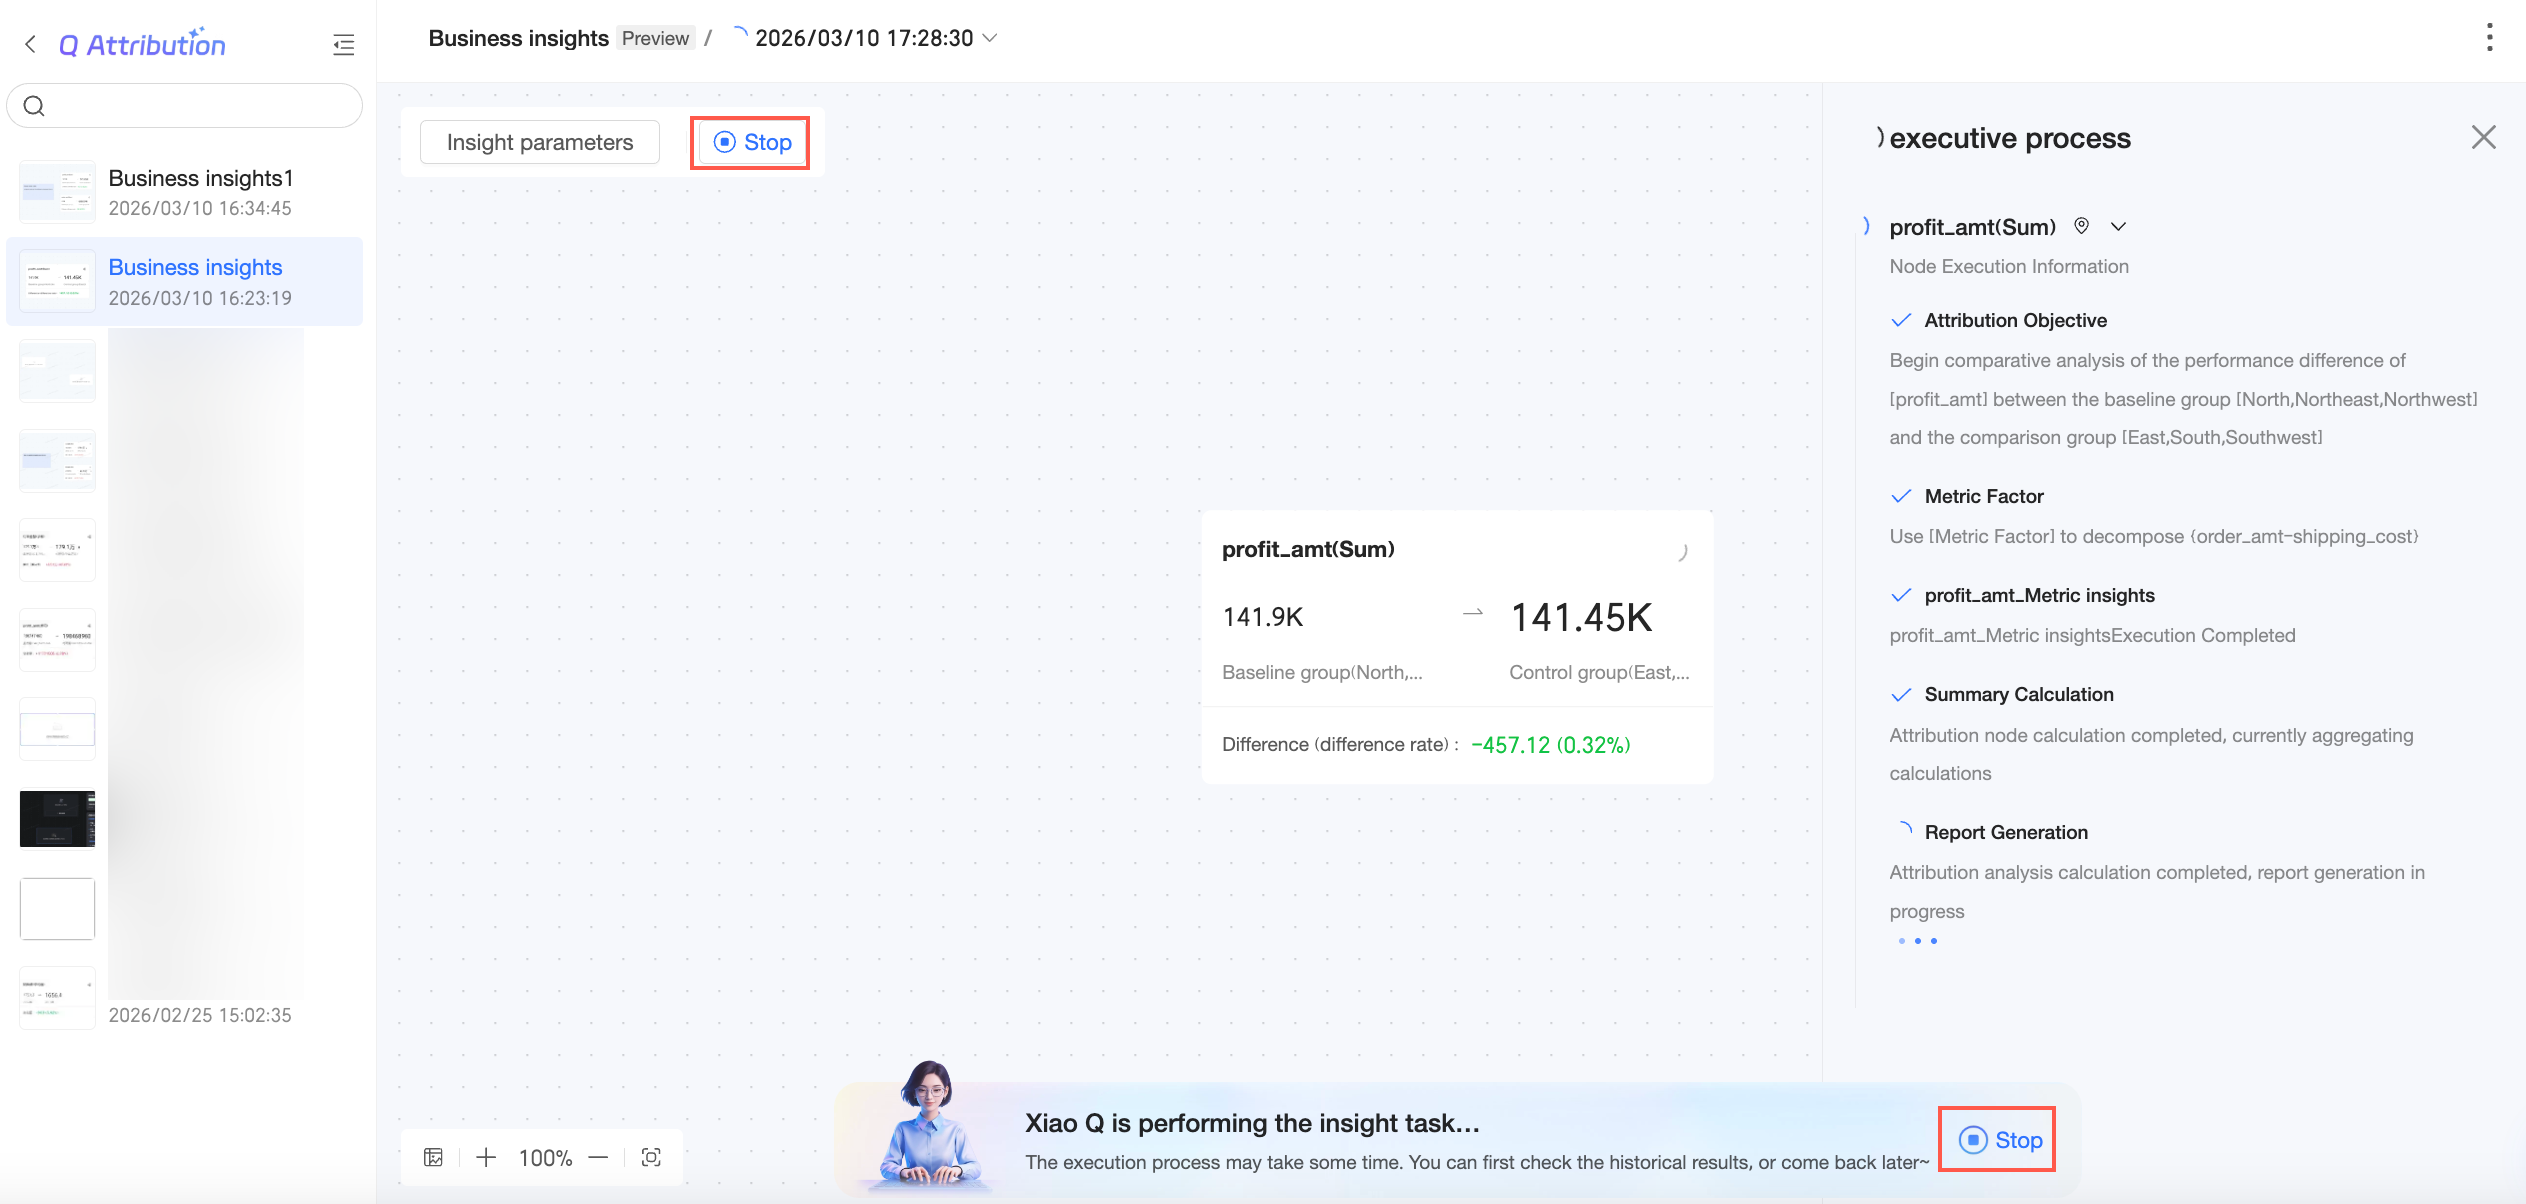
Once the execution is complete, you can view the latest Business Insight Briefing.
View Metric Insight
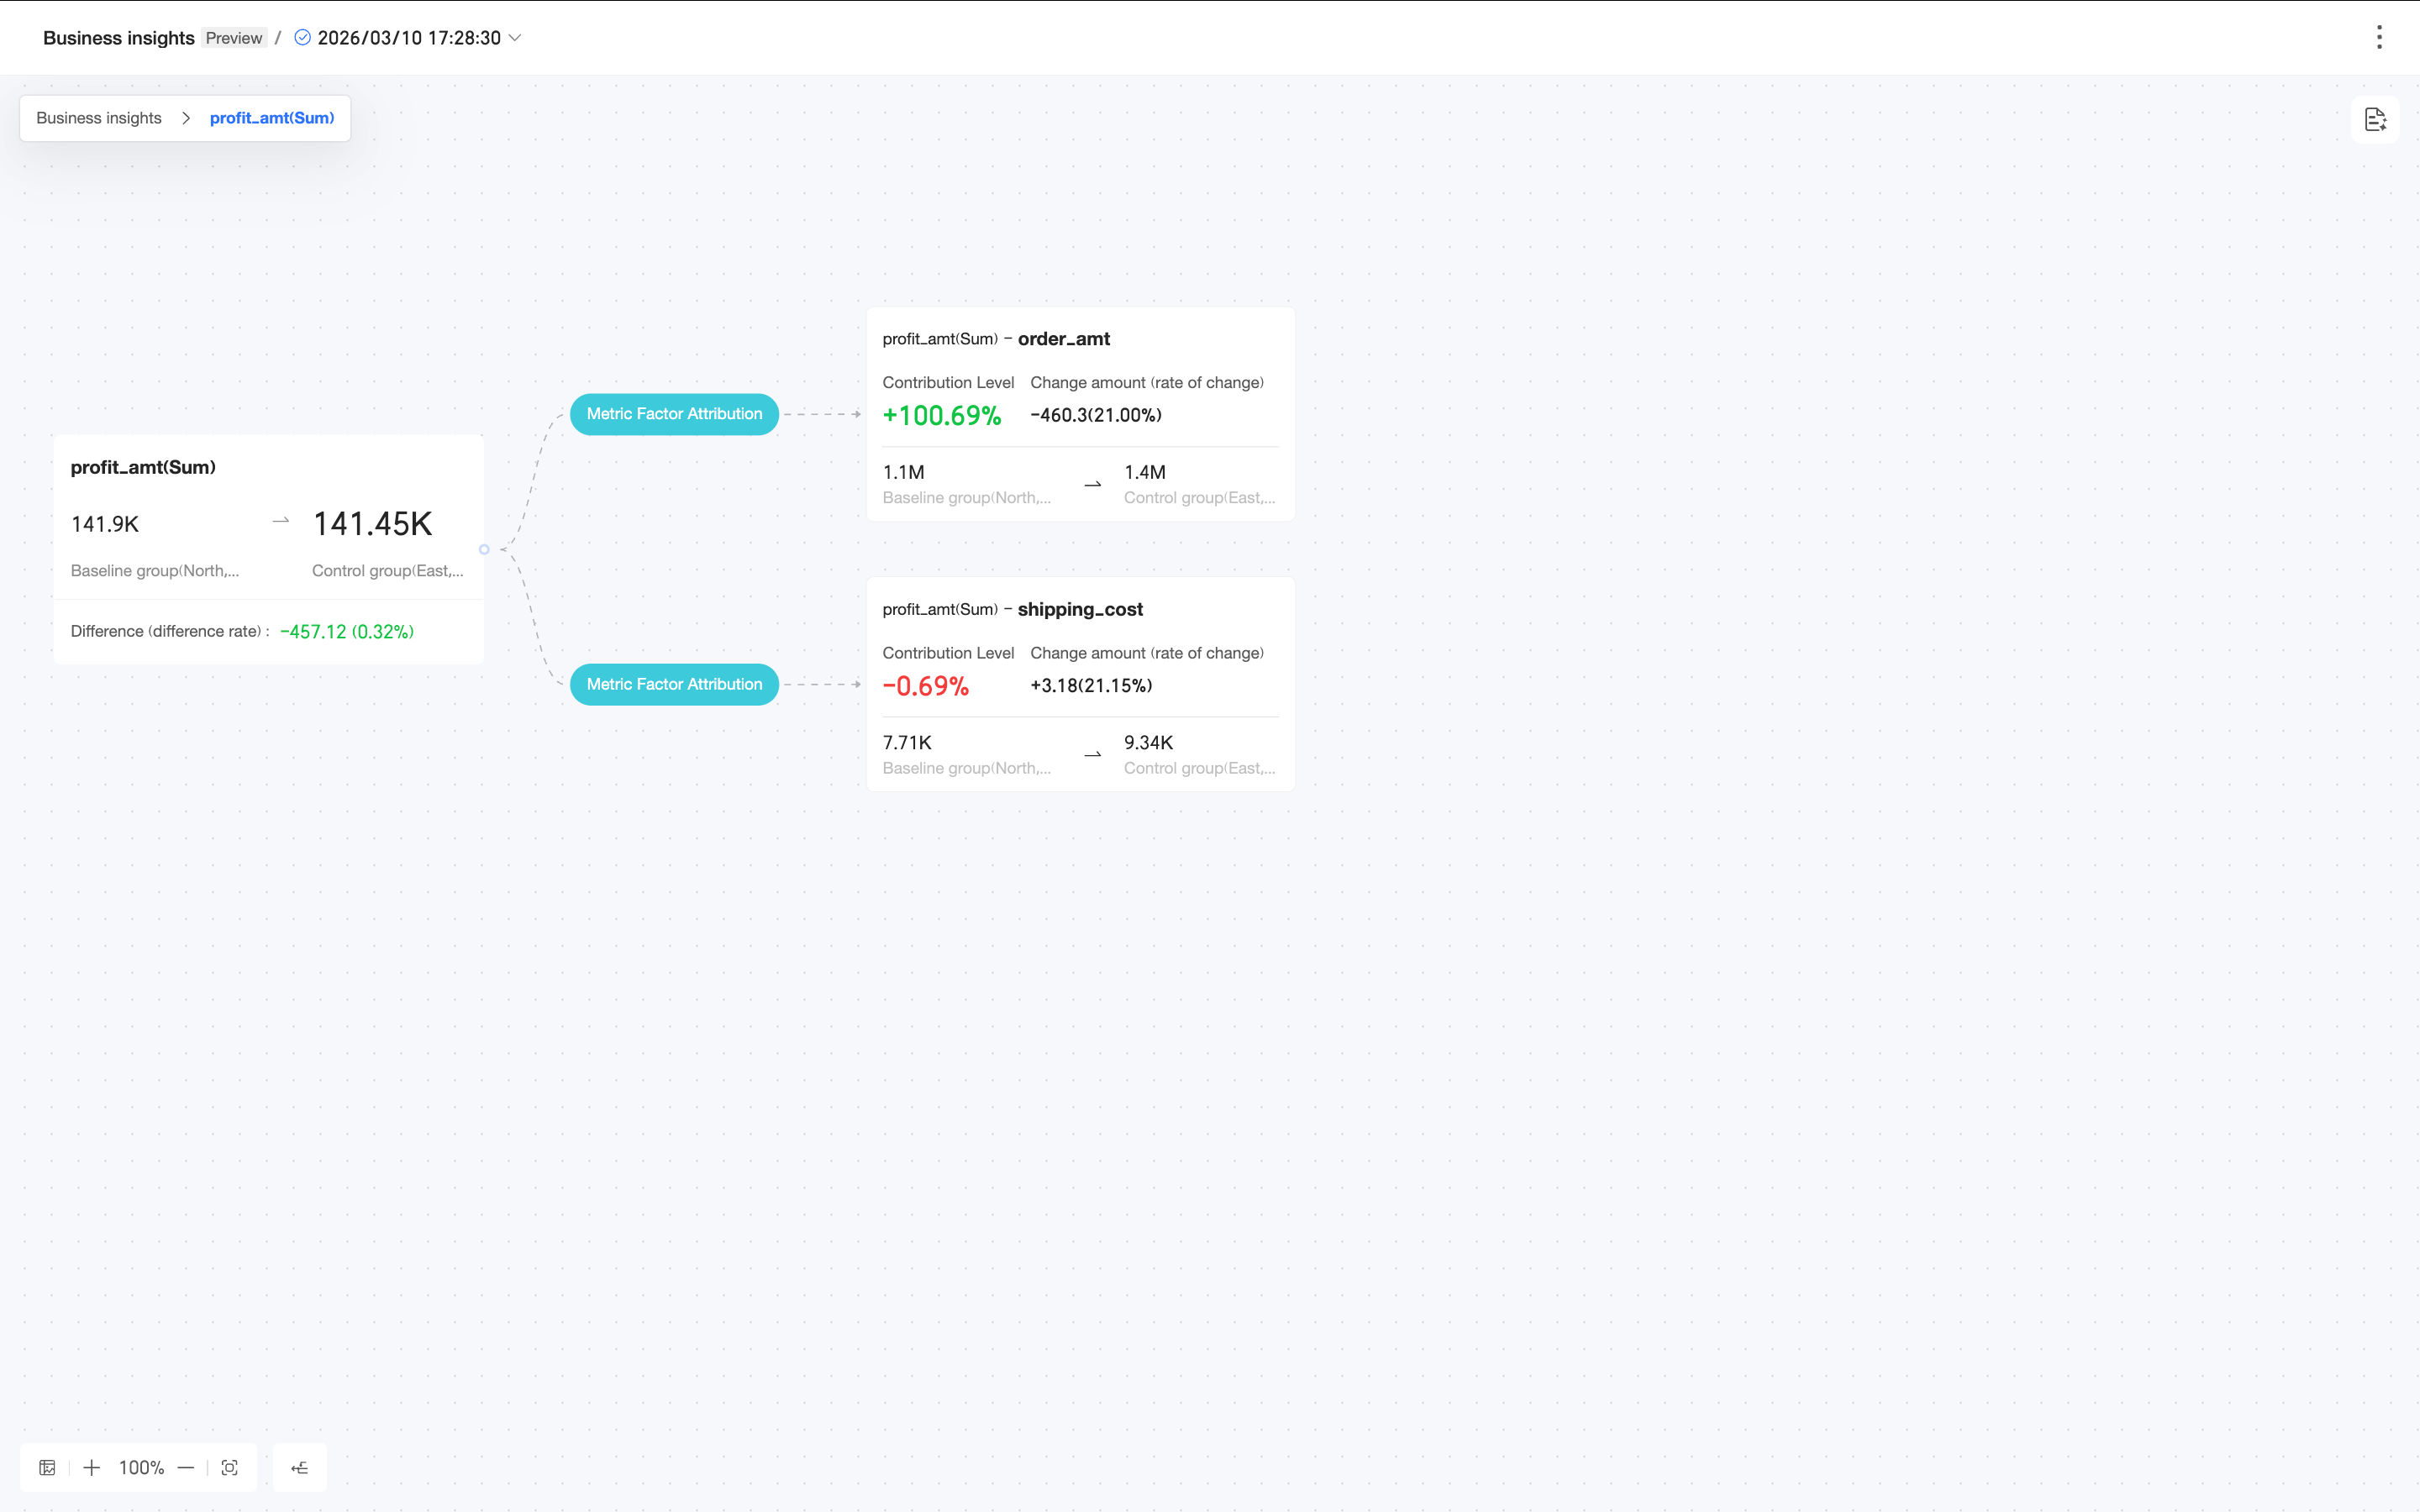
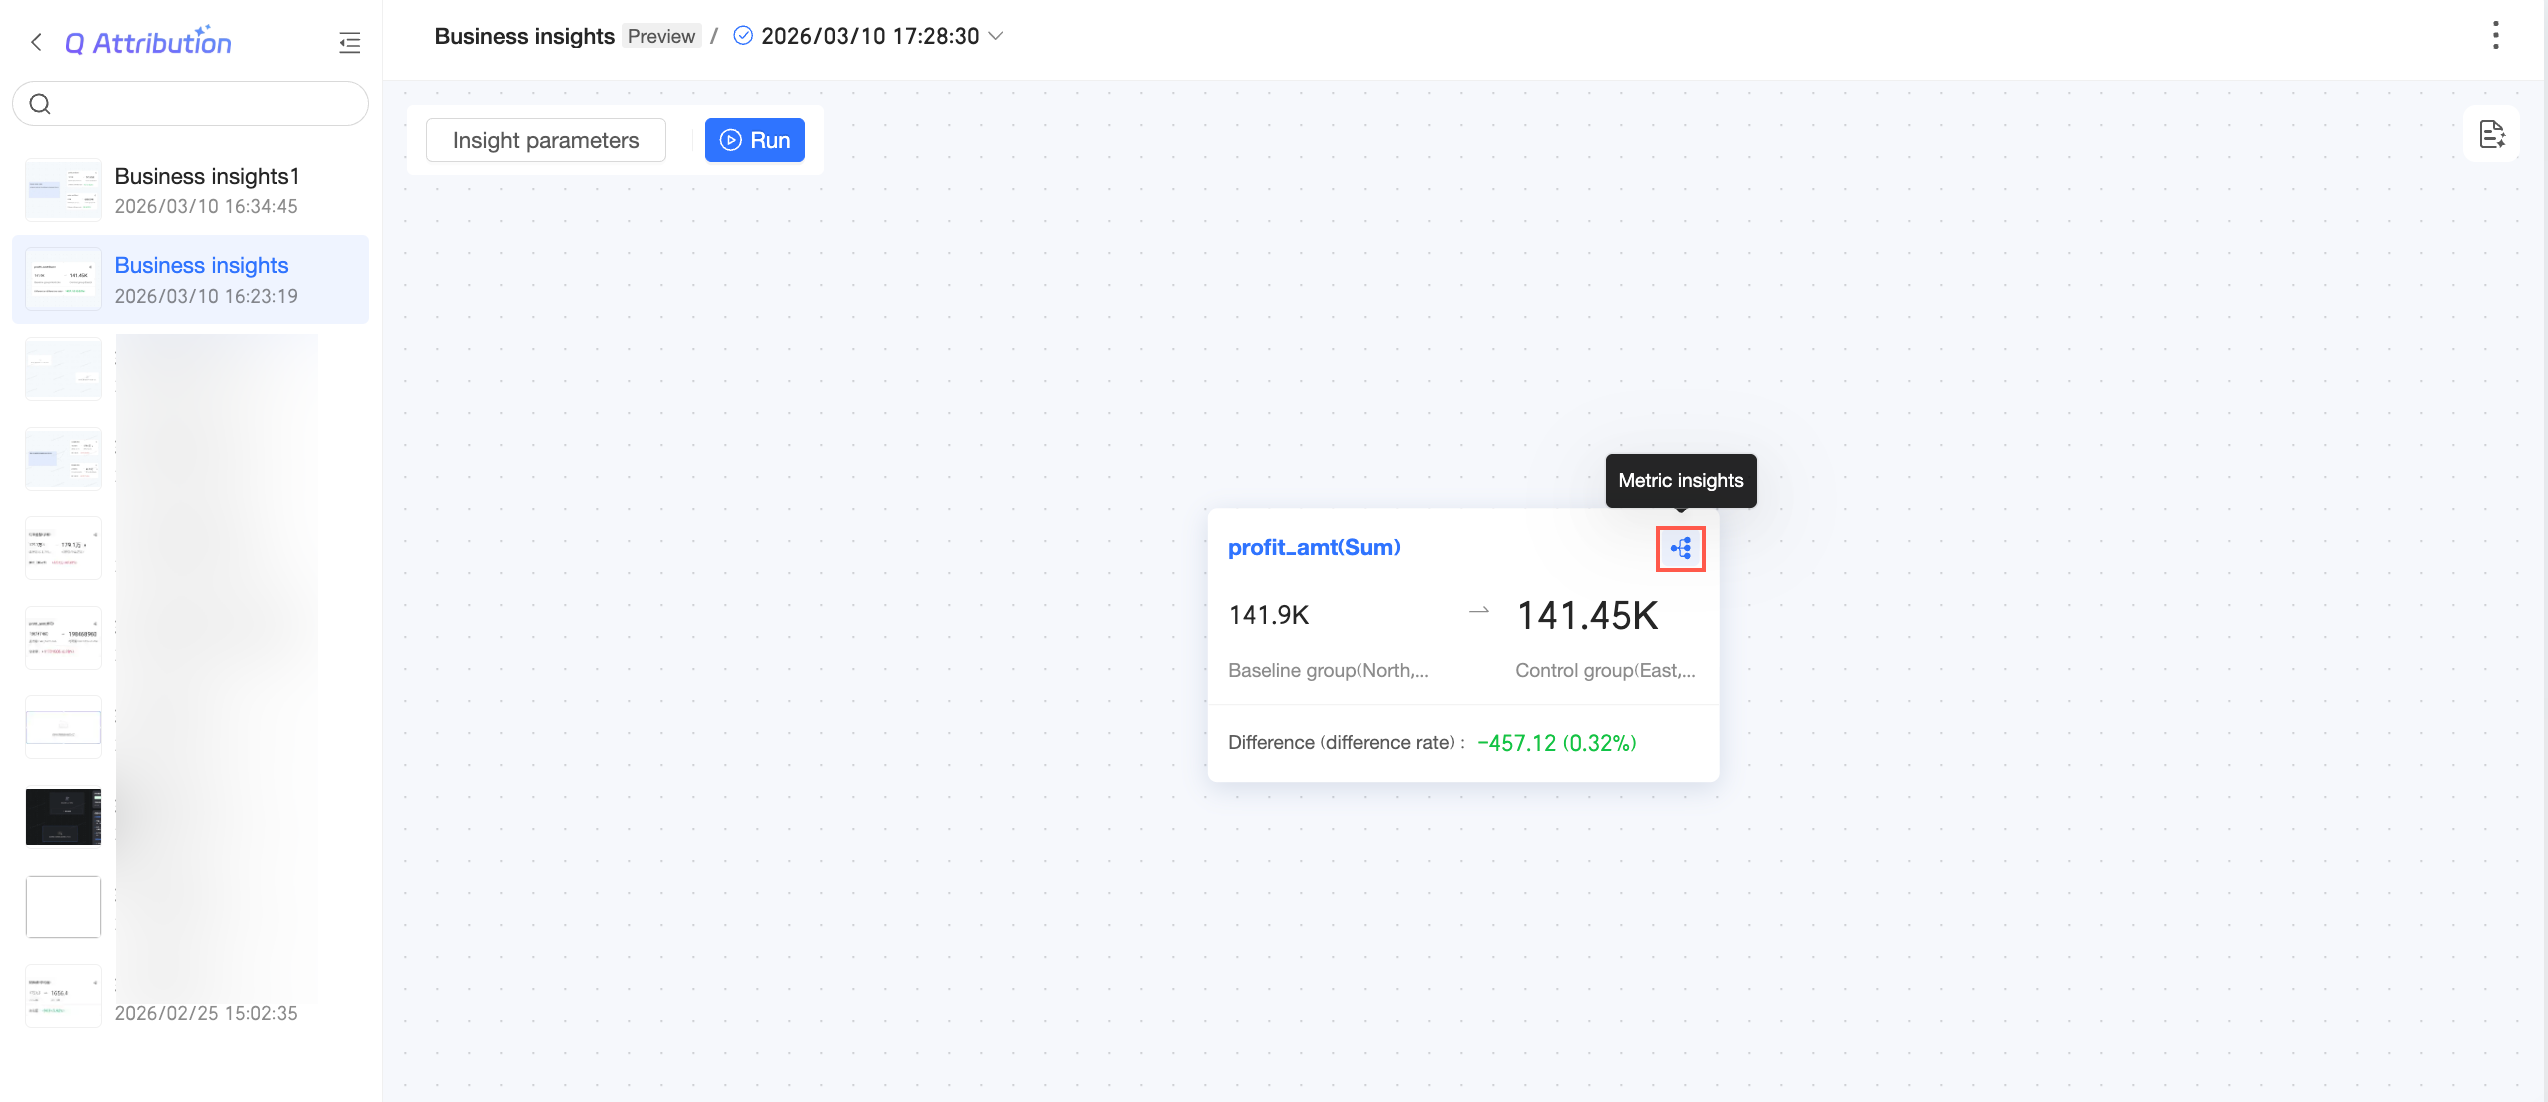
Click the
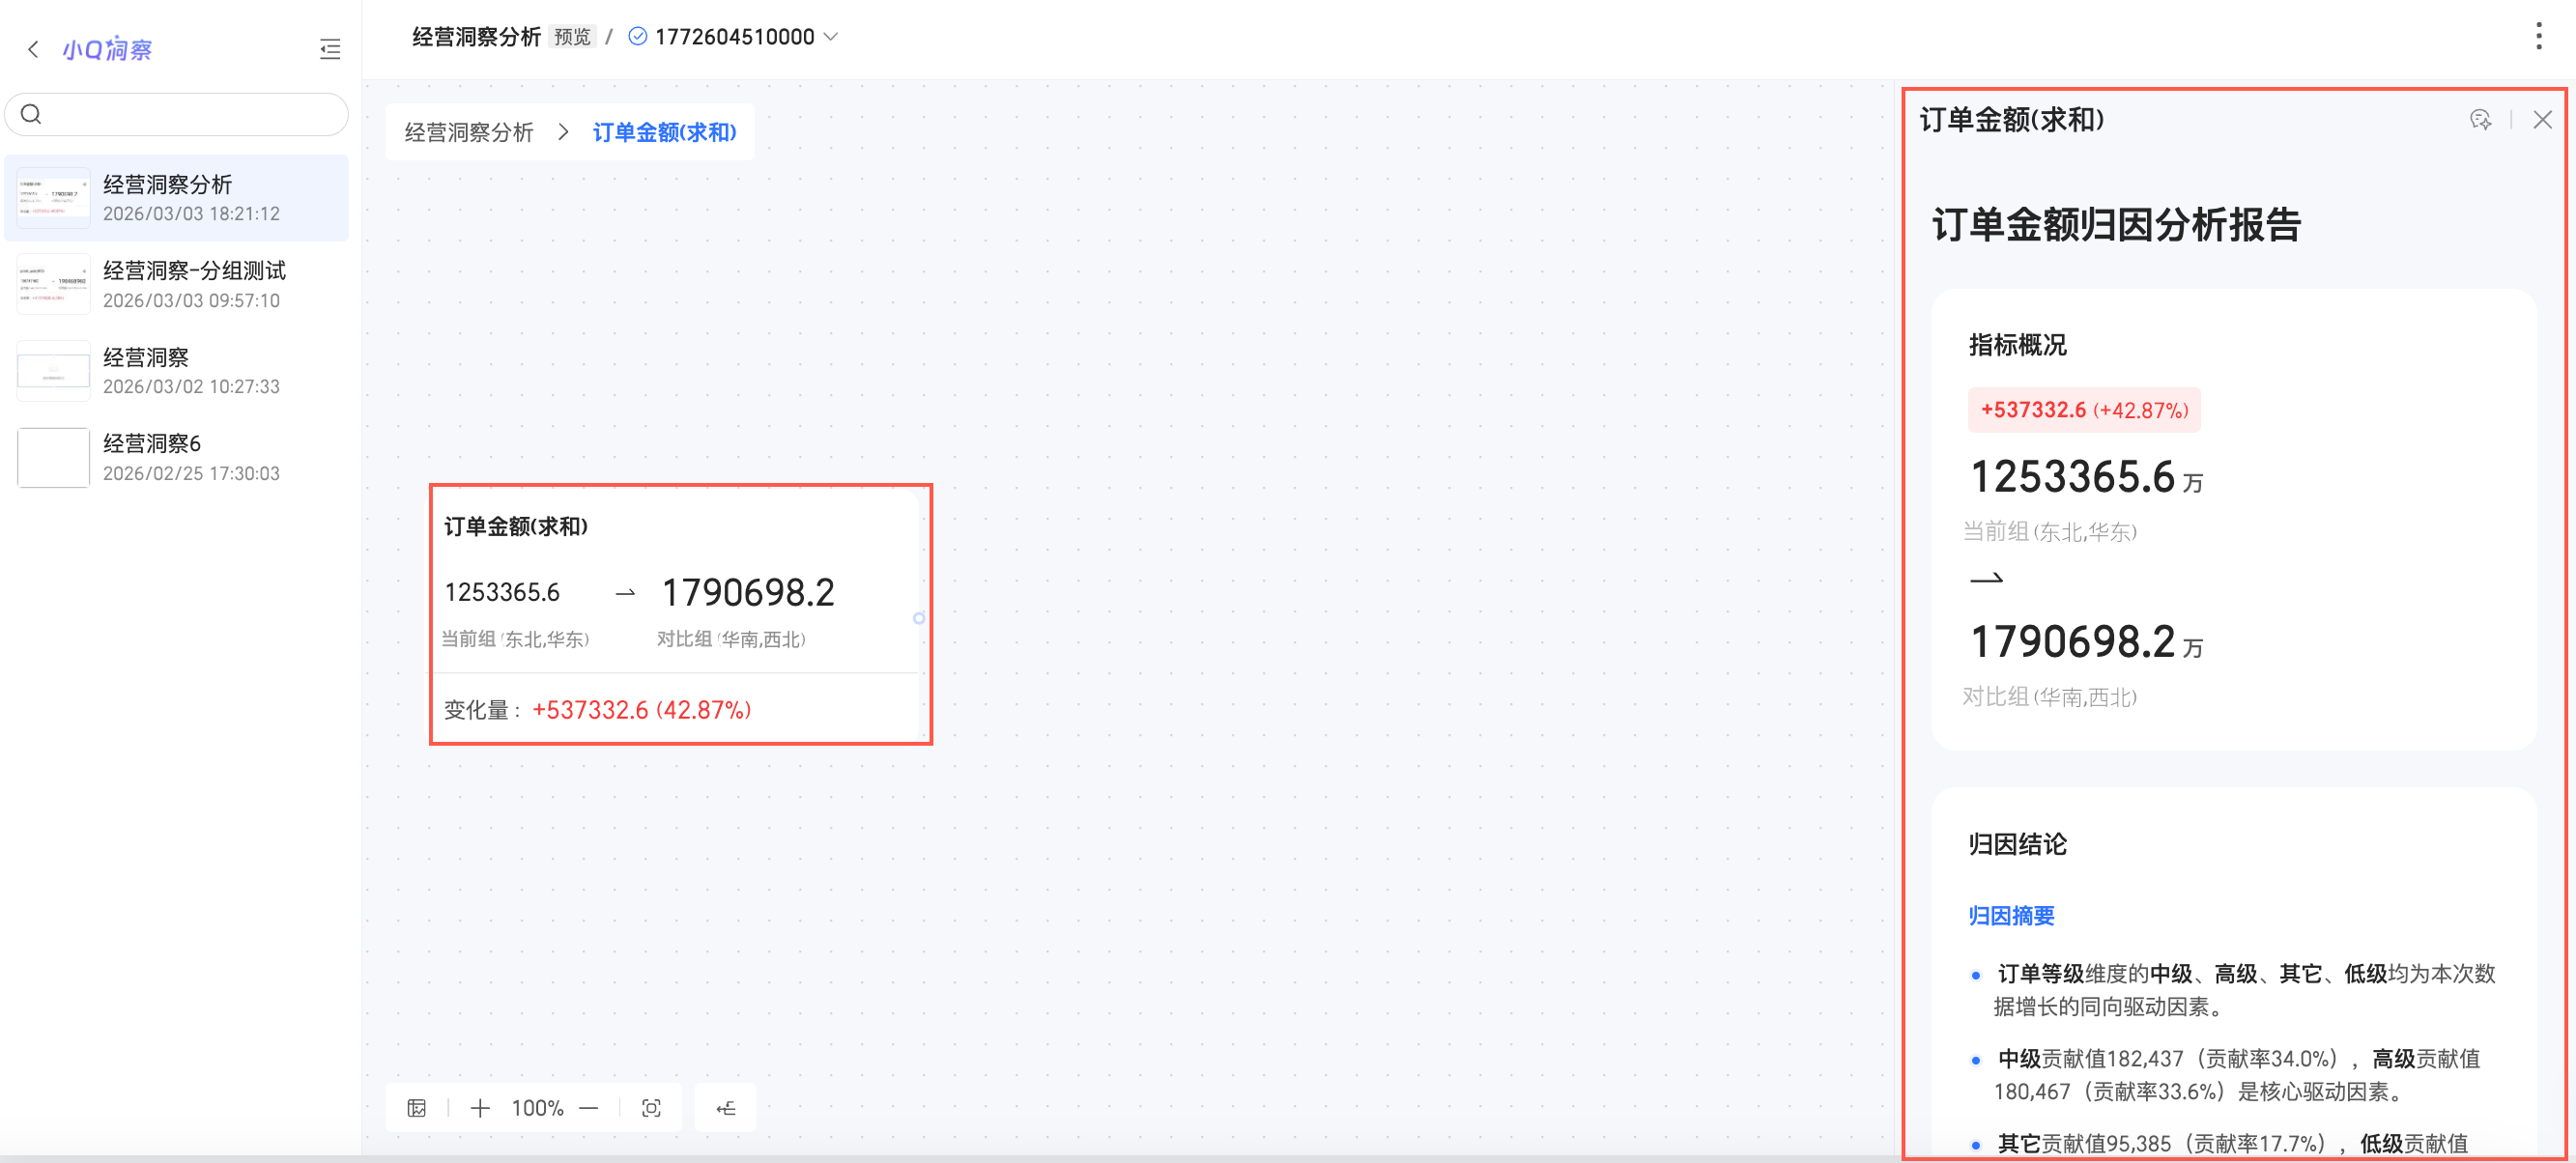
icon to open Metric Insight. You can then view the attribution analysis results for the related metrics. The AI summarizes metric changes (such as why they increased or decreased) and then lists data comparison tables by dimension to help you identify the primary drivers. Above the attribution analysis section, click the icon to view the execution process.Hover over a Metric Insight, click the plus sign (+) on the right, and then select the attribution analysis method and analysis dimensions.
You can then view the data analysis results for the specified analysis dimensions.
 icon to open Metric Insight.
 You can then view the attribution analysis results for the related metrics. The AI summarizes metric changes (such as why they increased or decreased) and then lists data comparison tables by dimension to help you identify the primary drivers.
 Above the attribution analysis section, click the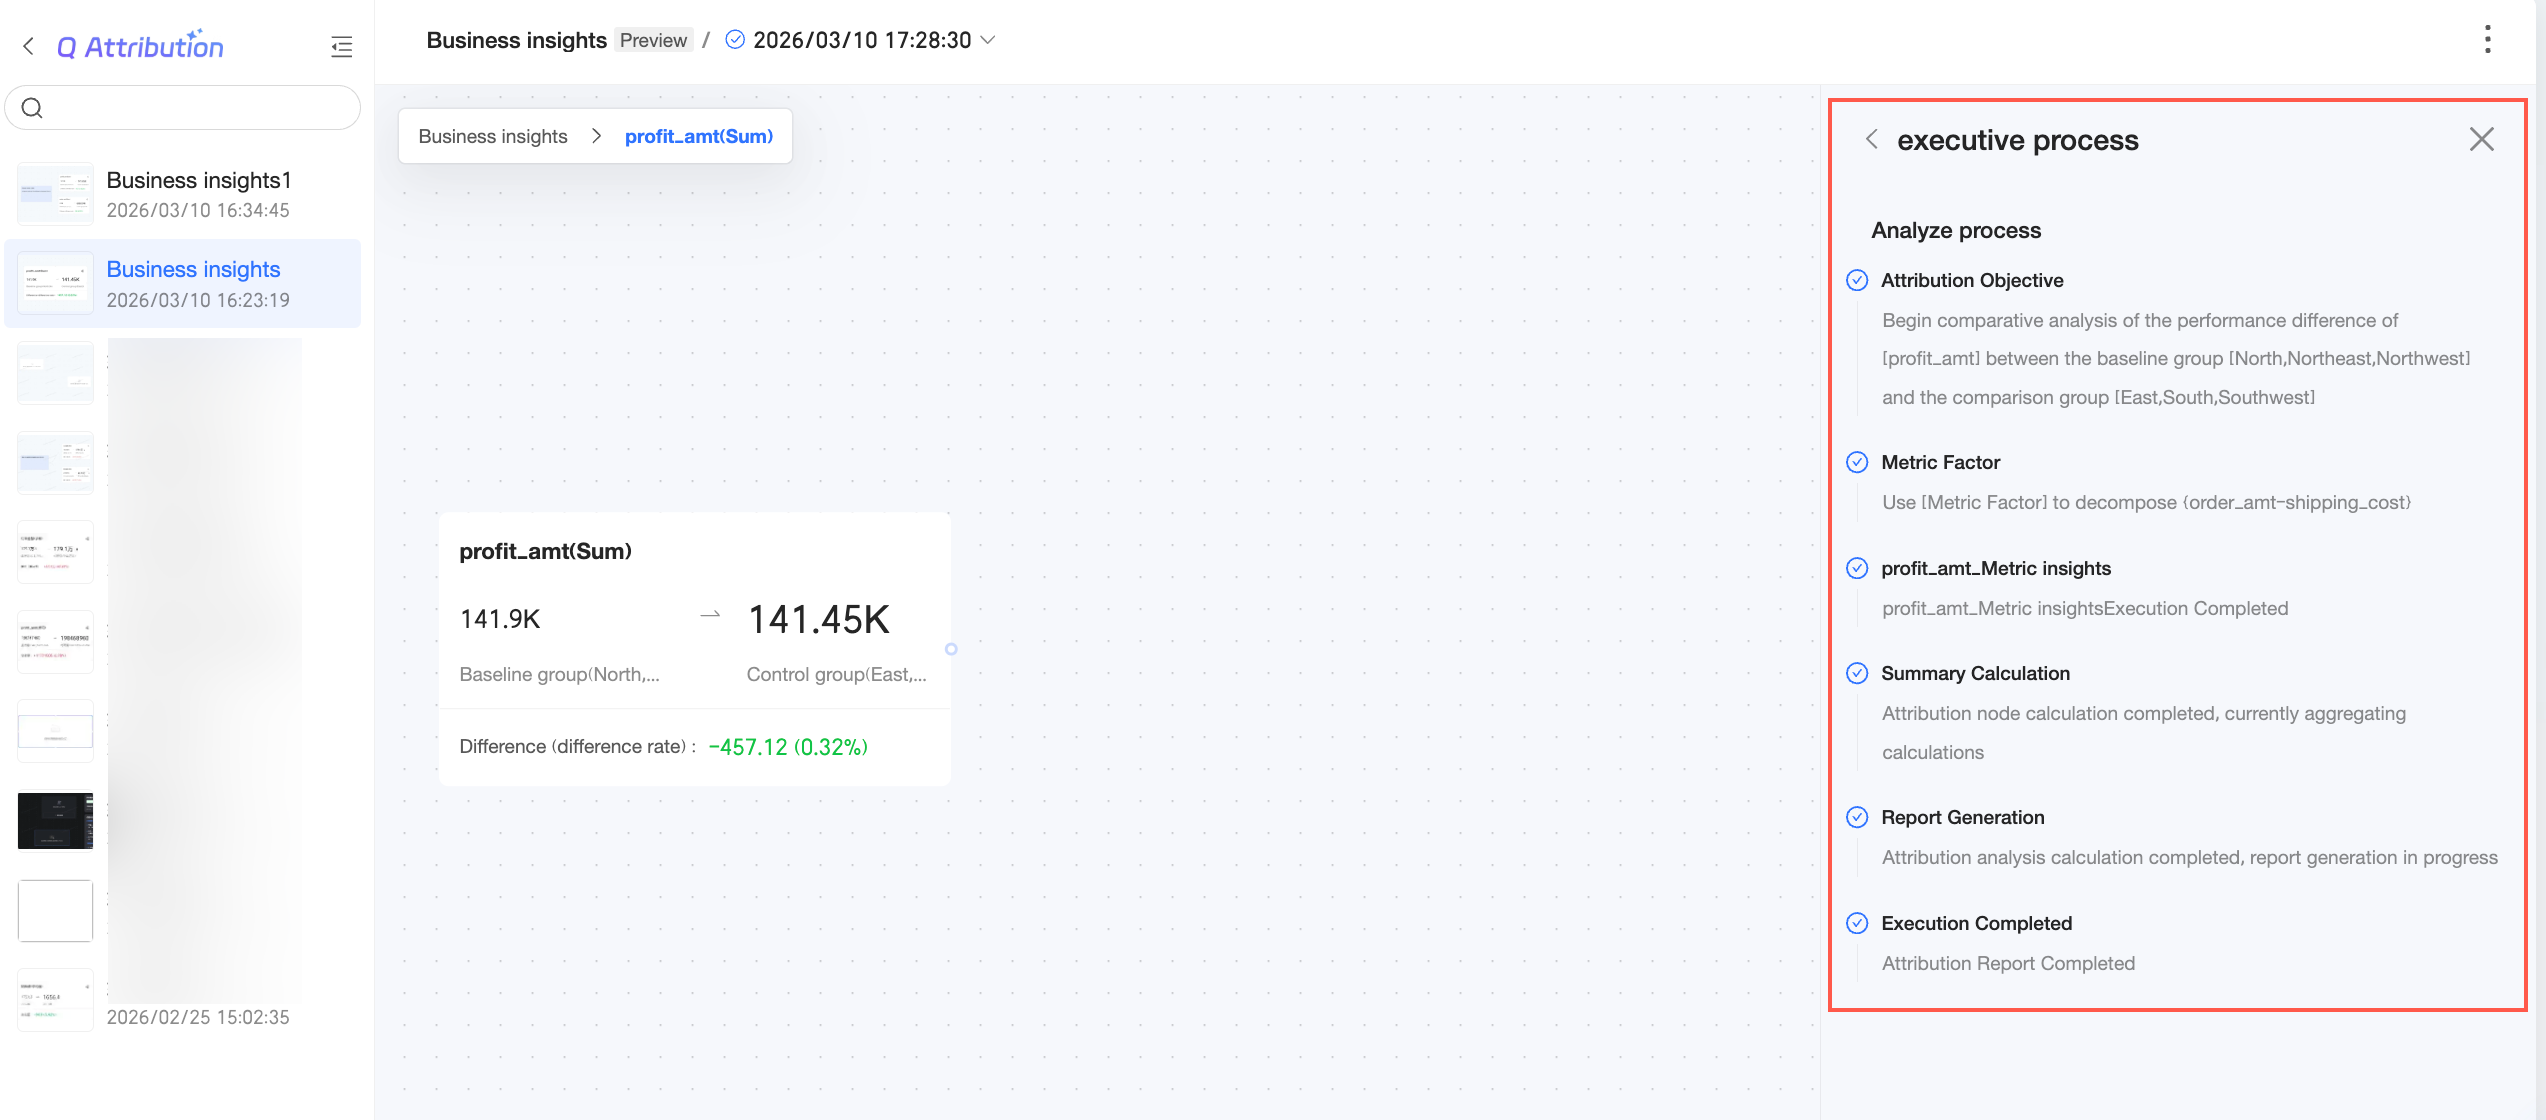
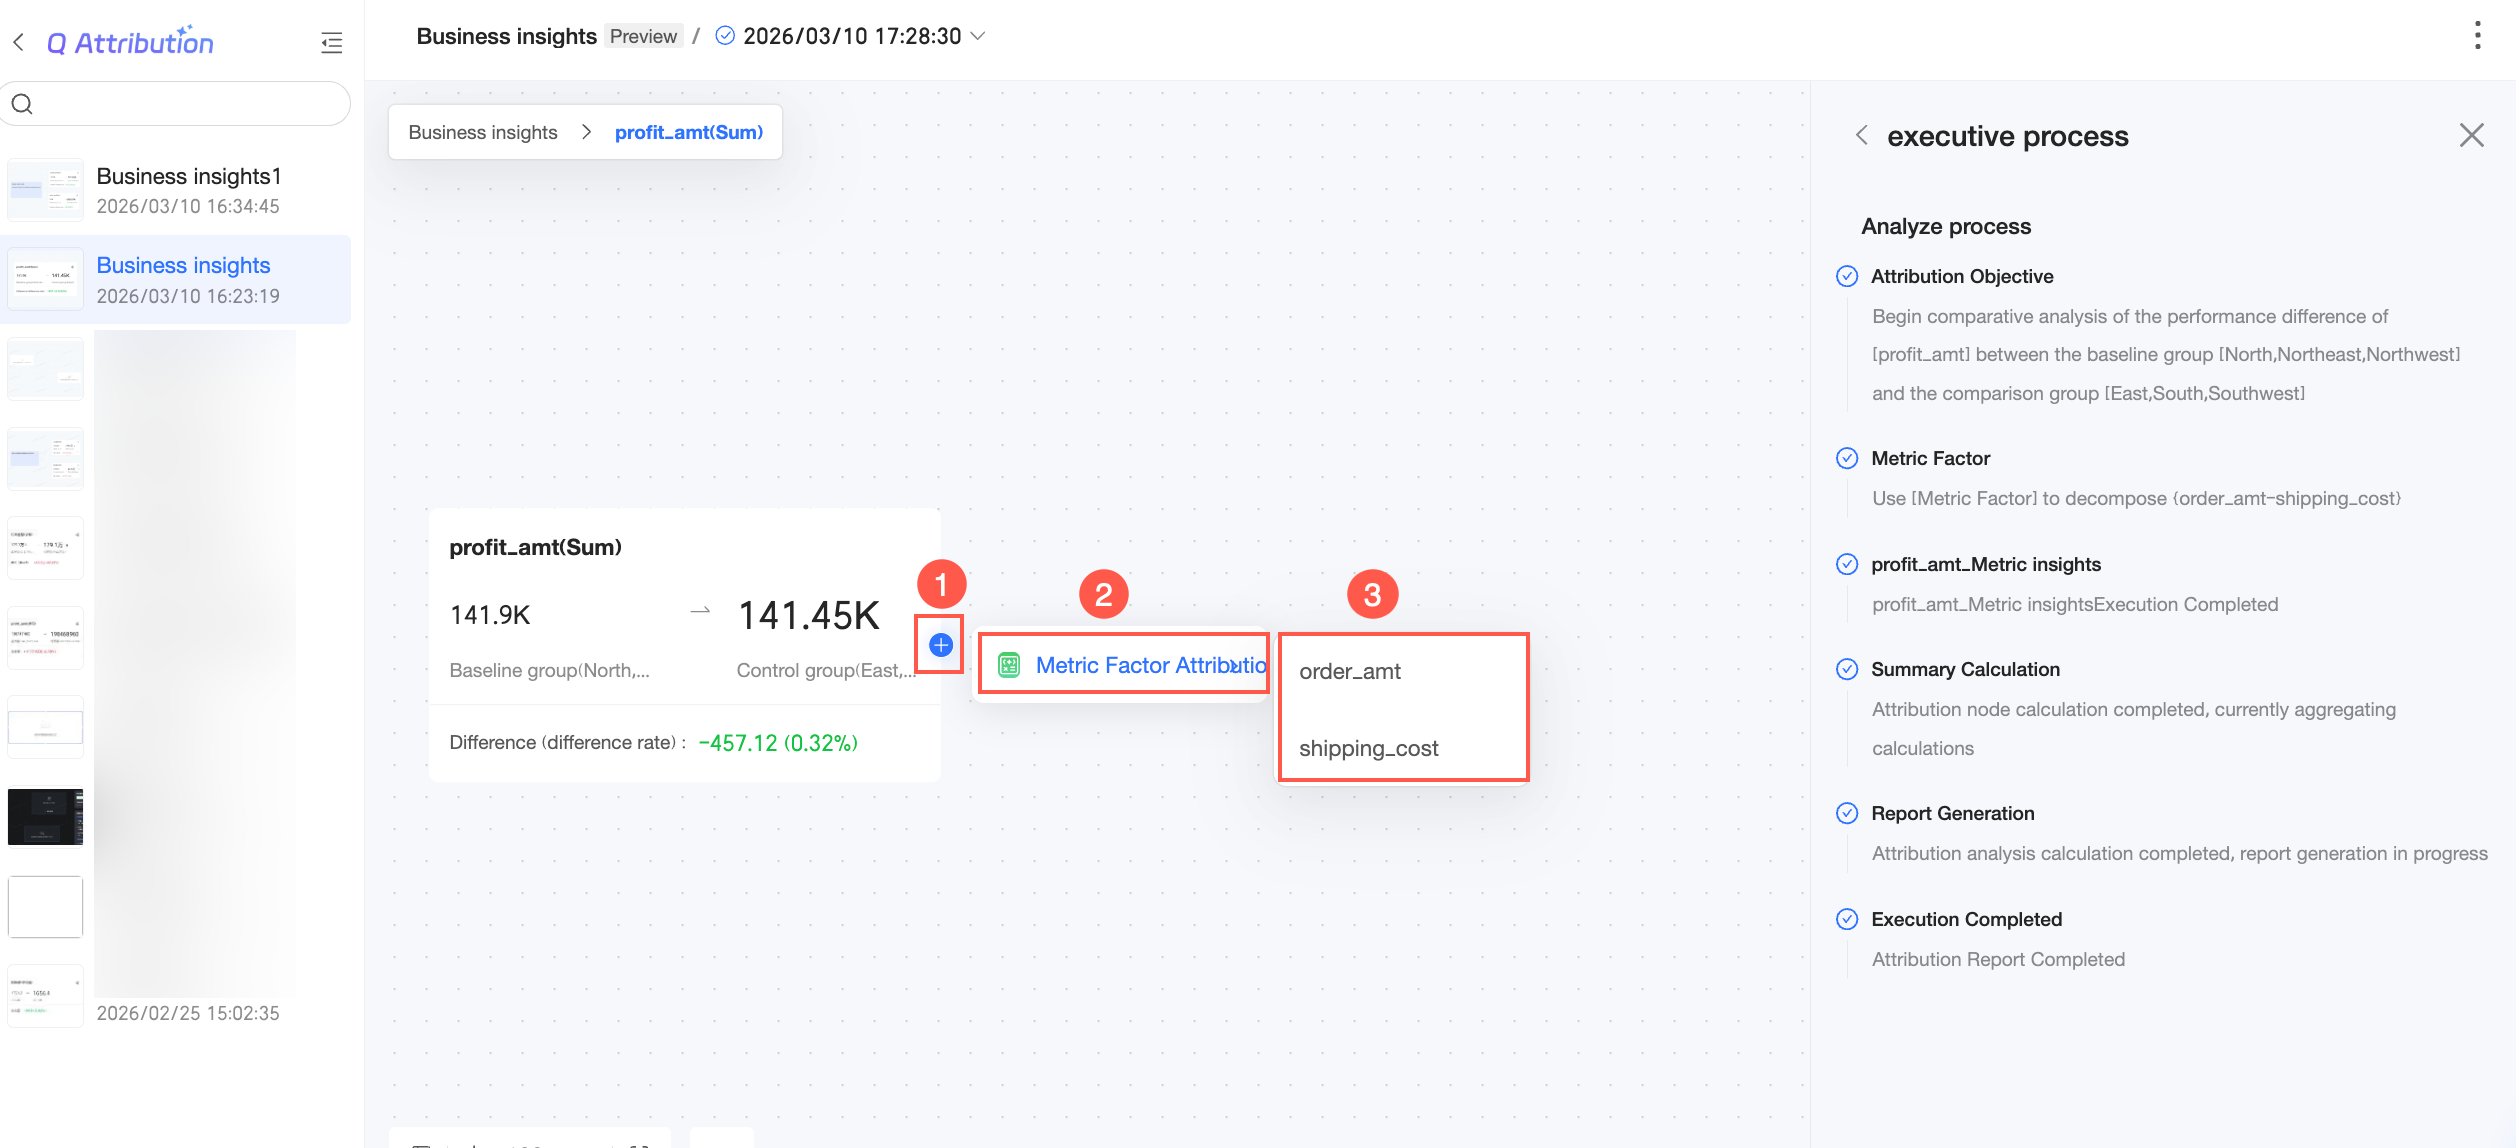 You can then view the data analysis results for the specified analysis dimensions.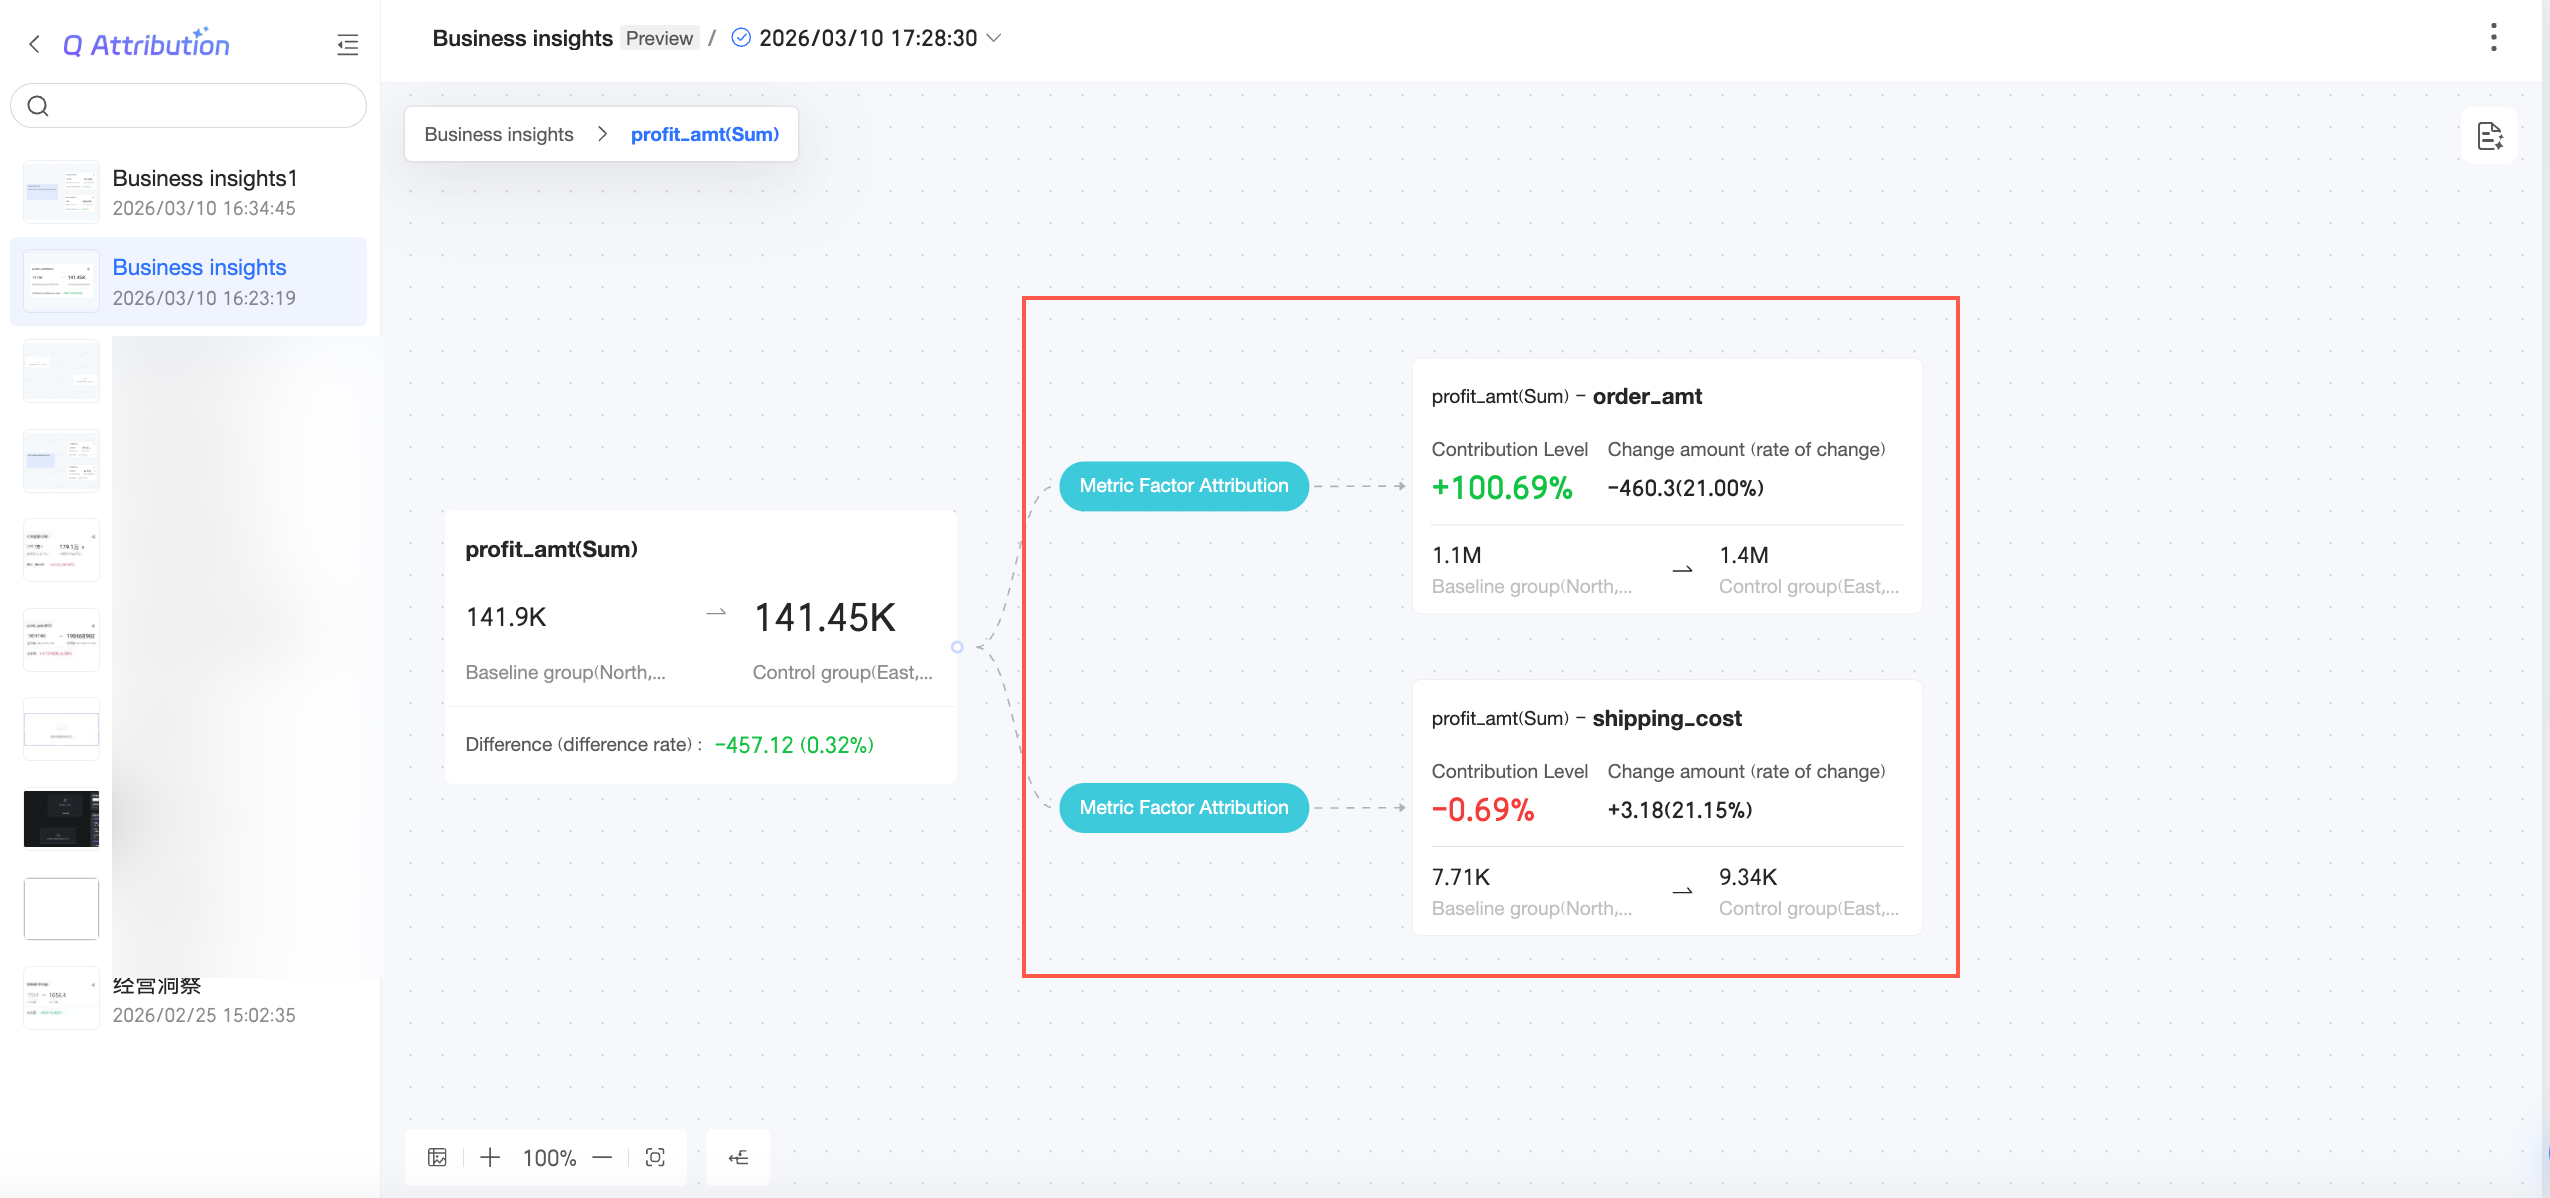
In the upper-right corner, click the
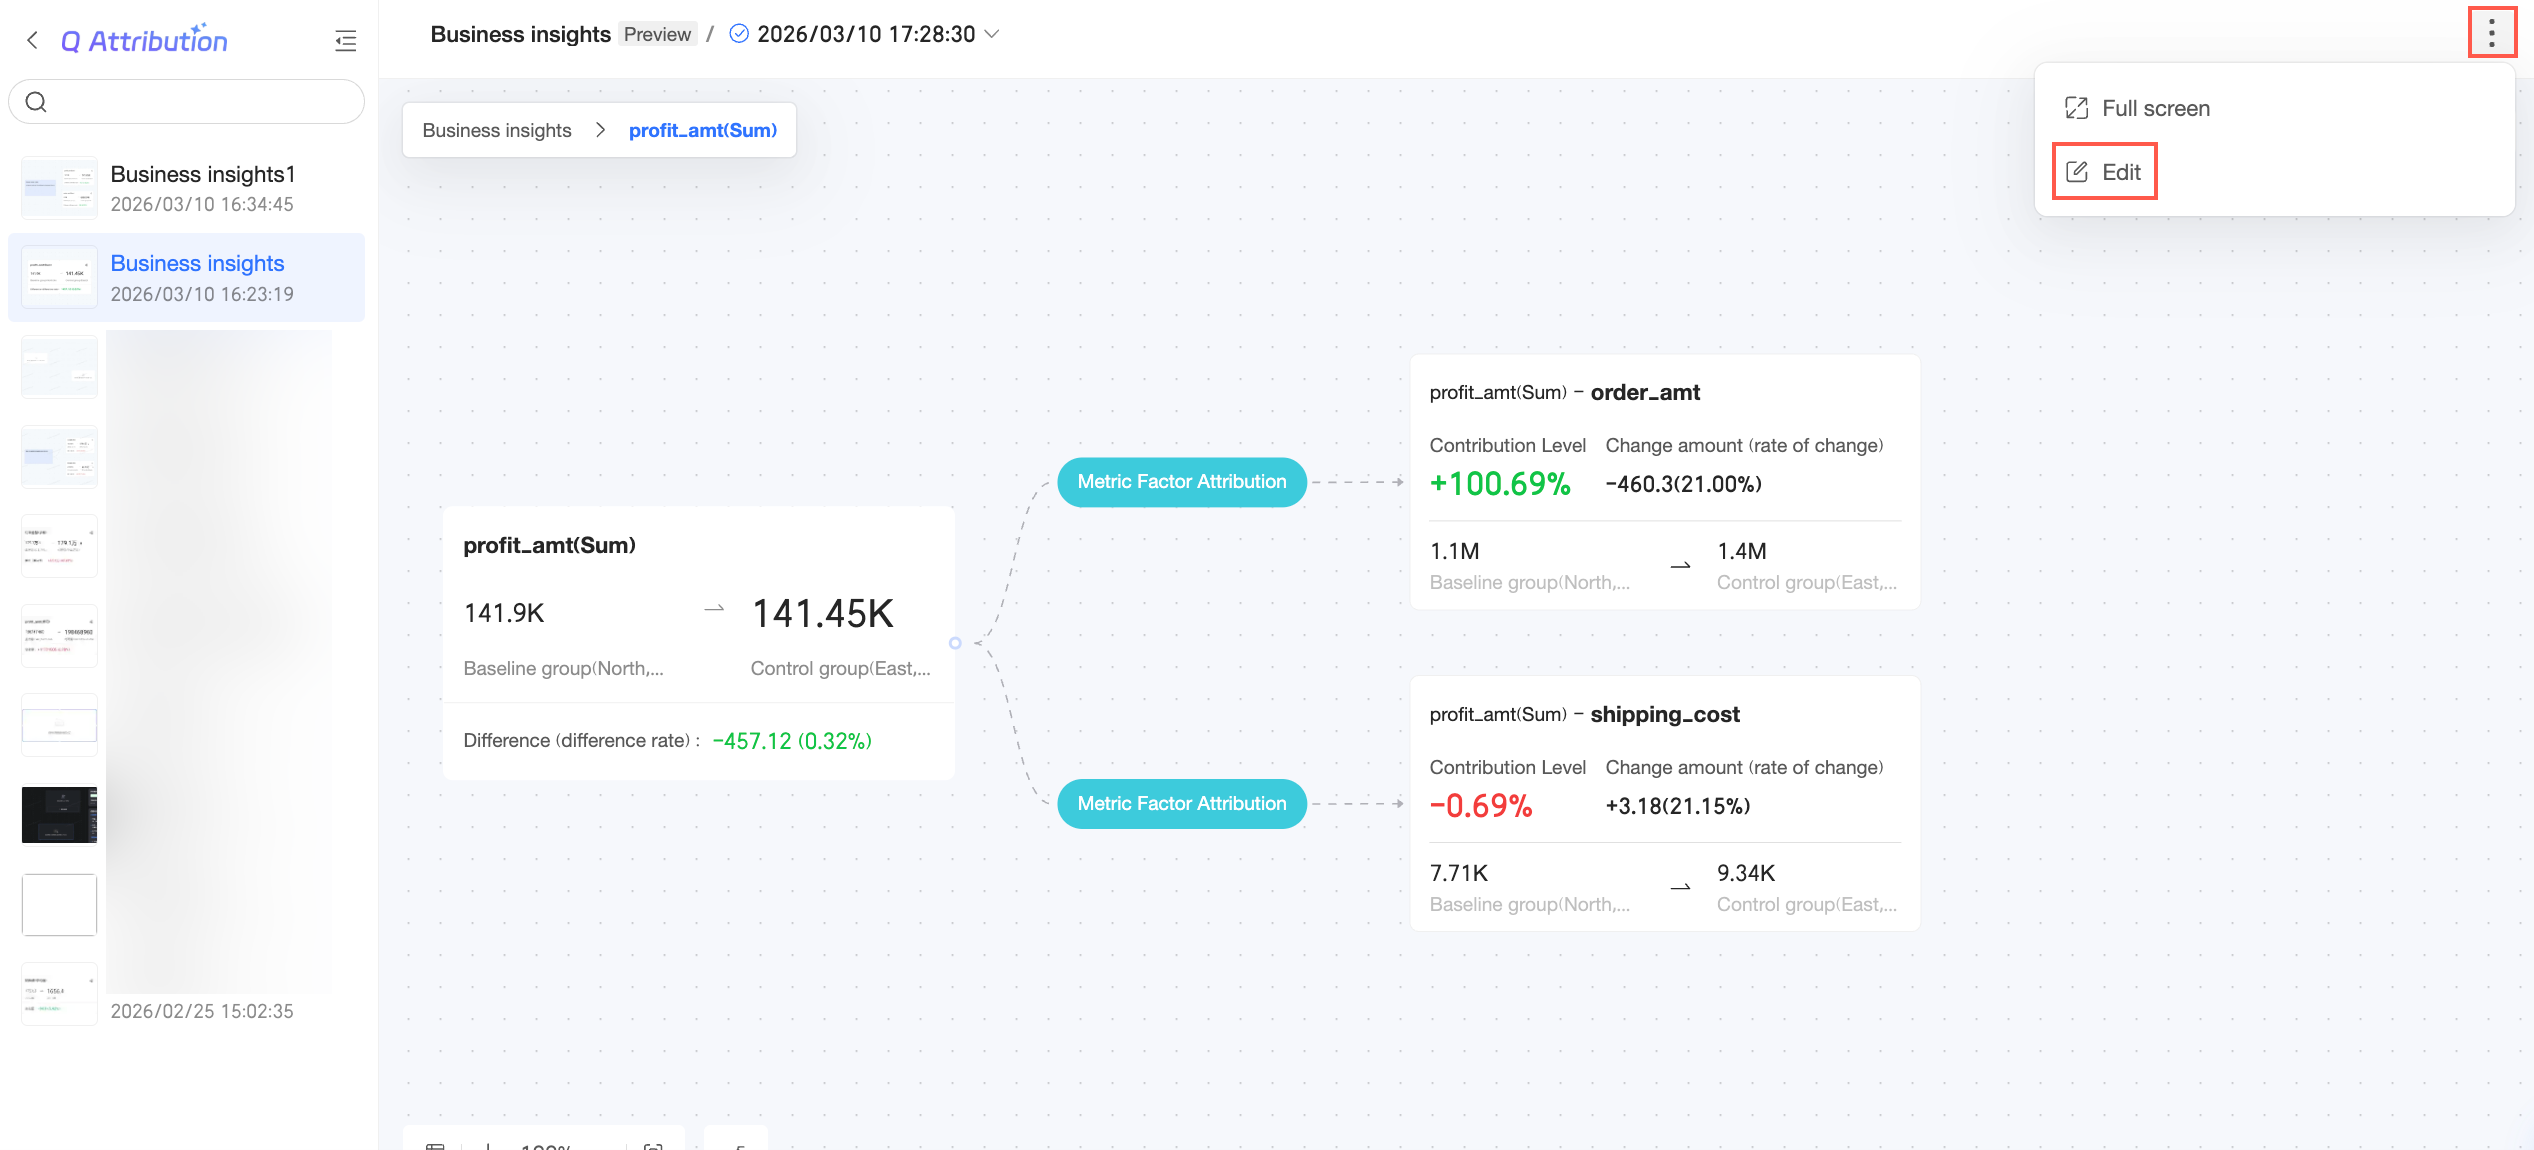
icon and select Full Screen to view the insight in full screen.In the upper-right corner, click the
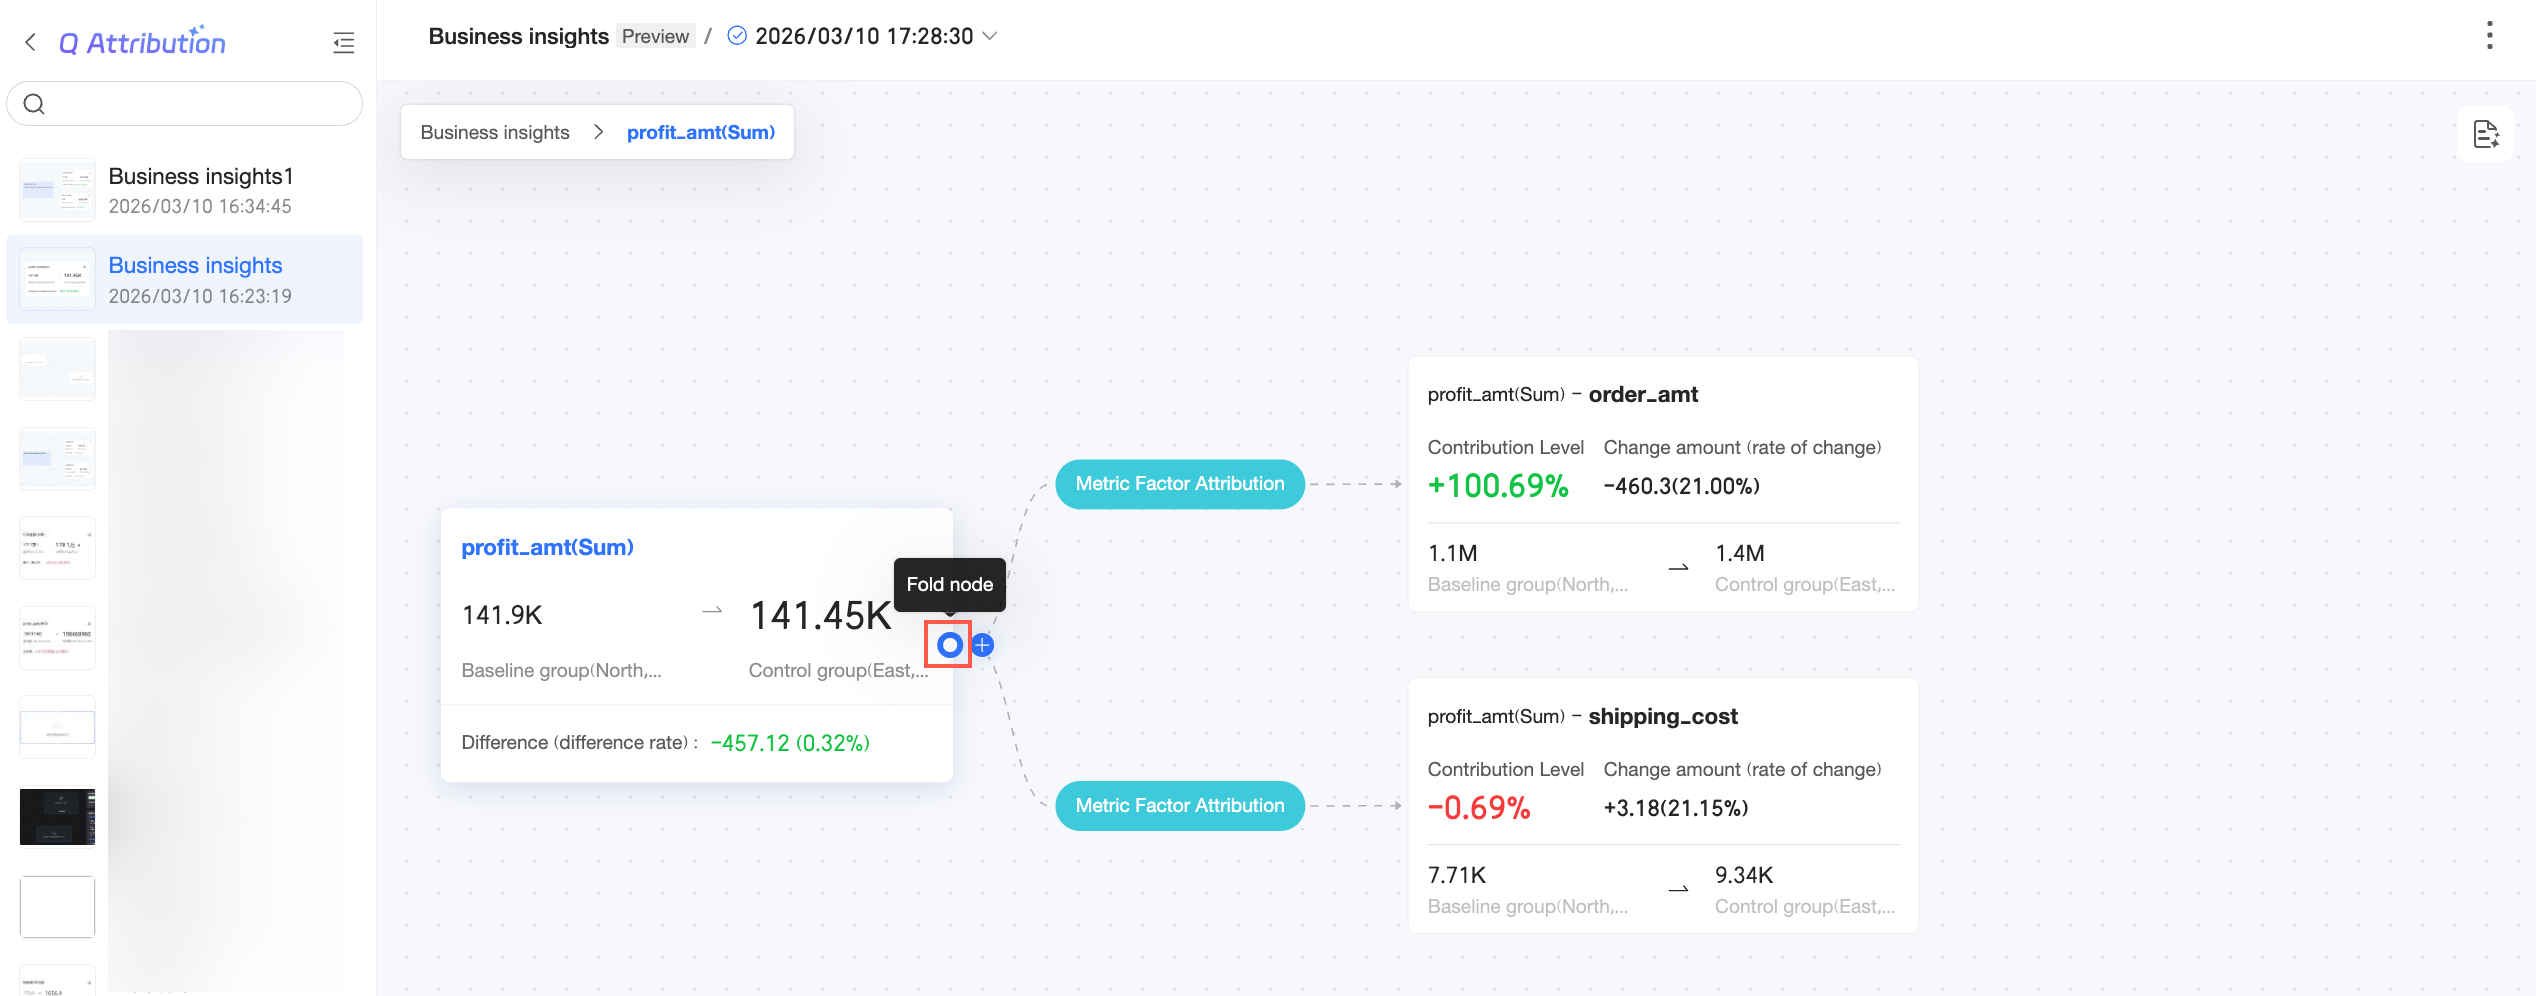
icon and select Edit to open the Metric Insight editing page.You can collapse nodes.
 icon and select Full Screen to view the insight in full screen.