Sustained high CPU utilization can cause slow database responses. This topic describes how to identify the causes of high CPU utilization and resolve the resulting issues.
View CPU utilization
For an RDS for PostgreSQL instance, CPU utilization that stays above 80% usually indicates a high system load and potential performance issues.
On the Monitoring and Alerts page, in the Standard Monitoring section, you can view the CPU utilization information. For more information, see View Standard Monitoring.
Terms
CPU utilization: The percentage of time the CPU is busy. This includes all active clock cycles, such as time spent waiting for I/O. CPU time is divided into kernel time and user time.
User time: The time spent executing code in user mode.
Kernel time: The time spent executing code in system mode. This includes time for system calls, kernel threads, and interrupts.
Context switch: The process of the kernel switching the CPU to work on a different process in a different address space.
Interrupt: A signal sent from a hardware device to the kernel, usually to request an I/O service.
High CPU utilization caused by a high number of scanned rows
Symptom:
On the Monitoring and Alerts page, the Standard Monitoring section shows that CPU utilization and the Row Operation Count are high.
The details for the Rows Operated On metric show a high number of full table scans in the database, which is the main cause of the high CPU utilization.
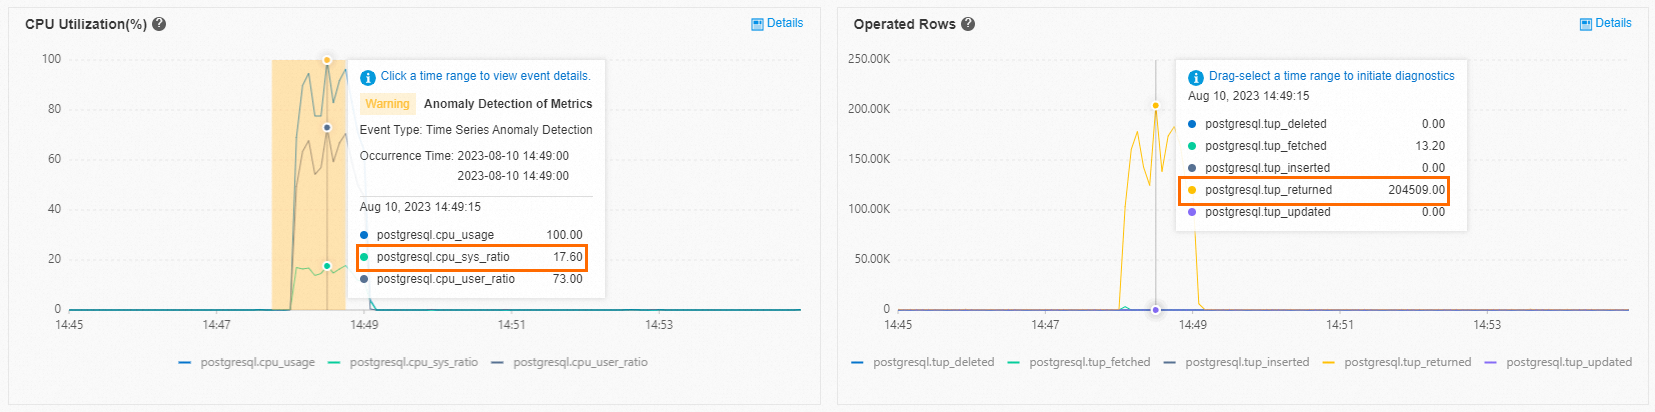 Note
NoteClick the
 icon next to each metric to view its included metrics.
Solution: Use the autonomy service to find and optimize the problematic SQL statement. For more information, see Slow SQL statements in RDS for PostgreSQL.
High CPU utilization caused by a high number of active sessions
Symptom:
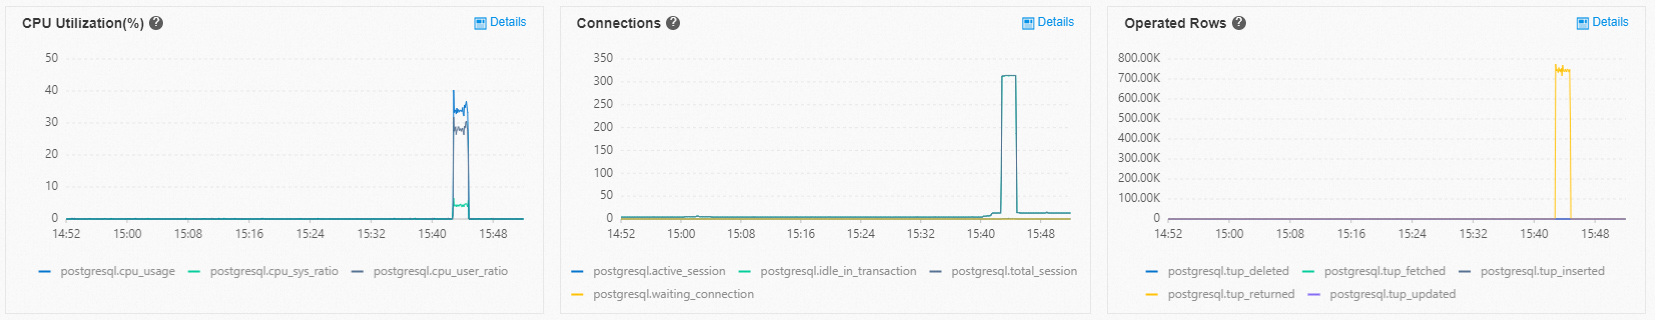
On the Monitoring and Alerts page, the Standard Monitoring section shows high CPU utilization, with system usage reaching 23%. This may indicate a high number of system calls or interrupts.
The Rows Operated On metric shows that the number of full table scans is not high. The Connections metric shows that the number of active sessions has reached 279. The instance in this example has 2 CPU cores and 4 GB of memory. When 279 sessions run at the same time, the CPU frequently performs context switches. This increases kernel time and reduces the time available for executing SQL statements.
NoteNormally, a reasonable number of active sessions is two to three times the number of CPU cores. For example, for an instance with 2 CPU cores and 4 GB of memory, the number of active sessions should be between four and six to achieve the highest CPU efficiency.
 Note
NoteClick the
icon next to each metric to view its included metrics.
Solution: Upgrade the instance type or reduce the number of active sessions to a reasonable level.