Comparison of observability alerting and O&M systems
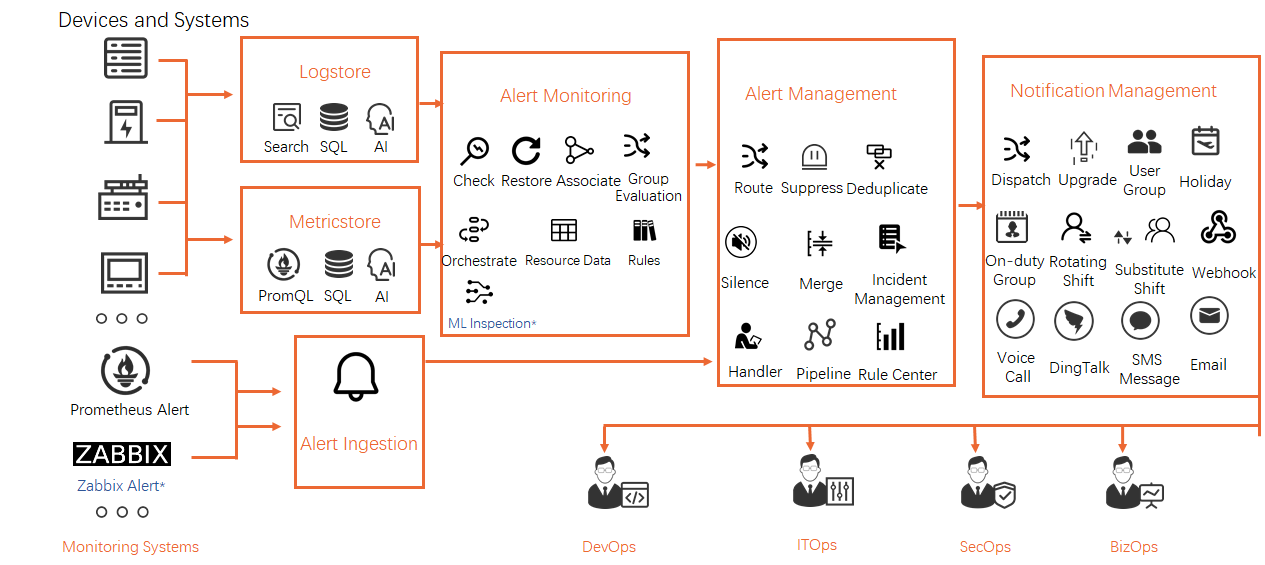
The new alerting feature of Simple Log Service is an all-in-one platform for artificial intelligence for IT operations (AIOps). It combines alerting and monitoring, alert denoising, transaction management, and notification management in a single service. This topic compares the new alerting feature of Simple Log Service with common self-managed open source alerting systems.
Simple Log Service alerting
The new alerting feature of Simple Log Service is an AIOps service that monitors data of various types, such as logs and metrics, and receives alerts from third-party systems. In addition to alerting and monitoring, it provides alert denoising, transaction management, and notification management. It adds more than 40 feature scenarios and covers the alerting, monitoring, and O&M requirements of development, O&M, security, and operations teams. For more information, see What is Simple Log Service alerting?.
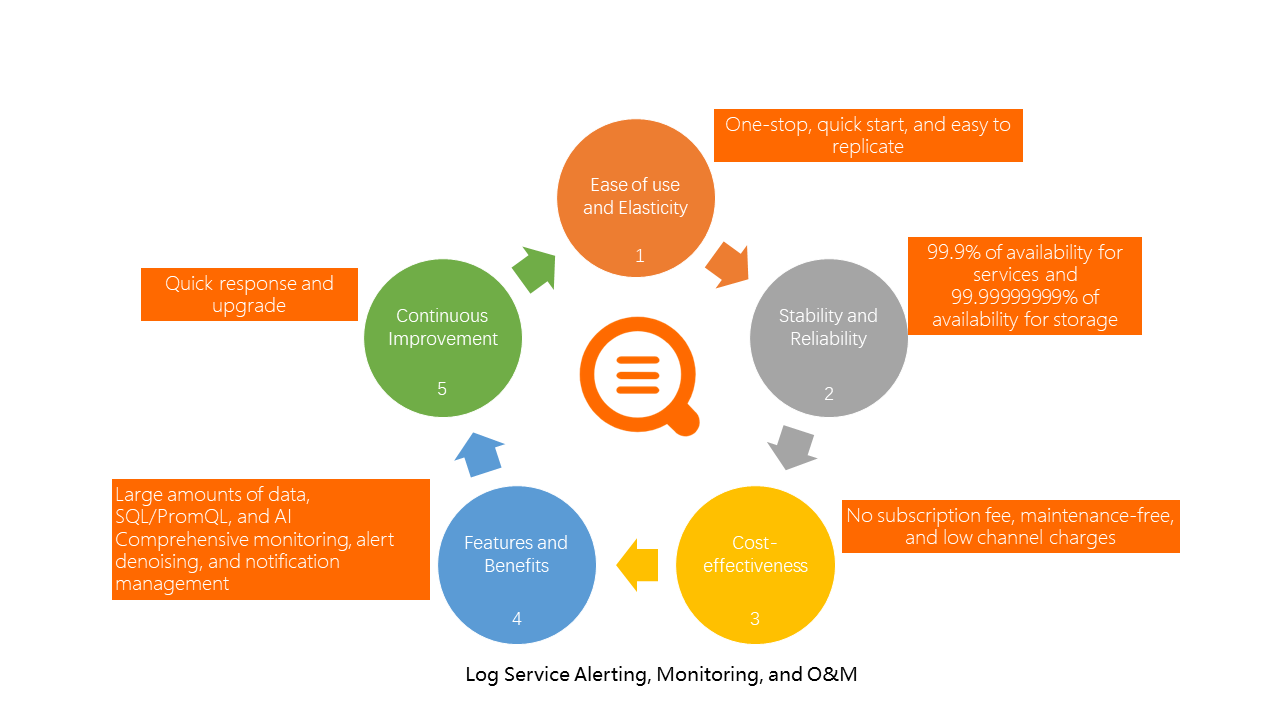
The following figure shows the five main advantages of the new alerting feature of Simple Log Service.
The following sections compare the new alerting feature of Simple Log Service with common self-managed open source alerting stacks. Each comparison uses the same categories: durability, cost, alerting and monitoring, alert management, and notification management. The Simple Log Service alerting column is identical in every comparison table, so you can read only the section for the stack that you are evaluating.
Comparison with ELK X-Pack alerting (Elasticsearch Watcher and Kibana 7.x+ Alert)
A self-managed ELK stack uses the open source combination of Elasticsearch, Logstash, and Kibana, which does not include an alerting feature. To configure alerting for a self-managed ELK stack, you must purchase the commercial X-Pack package. X-Pack provides two alerting features that are independent of each other and cannot interoperate: Elasticsearch Watcher and Kibana 7.x+ Alert.
| Category | Item | Simple Log Service alerting | ELK X-Pack alerting |
| Durability | Availability of the alerting feature | Service availability of more than 99.9% and storage durability of more than 99.99999999%. | The commercial edition is distributed. Data storage requires manual configuration. |
| Cost | Fees | No subscription fees. Fully managed. Monitoring and alert management are free of charge. Among notification channels, only text message and Voice Service notifications incur a small per-message fee. | Subscription fees for the commercial edition, manual O&M costs, costs for self-purchased hardware, and third-party fees for text message and voice call notifications. |
| Alerting and monitoring | Scale of monitored logs and metrics | Petabyte-scale. | Terabyte-scale. |
| Alerting and monitoring | Query and analysis syntax for monitoring | Supports SQL-92 syntax (including extensions), Prometheus Query Language (PromQL) syntax, and extended alerting syntax. |
|
| Alerting and monitoring | Machine learning capabilities | Supports more than 10 AI algorithms, such as prediction, outlier detection, and root cause analysis. | Supports X-Pack ML algorithms. |
| Alerting and monitoring | Data collaboration capabilities | Supports collaborative monitoring across data stores, projects, regions, and accounts. | Supports merged analysis of identically structured indexes within the same cluster. |
| Alerting and monitoring | No-data alerts | Supported. | Not supported. |
| Alerting and monitoring | Alert recovery | Supported. | Not supported. |
| Alerting and monitoring | Tags and annotations | Supported. | Kibana 7.x+ Alert supports custom tags. |
| Alerting and monitoring | Dynamic severity | Supported. | Not supported. |
| Alerting and monitoring | Evaluation by group | Supported. You can customize the configuration. |
|
| Alerting and monitoring | Monitoring-side control |
| Elasticsearch Watcher supports pausing and resuming monitoring based on acknowledgments (ACKs). |
| Alert management | Alert denoising and transaction management |
| Not supported. |
| Notification management | Notification capabilities | Supports dynamic notification channel dispatch, alert escalation, recipient group management, notification channel calendar settings, on-call schedule settings, and notification channel quota control. | Not supported. |
| Notification management | Common channels | Supports notification channels such as text message, Voice Service, DingTalk, email, WebHook, and Alibaba Cloud Message Center. You can also integrate channels such as WeCom, Lark, and Slack through WebHook. | Supports notification channels such as email and WebHook. Does not support text message or voice call channels.
|
Comparison with Prometheus and Loki 2.0 alerting (including AlertManager)
A self-managed Prometheus and Loki system uses the open source combination of Prometheus, Loki, and AlertManager to build an alerting and monitoring system. Prometheus alerts on metrics, and Loki alerts on logs. Both send their alerts to AlertManager for centralized management.
| Category | Item | Simple Log Service alerting | Prometheus and Loki 2.0 alerting |
| Durability | Availability of the alerting feature | Service availability of more than 99.9% and storage durability of more than 99.99999999%. | Some services are distributed, and others provide only single-node availability. Storage provides single-node availability. |
| Cost | Fees | No subscription fees. Fully managed. Monitoring and alert management are free of charge. Among notification channels, only text message and Voice Service notifications incur a small per-message fee. | Manual O&M costs, costs for self-purchased hardware, and third-party fees for text message and voice call notifications. |
| Alerting and monitoring | Scale of monitored logs and metrics | Petabyte-scale. |
|
| Alerting and monitoring | Query and analysis syntax for monitoring | Supports SQL-92 syntax (including extensions), Prometheus Query Language (PromQL) syntax, and extended alerting syntax. |
|
| Alerting and monitoring | Machine learning capabilities | Supports more than 10 AI algorithms, such as prediction, outlier detection, and root cause analysis. | Not supported. |
| Alerting and monitoring | Data collaboration capabilities | Supports collaborative monitoring across data stores, projects, regions, and accounts. | Supports cross-metric PromQL joins within the same cluster. |
| Alerting and monitoring | No-data alerts | Supported. | Not supported. |
| Alerting and monitoring | Alert recovery | Supported. | Supported. |
| Alerting and monitoring | Tags and annotations | Supported. | Supported. |
| Alerting and monitoring | Dynamic severity | Supported. | Not supported. |
| Alerting and monitoring | Evaluation by group | Supported. You can customize the configuration. | Supports fixed grouping by label. |
| Alerting and monitoring | Monitoring-side control |
| Supports setting a sustained threshold. Does not support pausing or resuming monitoring. |
| Alert management | Alert denoising and transaction management |
| Supports alert deduplication, alert merging, suppression, and silence. Does not support transaction management or owner management. |
| Notification management | Notification capabilities | Supports dynamic notification channel dispatch, alert escalation, recipient group management, notification channel calendar settings, on-call schedule settings, and notification channel quota control. | Only supports dynamic notification channel dispatch. Other capabilities are not supported. |
| Notification management | Common channels | Supports notification channels such as text message, Voice Service, DingTalk, email, WebHook, and Alibaba Cloud Message Center. You can also integrate channels such as WeCom, Lark, and Slack through WebHook. | Supports email, WeCom, WebHook (custom bodies not supported), PagerDuty, PushOver, Slack, OpsGenie, and VictorOps. Does not support text message or voice call channels. Third-party plug-ins can also add support for channels such as DingTalk, Lark, and Slack. |
Comparison with InfluxDB 2.0 alerting (including Kapacitor)
A self-managed InfluxDB system uses the open source combination of InfluxDB OSS 2.0 and Kapacitor to build an alerting and monitoring system. If you require cluster deployment, you must also purchase the commercial InfluxDB Enterprise edition. This solution applies only to alerting and monitoring for metrics.
| Category | Item | Simple Log Service alerting | InfluxDB 2.0 alerting (including Kapacitor) |
| Durability | Availability of the alerting feature | Service availability of more than 99.9% and storage durability of more than 99.99999999%. | The commercial edition is distributed and supports storage configuration. The open source edition runs on a single node. |
| Cost | Fees | No subscription fees. Fully managed. Monitoring and alert management are free of charge. Among notification channels, only text message and Voice Service notifications incur a small per-message fee. | Subscription fees for the commercial edition, manual O&M costs, costs for self-purchased hardware, and third-party fees for text message and voice call notifications. |
| Alerting and monitoring | Scale of monitored logs and metrics | Petabyte-scale. |
|
| Alerting and monitoring | Query and analysis syntax for monitoring | Supports SQL-92 syntax (including extensions), Prometheus Query Language (PromQL) syntax, and extended alerting syntax. | Supports Flux syntax. |
| Alerting and monitoring | Machine learning capabilities | Supports more than 10 AI algorithms, such as prediction, outlier detection, and root cause analysis. | Supports the Loud ML algorithm. |
| Alerting and monitoring | Data collaboration capabilities | Supports collaborative monitoring across data stores, projects, regions, and accounts. | Supports cross-bucket Flux joins within a single cluster. |
| Alerting and monitoring | No-data alerts | Supported. | Not supported. |
| Alerting and monitoring | Alert recovery | Supported. | Not supported. |
| Alerting and monitoring | Tags and annotations | Supported. | Supports simple tags. |
| Alerting and monitoring | Dynamic severity | Supported. | Supported. |
| Alerting and monitoring | Evaluation by group | Supported. You can customize the configuration. | Not supported. |
| Alerting and monitoring | Monitoring-side control |
| Not supported. |
| Alert management | Alert denoising and transaction management |
| Only supports alert suppression. Other capabilities are not supported. |
| Notification management | Notification capabilities | Supports dynamic notification channel dispatch, alert escalation, recipient group management, notification channel calendar settings, on-call schedule settings, and notification channel quota control. | Only supports dynamic notification channel dispatch. Other capabilities are not supported. |
| Notification management | Common channels | Supports notification channels such as text message, Voice Service, DingTalk, email, WebHook, and Alibaba Cloud Message Center. You can also integrate channels such as WeCom, Lark, and Slack through WebHook. | Supports notification channels such as email, WebHook (flexible custom bodies not supported), exec, PagerDuty, PushOver, Slack, OpsGenie, VictorOps, and HipChat. Does not support text message or voice call channels. |