You can use Telegraf to collect MongoDB monitoring data and Logtail to upload it to a MetricStore in Log Service. This process creates a pipeline for visualizing and monitoring your MongoDB instances.
Prerequisites
A Project and a MetricStore are required. For more information, see Manage a Project and Create a MetricStore.
Limitations
Only Logtail 0.16.50 or later on Linux servers supports collecting MongoDB monitoring data. If you have an earlier version of Logtail installed, you must upgrade it. For more information, see Install Logtail (Linux system).
Procedure
Log on to the Simple Log Service console.
-
In the Import Data section, on the Monitoring Data tab, click MongoDB Monitoring.
-
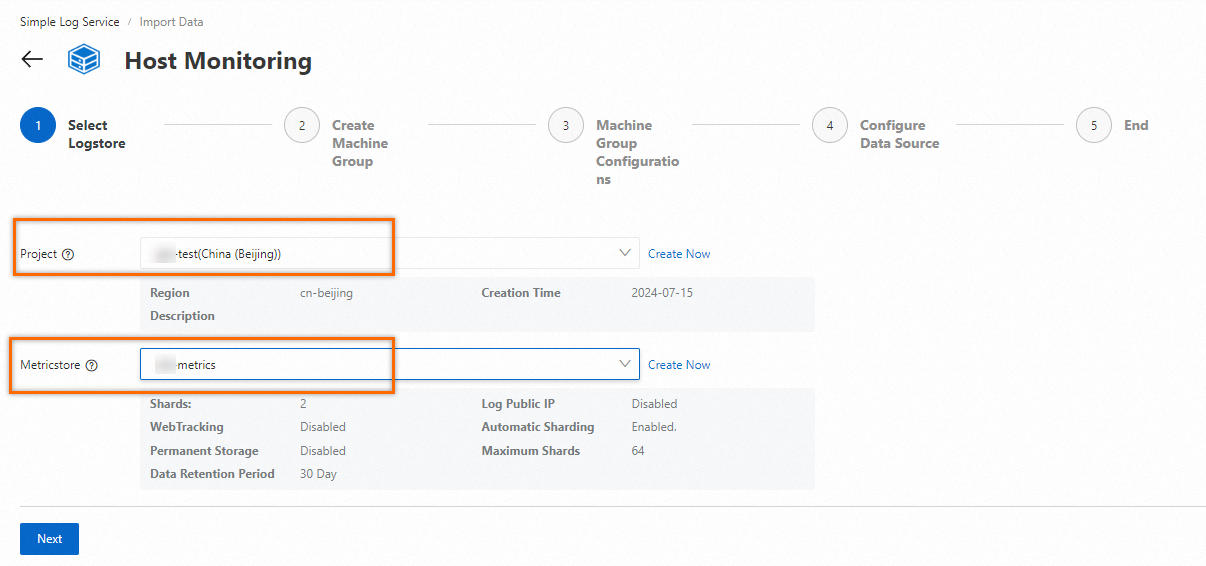
Select the destination project and Metricstore, and then click Next.
-
On the Create Machine Group tab:
-
If a machine group is available, click Use Existing Machine Groups.
-
If no machine groups are available, perform the following steps to create a machine group. In this example, an Elastic Compute Service (ECS) instance is used.
-
On the ECS Instance tab, under Manually Select Instances, select the target ECS instance, and then click Create.
For more information, see Install Logtail on ECS instances.
ImportantIf you want to collect logs from an ECS instance that belongs to a different Alibaba Cloud account than Simple Log Service, a server in a data center, or a server of a third-party cloud service provider, you must manually install Logtail. For more information, see Install Logtail on a Linux server. After you manually install Logtail, you must configure a user identifier for the server. For more information, see Configure a user identifier.
-
After Logtail is installed, click Complete Installation.
-
On the Create Machine Group page, enter a Name and click Next.
You can use Simple Log Service to create IP address-based machine groups and custom identifier-based machine groups. For more information, see Create a machine group.
-
-
-
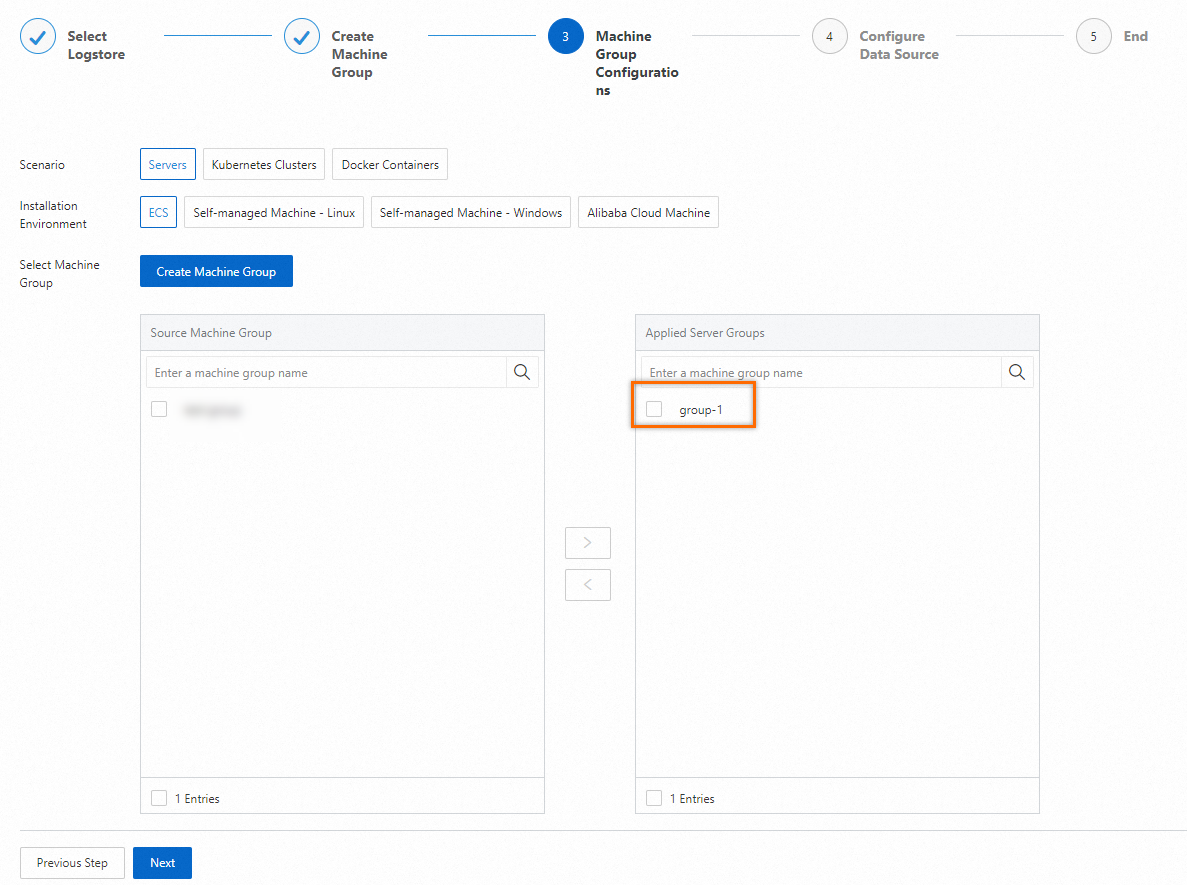
Confirm that the machine group is displayed in the Applied Server Groups section and click Next.
ImportantIf you apply a machine group immediately after you create the machine group, the heartbeat status of the machine group may be FAIL. This issue occurs because the machine group is not connected to Simple Log Service. To resolve this issue, you can click Automatic Retry. If the issue persists, see What do I do if no heartbeat connections are detected on Logtail?
-
On the Configure Data Source tab, configure the following parameters and click Next.
Parameter
Description
Configuration name
A custom name for the Logtail collection configuration.
Cluster name
A custom name for the MongoDB cluster.
This parameter adds the cluster=<cluster_name> tag to the collected MongoDB monitoring data.
ImportantEnsure that the cluster name is unique to avoid data conflicts.
Server list
Configure the following parameters:
Address: The endpoint of the MongoDB database. This can be an IP address, a hostname, or a domain name.
Port: The port number of the MongoDB database. The default value is 27017.
Account: The username for connecting to the MongoDB database.
NoteWe recommend that you create a dedicated user for monitoring and grant only the required permissions.
Password: The password for the specified account.
You can add multiple MongoDB databases.
Custom tags
Specifies custom tags to add to the collected monitoring data. Tags are key-value pairs.
After you set this parameter, Simple Log Service adds tags to the MongoDB monitoring data collected through this Logtail configuration.
Custom Telegraf configuration
Simple Log Service uses Telegraf, an open-source agent, to collect MongoDB monitoring data. If the default parameters do not meet your requirements, you can use the Custom Telegraf configuration option for advanced settings. For configuration examples, see Configuration.
For a list of supported metrics, see Metrics.
FAQ
How can I check whether Telegraf collects data as expected?
You can check the logs of the /etc/ilogtail/telegraf/telegraf.log file on your server. You can also collect this log file to Log Service and search for the required information.
What to do next
- Search and analyze
After you complete the settings, Telegraf uses the Logtail to upload collected metrics to the Metricstore of Log Service. You can query the data on the Search & Analysis page of the Metricstore. For more information, see Query and analyze metric data.
-
Visualize data
After you configure MongoDB monitoring, Log Service automatically creates a dashboard named MongoDB Monitoring_<YourClusterName> in the corresponding Project. You can use this dashboard directly or set up alerts.