Why does rate()/increase() produce abnormal values?
The calculation logic in the Prometheus Engine source code causes this behavior. For details, see the source code.
The following code snippet shows how rate() and increase() are calculated within a time window. The difference between the last and first values is assigned to resultFloat, and then the remaining data points are iterated. If a value decrease is detected, the previous value (prevValue) is added to resultFloat, which causes the final result to become abnormally large.
switch {
	case len(samples.Histograms) > 1:
		numSamplesMinusOne = len(samples.Histograms) – 1
		firstT = samples.Histograms[0].T
		lastT = samples.Histograms[numSamplesMinusOne].T
		var newAnnos annotations.Annotations
		resultHistogram, newAnnos = histogramRate(samples.Histograms, isCounter, metricName, args[0].PositionRange())
		annos.Merge(newAnnos)
		if resultHistogram == nil {
			// The histograms are not compatible with each other.
			return enh.Out, annos
		}
	case len(samples.Floats) > 1:
		numSamplesMinusOne = len(samples.Floats) – 1
		firstT = samples.Floats[0].T
		lastT = samples.Floats[numSamplesMinusOne].T
		resultFloat = samples.Floats[numSamplesMinusOne].F – samples.Floats[0].F
		if !isCounter {
			break
		}
		// Handle counter resets:
		prevValue := samples.Floats[0].F
		for _, currPoint := range samples.Floats[1:] {
			if currPoint.F < prevValue {
				resultFloat += prevValue
			}
			prevValue = currPoint.F
		}
	default:
		return enh.Out, annos
	}
				resultFloat += prevValue
			}
			prevValue = currPoint.F
		}
	default:
		// TODO: add RangeTooShortWarning
		return enh.Out, annos
	}
Troubleshooting
-
Use a PromQL query to determine if a value decrease has occurred. First, narrow the time filter to the period when the anomaly occurred, and then run the following PromQL query. Replace
xxxx_metricwith your actual metric name. If the query returns any data points, a value decrease occurred.Query: (xxxx_metric{} - xxxx_metric{} offset 1s) < 0 Step parameter: 1s -
Use an SQL query to retrieve the original anomalous data points for the affected time series. For example:
* | select *, from_unixtime(__time_nano__/1000000.0) from "Your_Metricstore_Name.prom" where __name__='your_metric_name' and element_at(__labels__, 'your_label_key_for_filtering')='your_label_value_for_filtering' order by __time_nano__ // We recommend that you add multiple element_at functions to the SQL query to further narrow down the time series. -
The SQL result set is sorted by timestamp, allowing you to directly observe the raw, anomalous data points that were written.
Why does PromQL return no data?
First, check the following two areas.
-
Scenario 1: Verify that your PromQL syntax is correct. The query editor provides automatic syntax validation hints. If an issue is found, correct your query based on the suggestions.
For example, if you enter the query
count(demo_api_request_duration_seconds_bucket)in Metricstore (PromQL) mode, a green Syntax is valid label and a syntax parse tree appear below the query editor, indicating that the syntax check passed.
-
Scenario 2: Go to the Custom Analysis page for the Metricstore and run an SQL query to confirm that data exists within the specified time range.
In this SQL, the
__name__field represents MetricName.* | select * from "Your_Metricstore_Name.prom" where __name__ = 'demo_api_request_duration_seconds_bucket'In the upper-right corner of the metric exploration page, click More Actions and select Custom Analysis.
Enter the SQL statement and click Query/Analysis in the upper-right corner to run the query. The results are displayed in a table in the preview area below. The table includes fields such as
__name__,__labels__,__time_nano__, and__value__. Use these results to verify that data exists within the specified time range.
If neither scenario applies, the problem is likely caused by the vector selection logic and the lookback-delta mechanism of the Prometheus compute engine.
The Prometheus compute engine uses PromQL as its query language. PromQL does not necessarily include all data points in a calculation. Before the calculation, a vector selection process occurs. All PromQL operators, functions, and expressions fall into two categories based on their vector selection behavior: range vector selectors, which use a time duration selector like [1m] or [1h], and instant vector selectors.
The following examples show PromQL queries that use these two types of vector selectors.
RangeVectorSelector:
rate(http_requests_total[5m])
delta(http_requests_total[5m])
count_over_time(http_requests_total[5m])
InstantVector:
http_requests_total
absent(http_requests_total)
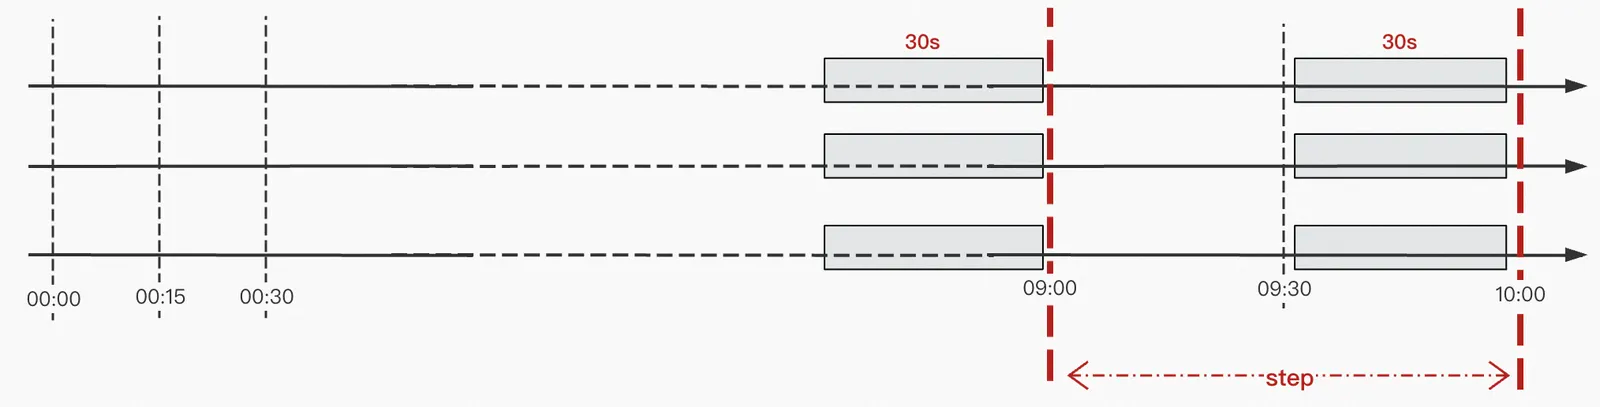
count(http_requests_total)The "vector selection" process of a RangeVectorSelector includes all data points within the time range specified by the "[xx]" operator in the calculation. For example, the operator "count_over_time ( up [30s] )" indicates that each calculation uses data points from the current time and the preceding 30 seconds.
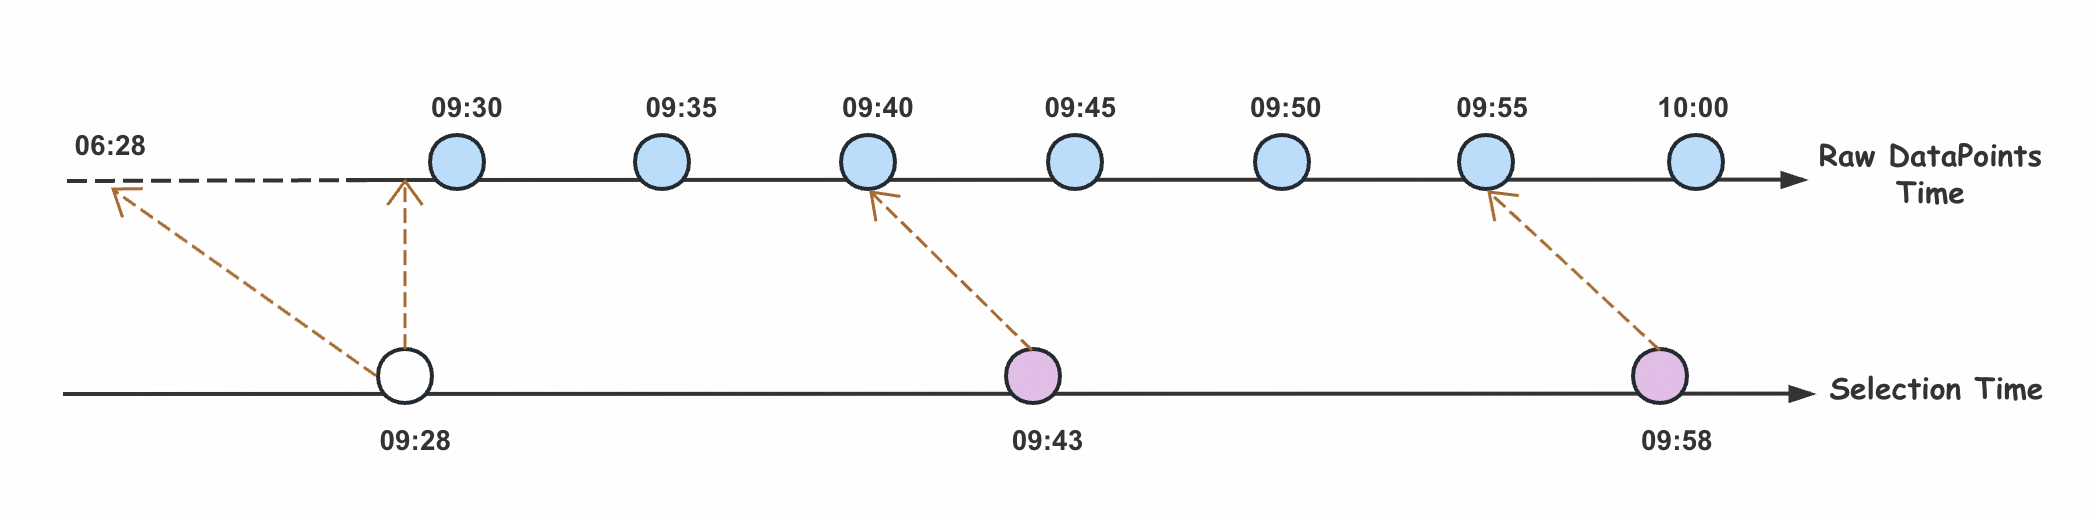
The lookback-delta mechanism in PromQL applies only to an InstantVectorSelector. During vector selection, it looks back over a time range based on the lookback-delta parameter and uses the most recent data point as the value for the current timestamp. In most cases, the write timestamps of raw data are not aligned with the query timestamps. Therefore, during vector selection, the system looks back for n minutes (The default in SLS is 3 minutes, and you can adjust this value by using a custom parameter. For more information, see Time series metric query API) and uses the most recent data point as the data for the current timestamp.
In the following example, the query startTime is 09:28. No raw data point exists at this exact time. The engine looks back to 06:28, but finds no data written in this interval. As a result, no data point is selected for 09:28. Similarly, for a query time of 09:43, the data point at 09:40 is selected. For 09:58, the data point at 09:55 is selected.
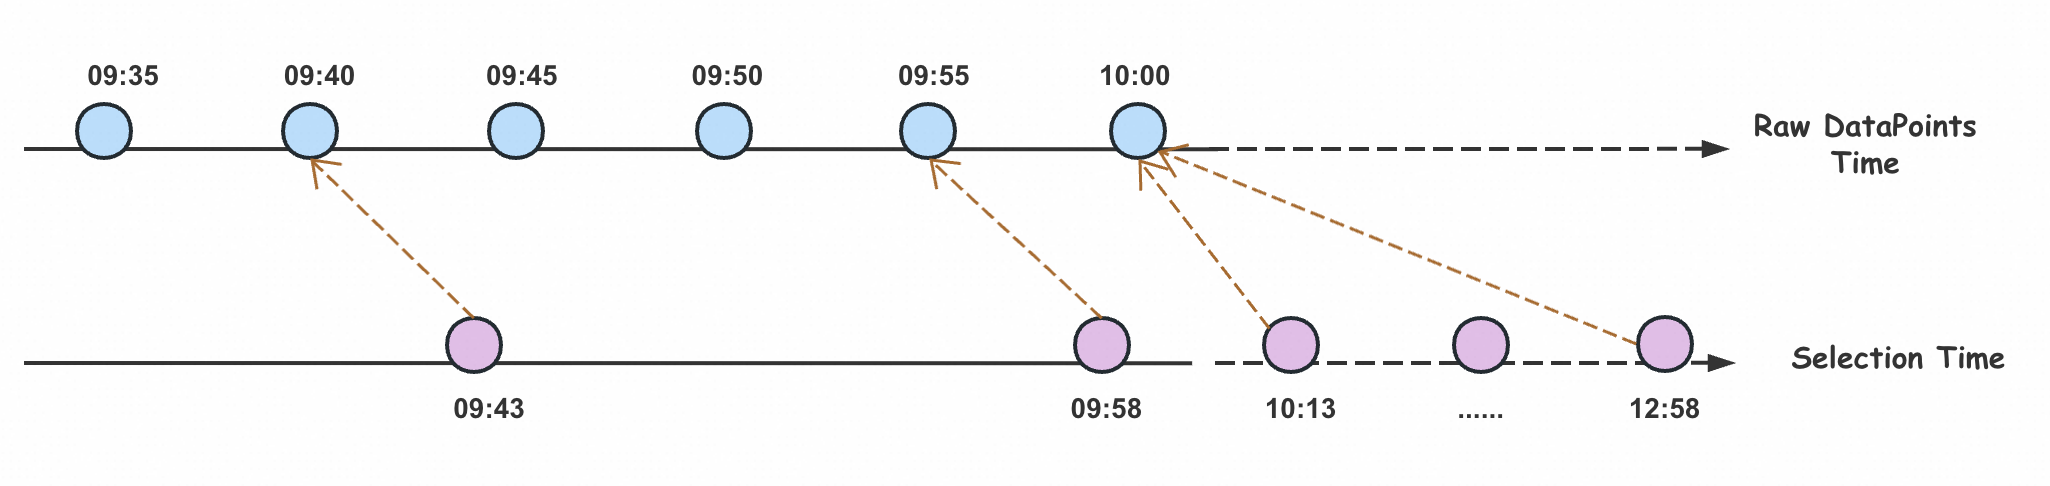
Because of this mechanism's specific behavior, a special scenario can occur during vector selection: PromQL may return data for a time point where no data actually exists. In the example below, no data is available after 10:00. However, at time points such as 10:13, 10:28, 10:43, and 12:58, the query still selects the data point from 10:00 because the lookback-delta mechanism looks back 3 minutes.
The two types of vector selectors use different selection logic. When a query returns no data, the cause is often related to this logic. The following sections describe possible scenarios for each selector type.
-
RangeVectorSelector
If the time range in the
[xx]operator is small and thestepparameter is large, the vector selection process may not find any data points before a calculation.For example, the original metric data for
"up"is one point per hour (on the hour). The query parameters are as follows:startTime: 10:30:00 endTime : 18:30:00 step : 1h query : count_over_time(up[10m])This query is expected to return seven data points, but returns an empty result. The PromQL engine performs a calculation at each step interval starting from
startTime. In this case, calculations occur at 11:30:00, 12:30:00, 13:30:00, and so on. However, the vector selection process only looks for points within the last 10 minutes for each calculation, and no data points exist in those narrow windows.
-
InstantVectorSelector
If the
”lookback-delta”parameter is small and the”step”parameter is large, the vector selection process may not find the nearest data point before a calculation.For example, if the metric data for
“up”is originally written as one data point per hour (on the hour), the query parameters are:startTime: 10:30:00 endTime : 18:30:00 step : 1h query : count(up)The default
"lookback-delta"in Prometheus is 5 minutes, while in SLS Metricstore it is 3 minutes. The vector selection before each calculation looks back only 3 minutes. At timestamps such as 11:30:00, 12:30:00, 13:30:00, 14:30:00, 15:30:00, 16:30:00, 17:30:00, and 18:30:00, the system looks back 3 minutes and uses the most recent data point as the value for the current time. Because the raw data is sparse, no data points are found at these timestamps, and the final result is empty.
Solutions
-
Retrieve data for a specific write time point by adjusting the
startTime,endTime, andstepquery parameters to align with that time point.For example, the following query returns seven data points. However, metric data is often collected at irregular intervals in practice, making it impractical to manually align query parameters. This solution is not recommended for general use.
startTime: 10:00:00 endTime : 18:00:00 step : 1h query : count(up) -
Decrease the
stepparameter. For example, setting the step to 3 minutes in the InstantVectorSelector scenario makes the selection process more frequent, increasing the likelihood of finding sparsely distributed raw data points. -
Increase the
lookback-deltaparameter or the time range in the[xx]operator. This expands the time window for vector selection, making it more likely to include relevant data points.
Why PromQL returns data after writes stop?
The lookback-delta mechanism in the Prometheus compute engine causes this behavior. For details, see lookback-delta mechanism.
Why query timestamps differ from write times?
The lookback-delta mechanism in the Prometheus compute engine causes this behavior. For details, see lookback-delta mechanism.
Why repeated queries return different results?
Two possible reasons exist:
-
If you are using a relative time range, the absolute start and end times of your query change with each execution. As a result, the
lookback-deltaoperation may select different data points each time, leading to different results. This is expected behavior and consistent with the Prometheus standard. -
If there is a long interval between two executions for the same fixed time range, the first query might have run before all the data for that period arrived at Simple Log Service due to ingestion delays. The difference in available data between queries leads to inconsistent results. To mitigate this, use an
offsetmodifier in your PromQL query to shift the query range back in time, which helps avoid errors caused by ingestion latency.
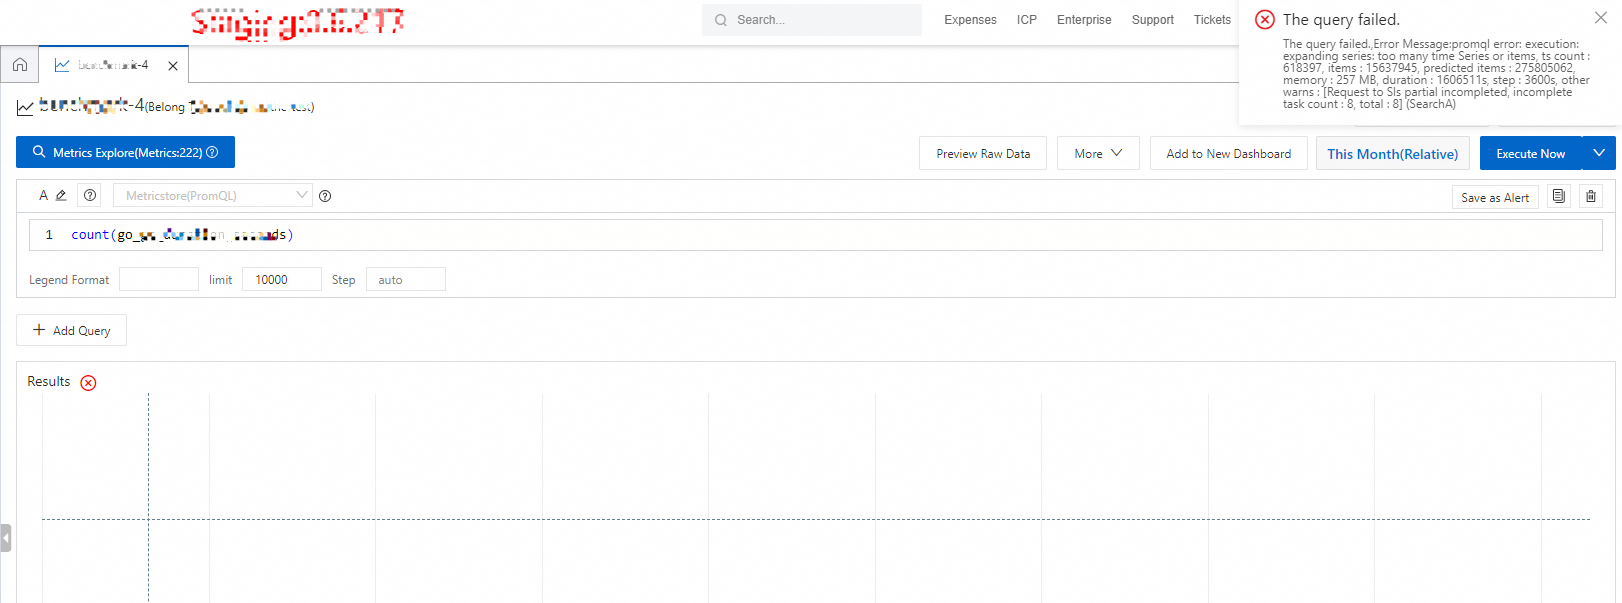
Query fails due to resource limits
If your query returns an error containing text such as "too many time series or items, xxxxxx" or "too many time series or items in parallelMaster node, xxxxx", the query attempted to read a large volume of data and triggered a memory limit at the compute layer.
Solutions
-
Reduce the query time range.
-
If you must run the query over the specified time range, enable concurrent computing. For more information, see the concurrent computing configurations.
Vector cannot contain metrics with same labelset
-
Reason 1: The
LabelNameentries in the__labels__field value are not in alphabetical order.The
__labels__field in MetricStore consists of multiple labels in theLabelName#$#LabelValueformat, separated by vertical bars (|). All labels must be sorted alphabetically by LabelName. For details, see metric identifier.This error occurs when the label names in the
__labels__field value are not in alphabetical order. Use the following SQL statement to verify whether they are sorted correctly.* | select * from ( select __labels__, array_join(array_sort(split(__labels__, '|')), '|') as rightLabels from "Your_Metricstore_Name.prom" where __name__!='' ) where __labels__ != rightLabels -
Reason 2: The
__labels__field contains an empty LabelValue.In Prometheus Engine, labels with an empty
LabelValueare invalid. Prometheus Engine removes these labels during computation, which causes this error. Follow these steps to check whether the__labels__field contains a label with an emptyLabelValue.-
Narrow the query time range to locate the approximate time when the error occurs.
-
Run the following SQL query.
* | select __labels__ from "Your_Metricstore_Name.prom" where __name__!='' and regexp_like(__labels__, '.*#\$#\|.*|.*#\$#$')If the query returns any results, it confirms the presence of empty label values. Modify the code at your data reporting source to remove these invalid labels.
-
Why are labels missing from query results?
This issue occurs when the LabelName entries in the __labels__ field value are not sorted alphabetically. Use the following SQL statement to verify the sort order.
* | select * from (
select __labels__, array_join(array_sort(split(__labels__, '|')), '|') as rightLabels from "Your_Metricstore_Name.prom" where __name__!=''
) where __labels__ != rightLabelsWhy by/without clauses give unexpected results?
This problem occurs when the label names in the __labels__ field value are not sorted alphabetically. Use the following SQL statement to verify the sort order.
* | select * from (
select __labels__, array_join(array_sort(split(__labels__, '|')), '|') as rightLabels from "Your_Metricstore_Name.prom" where __name__!=''
) where __labels__ != rightLabelsNo data is displayed in metric exploration
No data may exist within the default query time range.
When you select a time range for your query, ensure that data exists within that range.
When you use the metric exploration feature, the system defaults to querying the last 5 minutes to ensure a fast response.
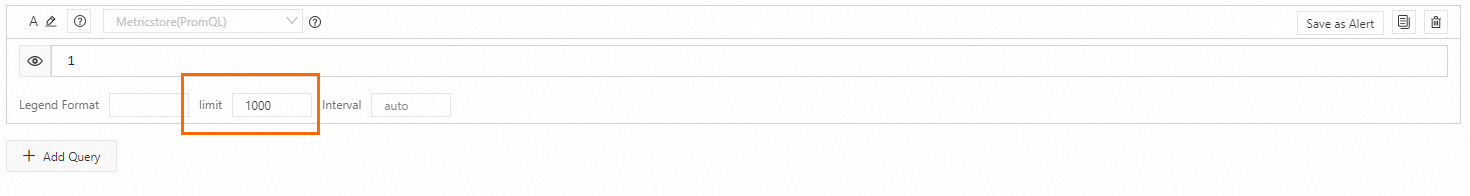
Why are time series missing from results?
When you run a query on the query and analysis page for a Metricstore in the Simple Log Service console, the limit parameter restricts the number of results returned by SQL or PromQL queries. Increase this value as needed.
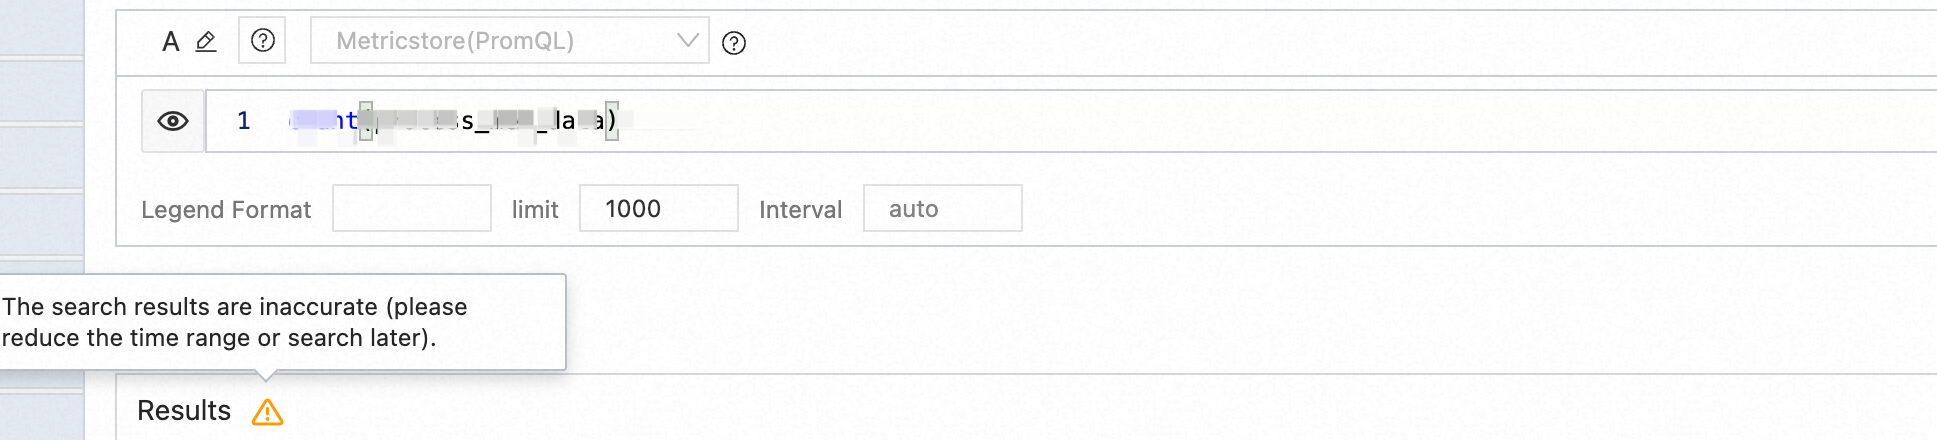
Warnings in PromQL results
A possible cause is that the system could not read all data within the time range because the read capacity of a shard was reached. To resolve this, either narrow the query time range or split the shard to increase overall throughput.
Error: Maximum resolution exceeded
In Prometheus, each time series is limited to a maximum of 11,000 data points, meaning (endTime - startTime) / step cannot exceed 11,000. Narrow the query time range or increase the step parameter.