Analyze text, long, and double type fields to view basic distribution, statistical metrics, and time series charts for the top 5 values.
Prerequisites
Enable the indexing and statistics features for the fields that you want to analyze. For more information, see Create an index.
For example, if an access log contains the request_method and request_time fields, you can use the configuration shown in the following figure.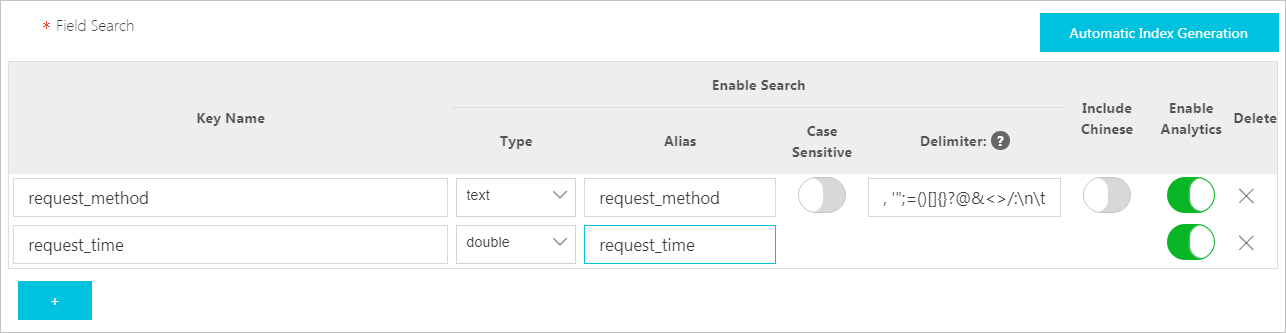
Limits
Field analysis covers all logs on the current query page that match the specified time range and query conditions. If the number of logs is less than 100 million, a full analysis is performed. If the number exceeds 100 million, sampling reduces the dataset to approximately 100 million logs. To avoid sampling, reduce the time range or add more filter conditions.
View field analysis results
Log on to the Simple Log Service console.
In the Projects section, click the one you want.

On the tab, click the logstore you want.

-
View the field analysis results.
-
View the analysis results of a single field.
On the Raw Logs tab, in the Indexed Fields section, click the
 icon next to a field to view the analysis results for that field.
-
Field description
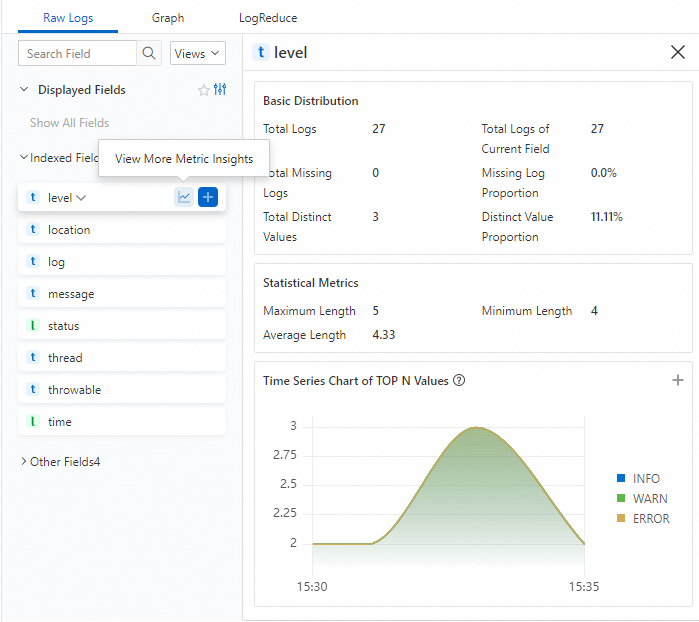
Details of text fields
Basic distribution
|
Parameter |
Description |
|
Total number of log entries |
The total number of log entries that match the time range and query conditions on the current page. |
|
Total row count |
The total number of log entries that contain this field and match the current query conditions. |
|
Total number of missing values |
Total number of log entries - Total number of entries for the current field. |
|
Percentage of missing values |
Total number of missing values / Total number of log entries. |
|
Total number of distinct values |
The number of unique field values in the column, calculated using the approx_distinct function. |
|
Percentage of distinct values |
Total number of distinct values / Total number of log entries. |
Statistical metrics
|
Parameter |
Description |
|
Maximum length |
The maximum character length of the field value. |
|
Minimum length |
The minimum character length of the field value. |
|
Average length |
The average character length of the field values. |
Time series chart of top 5 values
Displays the change trends of the top 5 values over the specified time range.
Click the  icon on the right of Time Series Chart of Top 5 Values to add the time series chart to a dashboard. For more information, see Create a dashboard.
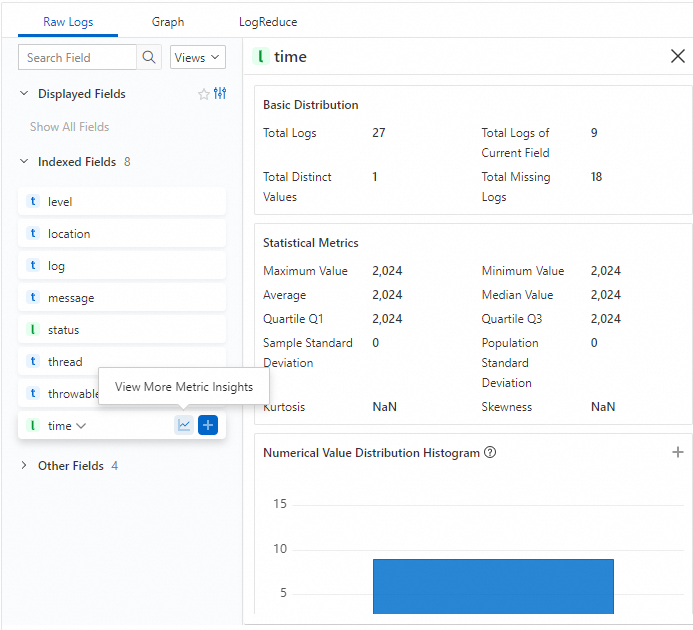
Details of long and double fields
Basic distribution
|
Parameter |
Description |
|
Total number of log entries |
The total number of log entries that match the time range and query conditions on the current page. |
|
Total number of rows |
The total number of log entries that contain this field and match the current query conditions. |
|
Total number of distinct values |
The number of unique field values in the column, calculated using the approx_distinct function. |
|
Percentage of distinct values |
Total number of distinct values / Total number of log entries |
Statistical metrics
|
Parameter |
Description |
|
Maximum value |
The maximum value of the field. |
|
Minimum value |
The minimum value of the field. |
|
Average value |
The average value of the field. |
|
Median |
The value in the middle position after the data is sorted in ascending order. |
|
Quartile Q1 |
The value at the 25th percentile after the data is sorted in ascending order. |
|
Quartile Q3 |
The value at the 75th percentile after the data is sorted in ascending order. |
|
Sample standard deviation |
The sample standard deviation of the field, calculated using the stddev_samp function. |
|
Population standard deviation |
The population standard deviation of the field, calculated using the stddev_pop function. |
|
Kurtosis |
Measures the degree of concentration in a data distribution. |
|
Skewness |
Measures the degree of asymmetry in a data distribution. |
Numerical distribution histogram
Generates an approximate histogram by dividing the value distribution into 10 bins.
Click the icon on the right of Numerical Distribution Histogram to add the histogram to a dashboard. For more information, see Create a dashboard.