Event settings allow you to create interactive drill-down actions for your raw logs. This feature helps you get detailed log information. You can use both default and advanced event settings. This topic describes how to configure event settings for raw logs in the Simple Log Service console.
Prerequisites
-
You have enabled and configured an index. For more information, see Create an index.
Background information
Drilling is an essential function in data analysis. It allows you to explore data at different levels of detail by changing dimensions and granularity. Drilling includes two main actions: roll-up and drill-down. A drill-down lets you dive deeper into your data to uncover more detailed insights, helping you make faster and better decisions. Simple Log Service provides drill-down capabilities for raw logs through default and advanced event settings.
Video tutorial
Default event settings
Prerequisites
This feature is available only for data collected by using Logtail. It does not apply to data collected through an API or SDK.
Procedure
Default event settings allow you to quickly add conditions to a query statement by using and and not operators, or create a new query statement.
On the Table or Raw Data tab, click the value of any log field to open the Default window. The available actions are described in the following table.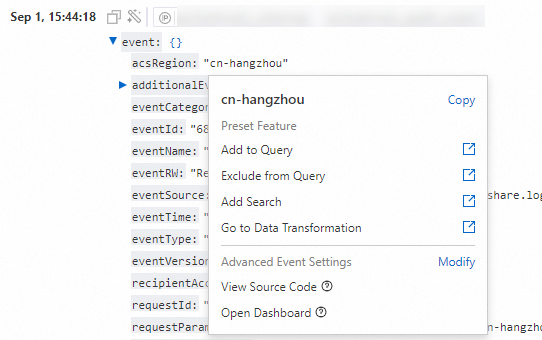 For example, suppose the query statement in the search box is
 * | SELECT status as dim, count(1) as c group by dim. If you click the value 203.0.113.1 in the host log field, the query statement is updated based on your selected action:
|
Actions |
Description |
Updated query statement |
|
Add to Query |
Appends the selected value to the query statement by using an |
|
|
Exclude from Query |
Appends the selected value to the query statement by using a |
|
|
Add Search |
Replaces the current query statement with a new one based on the selected value and runs the new query. |
|
Advanced event settings
You can add different types of events to a log field for detailed analysis. Available event actions include opening a Logstore, a saved search, a dashboard, or a custom HTTP link.
To open the Advanced Event Settings window, go to the Table or Raw Data tab, click the  icon next to a log field, and select Event Settings.
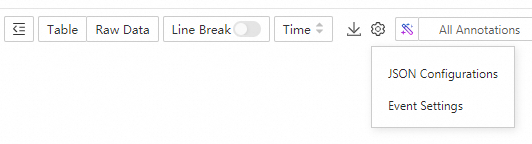
You can configure up to 10 advanced events per log field.
Log on to the Simple Log Service console.
In the Projects section, click the one you want.

On the tab, click the logstore you want.

-
On the Raw Logs tab, go to the Table or Raw Data subtab, click the
 icon, and select Event Settings.
 -
In the Advanced Event Settings dialog box, find the target field in the field list and click Add Event.
-
In the Event Settings section, configure the advanced event.
Event actions include opening a Logstore, a saved search, a dashboard, or a custom HTTP link. The configuration for each action is described below.
Note-
To configure an event that opens a Logstore, you must create the destination Logstore first. For more information, see Create a Logstore.
-
To configure an event that opens a saved search, you must create the destination saved search first. For more information, see Saved search.
To configure variables, you must define placeholder variables in the query statement of the destination saved search. For more information, see Set placeholder variables.
-
To configure an event that opens a dashboard, you must create the destination dashboard first. For more information, see Create a dashboard.
To configure variables, you must define placeholder variables for the charts on the destination dashboard. For more information, see Set placeholder variables.
-
To configure an event that opens a custom HTTP link, you must have the destination URL ready.
-
Open Logstore
The following table describes the parameters for configuring an event to open a Logstore.
Parameter
Description
Configuration Name
The name of the event configuration.
Event Action
Select Open Logstore.
Open New Window
If you enable this option, the query page of the destination Logstore opens in a new browser tab when the event is triggered.
Time Range
The query time range for the destination Logstore. You can set this to one of the following values:
-
Default: When you click a field value and navigate to the destination Logstore, the query uses the default time range of Simple Log Service, which is 15 Minutes (Relative).
-
Use Query Time: When you click a field value and navigate to the destination Logstore, the query uses the same time range as the original query for the raw logs.
-
Relative Time: When you click a field value and navigate to the destination Logstore, the query uses the relative time range that you specify.
-
Time Frame: When you click a field value and navigate to the destination Logstore, the query uses the specific time frame that you specify.
Select Logstore
Select the destination Logstore. When the event is triggered, you are redirected to the query page of this Logstore.
Inherit Filter Condition
Turn on the Inherit Filter Condition switch to synchronize the existing filter conditions from the current query to the query page of the target Logstore, and add them to the beginning of the query and analysis statement by using
AND.Filter
When you enter a filter statement on the Filter tab, the statement is synchronized to the query page of the destination Logstore after you are redirected and is prepended to the query and analysis statement by using the
ANDoperator.You can insert Optional Parameter Fields into a filter statement to use the values of the corresponding fields as filter conditions. For example, if you enter
${__topic__}, anANDoperator is appended to the query statement in the destination Logstore.Variable
Variable configuration is not supported for this event action.
-
-
Open Saved Search
Configure an event to open a saved search. The following table describes the parameters.
Parameter
Description
Configuration Name
The name of the event configuration.
Event Action
Select Open Saved Search.
Open New Window
If you enable this option, the saved search opens in a new browser tab when the event is triggered.
Time Range
The query time range for the destination saved search. You can set this to one of the following values:
-
Default: When you click a field value and navigate to the destination saved search, the query uses the default time range of Simple Log Service, which is 15 Minutes (Relative).
-
Use Query Time: When you click a field value and navigate to the destination saved search, the query uses the same time range as the original query for the raw logs.
-
Relative Time: When you click a field value and navigate to the destination saved search, the query uses the relative time range that you specify.
-
Time Frame: When you click a field value and navigate to the destination saved search, the query uses the specific time frame that you specify.
Select Saved Query
Select the destination saved search. When the event is triggered, you are redirected to this saved search.
Inherit Filter Condition
Turn on the Inherit Filter Condition switch to apply the existing filter conditions from the current query to the destination Quick Query page, and add them to the beginning of the query and analysis statement by using
AND.Filter
If you enter a filter statement on the Filter tab, the statement is synchronized to the query page of the destination Quick Query and is prepended to the query and analysis statement by using
AND.You can insert Optional Parameter Fields into a filter statement to use the value of the corresponding field as a filter condition. For example, if you click to enter
${__topic__}, the condition is appended to the query statement of the resulting quick query with anANDoperator.Variable
You can use variables to dynamically modify the query statement of the destination saved search. When a variable defined here matches a placeholder variable in the destination saved search, the placeholder is replaced with a value when the event is triggered. You can configure variables on the Variable tab.
Note-
To configure variables, you must first define placeholder variables in the query statement of the destination saved search. For more information, see Set placeholder variables.
-
You can add up to five dynamic variables and five static variables.
-
Dynamic variable: The value for this variable is dynamically retrieved from a specified field in the triggering log entry.
-
Dynamic Variable Name: The name of a placeholder variable that you have defined in Quick Query, such as
dynamic_ip. -
Column for Dynamic Variable Value: The values in the selected column are used to dynamically replace the variables in the query and analysis statements of the target quick query. For example, select
__source__.Replaces the placeholder variable defined in the quick query with the value of
__source__and runs the query.
-
-
Static variable: The value for this variable is a fixed, predefined value.
-
Static Variable Name: The name of a placeholder variable that you defined in Quick Query. For example:
static_ip. -
Static Value: Replaces variables in the query and analysis statements of the target quick query with a fixed value. For example,
203.0.113.1.This indicates that the value
203.0.113.1ofstatic_ipreplaces the placeholder variable defined in the quick query, and a query is performed. All logs in which the placeholder variable has a value of203.0.113.1are retrieved.
-
-
-
Open Dashboard
Configure an event to open a dashboard. The following table describes the parameters.
Parameter
Description
Configuration Name
The name of the event configuration.
Event Action
Select Open Dashboard.
Open New Window
If you enable this option, the dashboard opens in a new browser tab when the event is triggered.
Time Range
The query time range for the destination dashboard. You can set this to one of the following values:
-
Default: When you click a field value and navigate to the destination dashboard, the query uses the default time range of Simple Log Service, which is 15 Minutes (Relative).
-
Inherit Chart Time: When you click a field value and navigate to the destination dashboard, the query uses the time range of the chart that triggered the drill-down event.
-
Relative Time: When you click a field value and navigate to the destination dashboard, the query uses the relative time range that you specify.
-
Time Frame: When you click a field value and navigate to the destination dashboard, the query uses the specific time frame that you specify.
Select Dashboard
Select the destination dashboard. When the event is triggered, you are redirected to this dashboard.
Inherit Filter Condition
If you turn on the Inherit Filter Condition switch, existing filter conditions from the current dashboard are passed to the destination dashboard.
Filter
On the Filter tab, enter a filter statement. This statement is passed to the destination dashboard.
You can insert an Optional Parameter Fields into a filter statement to use the value of the corresponding field as a filter condition. For example, if you click to insert
${__source__}, the destination dashboard displays only logs with a value that matches${__source__}.Variable
You can pass variables to the destination dashboard. You can configure variables on the Variable tab.
Note-
To configure variables, you must first define placeholder variables for the charts on the destination dashboard. For more information, see Set placeholder variables.
-
You can add up to five dynamic variables and five static variables.
-
Dynamic variable: The value for this variable is dynamically retrieved from a specified field in the log entry where the event was triggered.
-
Dynamic Variable Name: Specify a placeholder variable that you have defined in Quick Query, such as
dynamic_ip. -
Column for Dynamic Variable Value: The values in the specified column are dynamically synchronized to the target dashboard. For example, select
__source__.Replaces the placeholder variable defined in the dashboard query with the value of
__source__and runs the query.
-
-
Static variable: The value for this variable is a fixed, predefined value.
-
Static Variable Name: The name of the static variable. For example, enter the placeholder variable
static_ipthat you have defined in the dashboard data source. -
Static Value: A fixed value is synchronized to the target dashboard. For example,
203.0.113.1.This indicates that the predefined placeholder variable in the dashboard is replaced with the value of
static_ip(203.0.113.1), and a query is performed. All logs in which the placeholder variable is set to203.0.113.1are retrieved.
-
-
-
Custom HTTP link
Configure an event to open a custom HTTP link.
-
The path in the HTTP link specifies the location of the destination file.
-
You can add optional parameter fields (variables) to the URL path. When you trigger the event from a raw log, the corresponding field value replaces the parameter, and you are redirected to the new URL.
Parameter
Description
Configuration Name
The name of the event configuration.
Event Action
Select Create Custom HTTP URL.
Protocol
The protocol for the custom link. The supported types include HTTP and Custom.
Enter a URL
The destination URL.
For example,
www.example.com/s?wd=${sls_project}is the destination URL. After an event is triggered, ${sls_project} is replaced with the name of your Project.Use System Variable
If you turn on the Use System Variable switch, you can insert system variables from Simple Log Service into the URL. Supported variables include ${sls_project}, ${sls_dashboard_title}, ${sls_chart_name}, ${sls_chart_title}, ${sls_region}, ${sls_start_time}, ${sls_end_time}, ${sls_realUid}, and ${sls_aliUid}.
Transcode
If you turn on the Transcode switch, the URL content is encoded.
Optional Parameter Fields
You can replace parts of the URL with a field's value from the log that triggers the event. The replacement happens automatically when the event is triggered.
-
-
Example
This example shows how to perform a drill-down analysis by using a saved search. In this scenario, you collect access logs into a Logstore named accesslog. You create a saved search named PV Distribution of IP Addresses and method. Then, you configure an advanced event for the remote_addr field in your raw logs to open this saved search. After configuration, clicking a value in the remote_addr field takes you to the saved search to view the corresponding PV trend.
The following is a sample raw log:
__source__:127.0.0.1
__tag__:__receive_time__:1613759995
__topic__:nginx_access_log
body_bytes_sent:5077
host:www.example.com
http_referer:www.example.com
http_user_agent:Mozilla/5.0 (X11; CrOS i686 12.0.742.91) AppleWebKit/534.30 (KHTML, like Gecko) Chrome/192.0.2.2 Safari/534.30
http_x_forwarded_for:192.0.2.1
remote_addr:192.0.2.0
remote_user:gp_02
request_length:3932
request_method:POST
request_time:35
request_uri:/request/path-2/file-4
status:200
time_local:19/Feb/2021:18:39:50
upstream_response_time:0.09
Procedure:
-
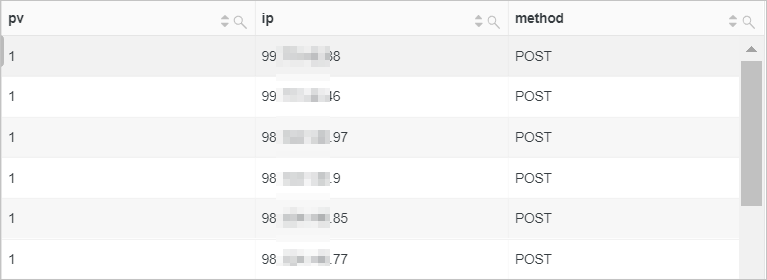
Create a saved search named PV Distribution of IP Addresses and method to query the PV distribution for requests where the request method is
POSTand the status code is200. The query statement and results are shown below:* and request_method: POST and status: 200 | select count(*) as pv, remote_addr as ip,request_method as method group by ip,method order by ip desc -
Set the variables
methodandstatus2in Quick Query. After the variables are generated, the statement changes as follows:* and request_method: ${method} and status: ${status2} | select count(*) as pv, remote_addr as ip,request_method as method group by ip,method order by ip desc -
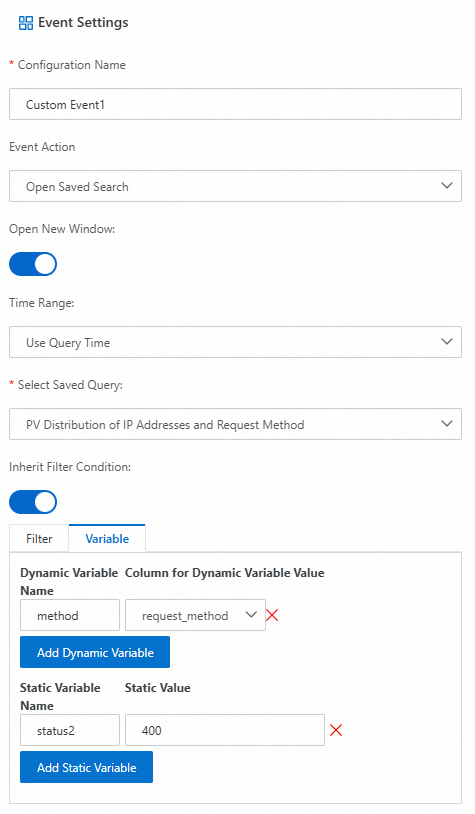
On the Raw Logs tab, configure an advanced event for the remote_addr field. Set Event Action to Open Saved Search and configure the following key parameters:
-
Select Saved Search: PV Distribution of IP Addresses and method
-
Filter: Leave this empty.
-
Variables: The static variable is status2, and its value is 400. The dynamic variable is method, and its value is request_method.
-
-
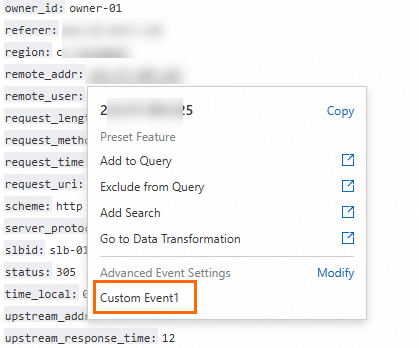
On the Raw Logs tab, click a value in the
remote_addrcolumn. In the menu that appears, click the event that you created: .In this log field, the request_method is GET, and the status is 404.
-
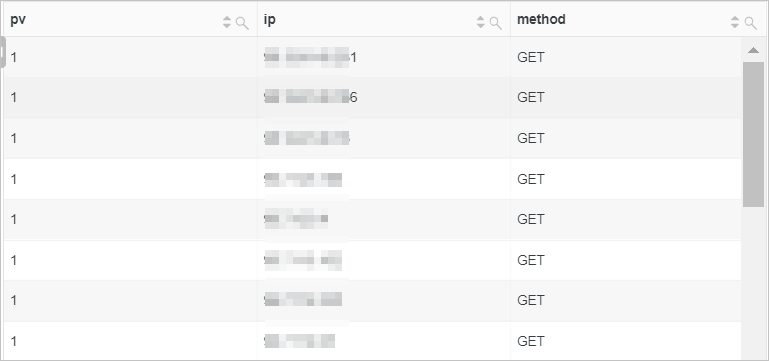
A new window opens. The query statement in the search box is now:
* and request_method: GET and status: 400 | select count(*) as pv, remote_addr as ip,request_method as method group by ip,method order by ip desc -
View the results of the saved search.
In this example, the static variable status2 is set to 400, which corresponds to the status field. The request_method of the log that you clicked to trigger the event is GET, so the dynamic variable method is set to GET. The result of the quick query is the PV distribution of IP addresses for GET requests with a status of 400.
Similarly, when you click the log entry for the triggering event where the request_method is PUT, the quick query shows the PV distribution of IP addresses for PUT requests with a status of 400.