Create indexes and run search and analytic statements on website access logs in Simple Log Service.
Prerequisites
Website access logs are collected by using a Logtail configuration. Collect text logs from servers.
Step 1: Create indexes
Indexes are required before you can query and analyze logs. Simple Log Service supports full-text indexes and field indexes. This topic uses field indexes for website access logs. Create indexes.
Log on to the Simple Log Service console.
In the Projects section, click the one you want.

On the tab, click the logstore you want.

-
In the upper-right corner, choose . If indexing is not enabled, click Enable.
-
Configure field indexes and click OK. You can add field indexes manually or click Automatic Index Generation to generate indexes from the first log in the data collection preview.
Important-
Indexes apply only to log data written after index configuration. To query historical data, use the reindexing feature. Reindex logs for a Logstore.
-
To use analytic statements (SELECT), turn on Enable Analytics for the target fields when you configure indexes.
-
Simple Log Service automatically configures indexes for some reserved fields. Reserved fields.
In the Index Attributes dialog box, click Automatic Index Generation to generate field indexes. The generated fields include
body_bytes_sent(long),client_ip(text),host(text),http_host(text),http_user_agent(text),request_length(long), andrequest_method(text). Text fields use the default delimiters,"';=()[]{}?@&<>/:\n\t\r, with Case-Sensitive and Include Chinese disabled and Enable Analytics enabled. Click OK to confirm. -
Step 2: Query and analyze logs
Run search and analytic statements in the Search statement|Analytic statement format. A search statement can run independently, but an analytic statement must be combined with a search statement. Query and analyze logs.
By default, a query returns only 100 rows. Use the LIMIT clause to change the number of returned rows.
Search statement
-
Query log entries that contain Chrome:
Chrome -
Query log entries with a request duration greater than 60 seconds:
request_time > 60 -
Query log entries with a request duration between 60 and 120 seconds:
request_time in [60 120] -
Query successful GET requests (status code 200–299):
request_method : GET and status in [200 299] -
Query log entries where
request_uriis/request/path-2:request_uri:/request/path-2/file-2
Analysis statement
-
Calculate page views (PVs).
Use the count function to calculate total PVs.
* | SELECT count(*) AS PVThe result is a PV of
9685. -
Calculate PVs per minute.
Use the date_trunc function to truncate time by minute, the count function for PV counts per minute, and GROUP BY and ORDER BY to group and sort by time.
* | SELECT count(*) as PV, date_trunc('minute', __time__) as time GROUP BY time ORDER BY timeThe results are displayed as a line chart showing the PV trend per minute.
-
Calculate request counts per method in 5-minute intervals.
Use
__time__ - __time__ %300to truncate time to 5-minute intervals, the count function for request counts, and GROUP BY and ORDER BY to group and sort by time.* | SELECT request_method, count(*) as count, __time__ - __time__ %300 as time GROUP BY time, request_method ORDER BY timeExample result: 778 GET requests, 242 PUT requests, 231 POST requests, 101 DELETE requests, and 4 HEAD requests, all with a timestamp of 1610673300.
-
Compare this week's PVs with last week's.
Use the count function for total PVs and the ts_compare function to compare this week's PVs with last week's. In this statement,
website_logis the Logstore name.* | SELECT diff[1] as this_week, diff[2] as last_week, time FROM (SELECT ts_compare(pv, 604800) as diff, time FROM (SELECT COUNT(*) as pv, date_trunc('week', __time__) as time FROM website_log GROUP BY time ORDER BY time) GROUP BY time)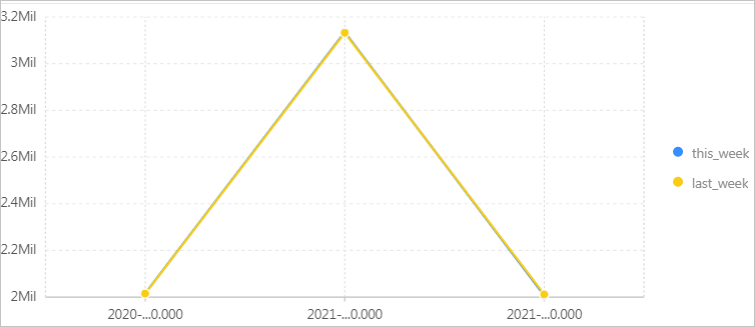
-
Analyze client IP address distribution by province.
Use the ip_to_province function to map IP addresses to provinces, and the count function for occurrence counts. Use GROUP BY and ORDER BY to group and sort results.
* | SELECT count(*) as count, ip_to_province(client_ip) as address GROUP BY address ORDER BY count DESCAn example of the query results: 451 requests from Guangdong province, 447 from Jiangsu province, 433 from Beijing, and 425 from Shandong province.
-
Find the top 10 most accessed request URIs.
Use GROUP BY to group results by request URI, the count function for access counts per URI, and ORDER BY to sort by count.
* | SELECT count(*) as PV, request_uri as PATH GROUP BY PATH ORDER BY PV DESC LIMIT 10After you execute the query statement, the example results show the top 10 request paths (PATH) and their corresponding visit counts (PV).
-
Query log entries where
request_uriends with%file-7.ImportantIn search statements, the wildcard characters asterisk (*) and question mark (?) support fuzzy searches but must appear in the middle or at the end of a word. To match fields that end with a specific string, use the LIKE operator in an analytic statement.
* | select * from website_log where request_uri like '%file-7'website_logis the Logstore name. -
Calculate access statistics by request URI.
Use the regexp_extract function to extract the file part from
request_uri, and the count function for access counts per URI.* | SELECT regexp_extract(request_uri, '.*\/(file.*)', 1) file, count(*) as count group by fileFor example, a result with a file value of
file-5and a count of17127means the file was accessed 17,127 times. -
Query log entries where
request_uricontains%abc%.* | SELECT * where request_uri like '%/%abc/%%' escape '/'The query returns the matching log entry. The value of the
request_urifield is/request/path-1/file-92 %abc%qereqwr, in which the%abc%part is the match.
Sample website access logs
__tag__:__client_ip__:192.0.2.0
__tag__:__receive_time__:1609985755
__source__:198.51.100.0
__topic__:website_access_log
body_bytes_sent:4512
client_ip:198.51.100.10
host:example.com
http_host:example.com
http_user_agent:Mozilla/5.0 (Macintosh; U; PPC Mac OS X 10_5_8; ja-jp) AppleWebKit/533.20.25 (KHTML, like Gecko) Version/5.0.4 Safari/533.20.27
http_x_forwarded_for:198.51.100.1
instance_id:i-02
instance_name:instance-01
network_type:vlan
owner_id:%abc%-01
referer:example.com
region:cn-shanghai
remote_addr:203.0.113.0
remote_user:neb
request_length:4103
request_method:POST
request_time:69
request_uri:/request/path-1/file-0
scheme:https
server_protocol:HTTP/2.0
slbid:slb-02
status:200
time_local:07/Jan/2021:02:15:53
upstream_addr:203.0.113.10
upstream_response_time:43
upstream_status:200
user_agent:Mozilla/5.0 (X11; Linux i686) AppleWebKit/534.33 (KHTML, like Gecko) Ubuntu/9.10 Chromium/13.0.752.0 Chrome/13.0.752.0 Safari/534.33
vip_addr:192.0.2.2
vpc_id:3db327b1****82df19818a72