SPL instructions
Simple Log Service Processing Language (SPL) provides instructions for transforming and visualizing time series data.
SPL instructions
|
Instruction |
Description |
|
Transforms table data into a series. |
|
|
Renders an SPL query result as a chart for visualization. |
make-series
Converts table data into a series structure.
Syntax
| make-series  <output> = <field-col> [default = <default-value>]
             [, ...]
             on <time-col>
             [from <time-begin> to <time-end>
              step <step-value>]
             [by <tag-col>,...]
Instruction block
|
Instruction block |
Required |
Description |
|
<output> = <field-col> , ... |
Yes |
The columns to convert into a series. You can specify multiple columns. |
|
on <time-col> |
Yes |
The time column. |
|
[default = <default-value>] & [from <time-begin> to <time-end> step <step-value>] |
No |
Fills missing values by specifying a time range, step, and filling strategy based on the time column. |
|
[by <tag-col>,...] |
No |
Groups data by the specified columns for aggregation. |
Parameters
|
Parameter |
Type |
Description |
|
output |
Column name |
The output column after aggregation. |
|
field-col |
Column name |
The input column. |
|
default-value |
String |
The method for filling missing values. Valid values:
|
|
time-col |
Column name |
The input time column. |
|
time-begin |
String or Column name |
The start of the time range for the series. Valid values:
|
|
time-end |
String or Column name |
The end of the time range for the series. Valid values:
|
|
step-value |
String |
The step for filling missing values. Supported units: |
|
tag-col |
Column name |
The column to group by for aggregation. |
Examples
Create a timeline from the raw data and fill in missing values.
-
Raw data
For each
Method, this query aligns timestamps to a 60-second window and calculates aggregated metrics.-
SPL statement
* | extend ts = second_to_nano(__time__ - __time__ % 60) | stats latency_avg = avg(cast(latency as double)), inflow_avg = avg(cast (inflow as double)) by ts, Method -
Output
The query returns a table with four columns: Method, ts, latency_avg, and inflow_avg. Data is grouped by Method and shows statistics for API methods such as DeleteMachineGroup, GetCursor, GetConsumerGroupCheckPoint, PostProjectQuery, PullData, and TagResources. The table includes nanosecond timestamps, average latency, and average inflow values.
-
-
SPL statement
* | extend ts = second_to_nano(__time__ - __time__ % 60) | stats latency_avg = max(cast(latency as double)), inflow_avg = min(cast (inflow as double)) by ts, Method | make-series latency_avg default = 'last', inflow_avg default = 'last' on ts from 'min' to 'max' step '1m' by Method -
Output
The result table has four columns: Method, __ts__, latency_arr, and inflow_arr. Data is grouped by Method, showing rows for methods such as
PullDataandUpdateMachineGroupMachinewith their corresponding array values. Thelatency_arrandinflow_arrcolumns contain the time series data as arrays.
render
Renders an SPL query result as a chart for visualization.
-
The
renderinstruction must be the last operator in the SPL query. -
The
renderinstruction does not modify the data. It adds visualization parameters to the extended properties of the query result.
Syntax
render visualization [with ( propertyName = propertyValue [, ...])]Instruction block
|
Instruction block |
Required |
Description |
|
visualization |
Yes |
Specifies the visualization chart type. For supported types, see Visualization. |
|
propertyName = propertyValue |
No |
A comma-separated list of key-value pairs. For supported types, see Properties. |
Parameters
Visualization
|
Visualization |
Description |
|
linechart |
Line chart |
Properties
Use optional PropertyName/PropertyValue key-value pairs to configure additional chart rendering options.
Time series forecast parameters
|
PropertyName |
PropertyValue |
|
xcolumn |
The column in the query result to use as the x-axis. |
|
ycolumns |
A comma-separated list of column names in the query result to use as the y-axis. |
For example:
... ...
| render linechart with (xcolumn=time_series,
                         ycolumns=metric_series, forecast_metric_series)
Anomaly detection parameters
|
PropertyName |
PropertyValue |
|
xcolumn |
The column in the query result to use as the x-axis. |
|
ycolumns |
A comma-separated list of column names in the query result to use as the y-axis. |
|
anomalyscore |
Displays the anomaly score for anomalous data points. Applies only to |
|
anomalytype |
Displays the anomaly type for anomalous data points. Applies only to |
For example:
... ...
| render linechart with (xcolumn=ts,
                         ycolumns=mem_arr, cpu_arr,
                         anomalyscore = anomalies_score_series,
                         anomalytype = anomalies_type_series)
Examples
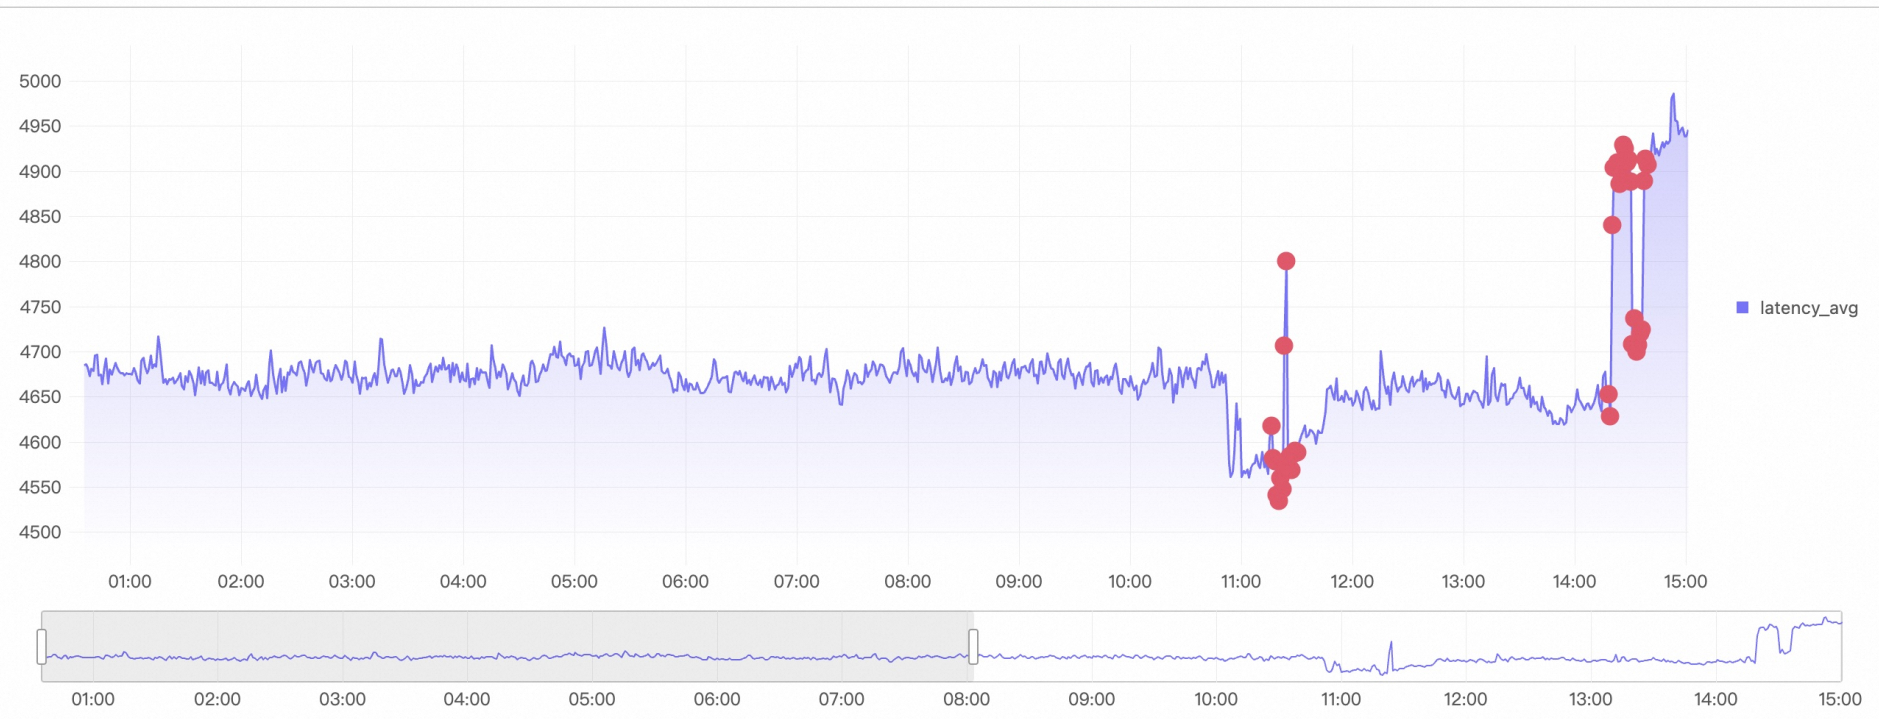
This example detects anomalies across all timelines, retains the anomaly scores from the last 5 minutes, and renders the result as an anomaly detection chart.
-
SPL statement
* | extend ts= (__time__- __time__%60)*1000000000 | where Method='PostLogStoreLogs' | stats latency_avg=avg(cast( Latency as bigint)) by ts, Method | make-series latency_avg = latency_avg default = 'null' on ts from 'min' to 'max' step '1m' by Method | extend ret = series_decompose_anomalies(latency_avg) | extend anomalies_score_series = ret.anomalies_score_series, anomalies_type_series = ret.anomalies_type_series, error_msg = ret.error_msg | render linechart with (xcolumn=__ts__, ycolumns=latency_avg, anomalyscore = anomalies_score_series, anomalytype = anomalies_type_series) -
Output