
本文介绍如何通过Terraform管理Prometheus Monitoring(包括ServiceMonitor、PodMonitor、自定义Job和健康巡检Probe)配置。
前提条件
已创建Prometheus for容器服务或for ECS实例。具体操作,请参见使用Terraform管理Prometheus实例。
安装Terraform。
Cloud Shell默认安装配置了Terraform和阿里云账号信息,您无需执行任何额外配置。
如果您不使用Cloud Shell,关于安装Terraform的具体操作,请参见在本地安装和配置Terraform。
说明请确认Terraform版本不低于v0.12.28,可通过terraform --version命令查看Terraform版本。
资源编排服务为Terraform提供了托管的能力,您可以创建Terraform类型的模板,定义阿里云、AWS或Azure资源,配置资源参数和资源间的依赖关系。更多信息,请参见创建Terraform类型模板、创建Terraform类型资源栈。
配置阿里云账号信息。有以下两种方式:
方式一:创建环境变量,用于存放身份认证信息。
export ALICLOUD_ACCESS_KEY="************" export ALICLOUD_SECRET_KEY="************" export ALICLOUD_REGION="cn-beijing"说明其中,
export ALICLOUD_REGION参数的值需要您根据实际情况进行替换。方式二:通过在配置文件的Provider代码块中指定身份认证信息。
provider "alicloud" { access_key = "************" secret_key = "************" region = "cn-beijing" }说明其中,
export ALICLOUD_REGION参数的值需要您根据实际情况进行替换。
使用限制
对于Prometheus for 容器服务实例:支持ServiceMonitor、PodMonitor、自定义Job和健康巡检Probe。
对于Prometheus for ECS实例:由于实例类型限制,仅支持自定义Job和健康巡检Probe。
健康巡检Probe:
暂不支持状态(Status)设置。
Probe名称的命名规则:
自定义名-{tcp/http/ping}-blackbox,例如TCP类型巡检为xxx-tcp-blackbox。对于Prometheus for ECS实例,由于是全托管实例,故Probe命名空间必须为空或固定值(
vpcId-userId,例如vpc-0jl4q1q2of2tagvwxxxx-11032353609xxxx)。
新增Prometheus实例Monitoring
新增ServiceMonitor
创建一个工作目录,并在工作目录中创建名为main.tf的配置文件。
provider "alicloud" { }执行以下命令,初始化Terraform运行环境。
terraform init预期输出:
Initializing the backend... Initializing provider plugins... - Checking for available provider plugins... - Downloading plugin for provider "alicloud" (hashicorp/alicloud) 1.90.1... ... You may now begin working with Terraform. Try running "terraform plan" to see any changes that are required for your infrastructure. All Terraform commands should now work. If you ever set or change modules or backend configuration for Terraform, rerun this command to reinitialize your working directory. If you forget, other commands will detect it and remind you to do so if necessary.导入Monitoring资源。
将Monitoring资源添加到main.tf文件中。
#Prometheus实例的ServiceMonitor配置。
resource "alicloud_arms_prometheus_monitoring" "myServiceMonitor1" {
  cluster_id       = "c77e1106f429e4b46b0ee1720cxxxxx"   #Prometheus实例Id
  status      = "run"   #serviceMonitor的状态
  type        = "serviceMonitor"
  config_yaml = <<-EOT
					apiVersion: monitoring.coreos.com/v1
					kind: ServiceMonitor
					metadata:
					  name: tomcat-demo    #serviceMonitor名称
					  namespace: default   #serviceMonitor所在的命名空间
					spec:
					  endpoints:
					    - interval: 30s    #指标抓取间隔(秒)
					      path: /metrics   #指标抓取路径
					      port: tomcat-monitor   #指标抓取端口名
					  namespaceSelector:
					    any: true           #service命名空间选择配置
					  selector:
					    matchLabels:
					      app: tomcat       #service label选择配置
			EOT
}
执行以下命令,生成资源规划。
terraform plan预期输出:
Terraform used the selected providers to generate the following execution plan. Resource actions are indicated with the following symbols: + create Terraform will perform the following actions: # alicloud_arms_prometheus_monitoring.myServiceMonitor1 will be created + resource "alicloud_arms_prometheus_monitoring" "myServiceMonitor1" { + cluster_id = "c77e1106f429e4b46b0ee1720cxxxxx" + id = (known after apply) + monitoring_name = (known after apply) + status = "run" + type = "serviceMonitor" + config_yaml = <<-EOT apiVersion: monitoring.coreos.com/v1 kind: ServiceMonitor metadata: name: tomcat-demo namespace: default spec: endpoints: - interval: 30s path: /metrics port: tomcat-monitor namespaceSelector: any: true selector: matchLabels: app: tomcat EOT } Plan: 1 to add, 0 to change, 0 to destroy.执行以下命令,创建ServiceMonitor。
terraform apply预期输出:
Terraform used the selected providers to generate the following execution plan. Resource actions are indicated with the following symbols:
  + create

Terraform will perform the following actions:

  # alicloud_arms_prometheus_monitoring.myServiceMonitor1 will be created
  + resource "alicloud_arms_prometheus_monitoring" "myServiceMonitor1" {
      + cluster_id        = "c77e1106f429e4b46b0ee1720c9xxxxx"
      + id                = (known after apply)
      + monitoring_name = (known after apply)
  		+ status      = "run"
 			+ type        = "serviceMonitor"
			+ config_yaml = <<-EOT
						apiVersion: monitoring.coreos.com/v1
						kind: ServiceMonitor
						metadata:
						  name: tomcat-demo
						  namespace: default
						spec:
						  endpoints:
						    - interval: 30s
						      path: /metrics
						      port: tomcat-monitor
						  namespaceSelector:
						    any: true
						  selector:
						    matchLabels:
						      app: tomcat
        EOT
    }

Plan: 1 to add, 0 to change, 0 to destroy.

Do you want to perform these actions?
  Terraform will perform the actions described above.
  Only 'yes' will be accepted to approve.

  Enter a value: yes
若结果输出出现
yes,表示当前Prometheus实例的ServiceMonitor配置创建成功。
结果验证
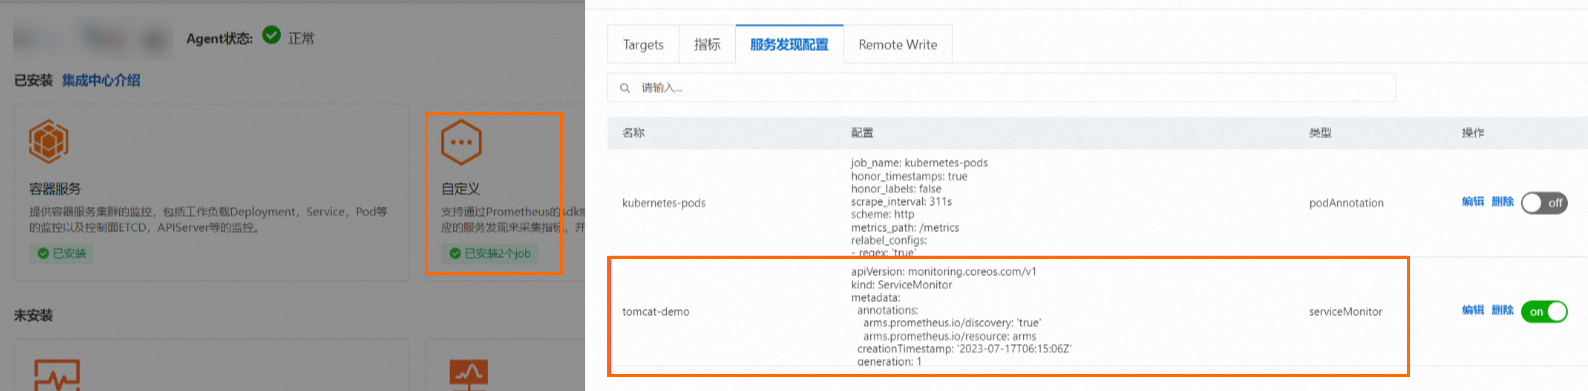
您可以登录可观测监控 Prometheus 版控制台,然后在Prometheus实例的集成中心页面,查看已成功创建的ServiceMonitor配置。具体操作如下:
登录ARMS控制台。
在左侧导航栏选择,进入可观测监控 Prometheus 版的实例列表页面。
- 单击目标Prometheus实例名称,进入集成中心页面。
单击已安装区域的自定义组件卡片,然后在弹出的面板中单击服务发现配置页签,查看已成功创建的ServiceMonitor配置。
新增PodMonitor
创建一个工作目录,并在工作目录中创建名为main.tf的配置文件。
provider "alicloud" { }执行以下命令,初始化Terraform运行环境。
terraform init预期输出:
Initializing the backend... Initializing provider plugins... - Checking for available provider plugins... - Downloading plugin for provider "alicloud" (hashicorp/alicloud) 1.90.1... ... You may now begin working with Terraform. Try running "terraform plan" to see any changes that are required for your infrastructure. All Terraform commands should now work. If you ever set or change modules or backend configuration for Terraform, rerun this command to reinitialize your working directory. If you forget, other commands will detect it and remind you to do so if necessary.导入Monitoring资源。
将Monitoring资源添加到main.tf文件中。
#Prometheus实例的PodMonitor配置。
resource "alicloud_arms_prometheus_monitoring" "myPodMonitor1" {
  cluster_id       = "c77e1106f429e4b46b0ee1720cxxxxx"  #Prometheus实例Id
  status      = "run"  #podMonitor的状态
  type        = "podMonitor"
  config_yaml = <<-EOT
			apiVersion: "monitoring.coreos.com/v1"
			kind: "PodMonitor"
			metadata:
			  name: "podmonitor-demo"  #podMonitor名称
			  namespace: "default"     #podMonitor所在的命名空间
			spec:
			  namespaceSelector:
			    any: true              #pod命名空间选择配置
			  podMetricsEndpoints:
			    - interval: "30s"      #指标抓取间隔(秒)
			      path: "/metrics"     #指标抓取路径
			      port: "tomcat-monitor"  #指标抓取端口名
			  selector:
			    matchLabels:
			      app: "nginx2-exporter"   #pod label选择配置
			EOT
}
执行以下命令,生成资源规划。
terraform plan预期输出:
Terraform used the selected providers to generate the following execution plan. Resource actions are indicated with the following symbols: + create Terraform will perform the following actions: # alicloud_arms_prometheus_monitoring.myPodMonitor1 will be created + resource "alicloud_arms_prometheus_monitoring" "myPodMonitor1" { + cluster_id = "c77e1106f429e4b46b0ee1720cxxxxx" + id = (known after apply) + monitoring_name = (known after apply) + status = "run" + type = "podMonitor" + config_yaml = <<-EOT apiVersion: "monitoring.coreos.com/v1" kind: "PodMonitor" metadata: name: "podmonitor-demo" namespace: "default" spec: namespaceSelector: any: true podMetricsEndpoints: - interval: "30s" path: "/metrics" port: "tomcat-monitor" selector: matchLabels: app: "nginx2-exporter" EOT } Plan: 1 to add, 0 to change, 0 to destroy.执行以下命令,创建PodMonitor。
terraform apply预期输出:
Terraform used the selected providers to generate the following execution plan. Resource actions are indicated with the following symbols:
  + create

Terraform will perform the following actions:

  # alicloud_arms_prometheus_monitoring.myPodMonitor1 will be created
  + resource "alicloud_arms_prometheus_monitoring" "myPodMonitor1" {
      + cluster_id        = "c77e1106f429e4b46b0ee1720c9xxxxx"
      + id                = (known after apply)
      + monitoring_name = (known after apply)
  		+ status      = "run"
 			+ type        = "podMonitor"
			+ config_yaml = <<-EOT
						apiVersion: "monitoring.coreos.com/v1"
						kind: "PodMonitor"
						metadata:
						  name: "podmonitor-demo"
						  namespace: "default"
						spec:
						  namespaceSelector:
						    any: true
						  podMetricsEndpoints:
						    - interval: "30s"
						      path: "/metrics"
						      port: "tomcat-monitor"
						  selector:
						    matchLabels:
						      app: "nginx2-exporter"
        EOT
    }

Plan: 1 to add, 0 to change, 0 to destroy.

Do you want to perform these actions?
  Terraform will perform the actions described above.
  Only 'yes' will be accepted to approve.

  Enter a value: yes
若结果输出出现
yes,表示当前Prometheus实例的PodMonitor配置创建成功。
结果验证
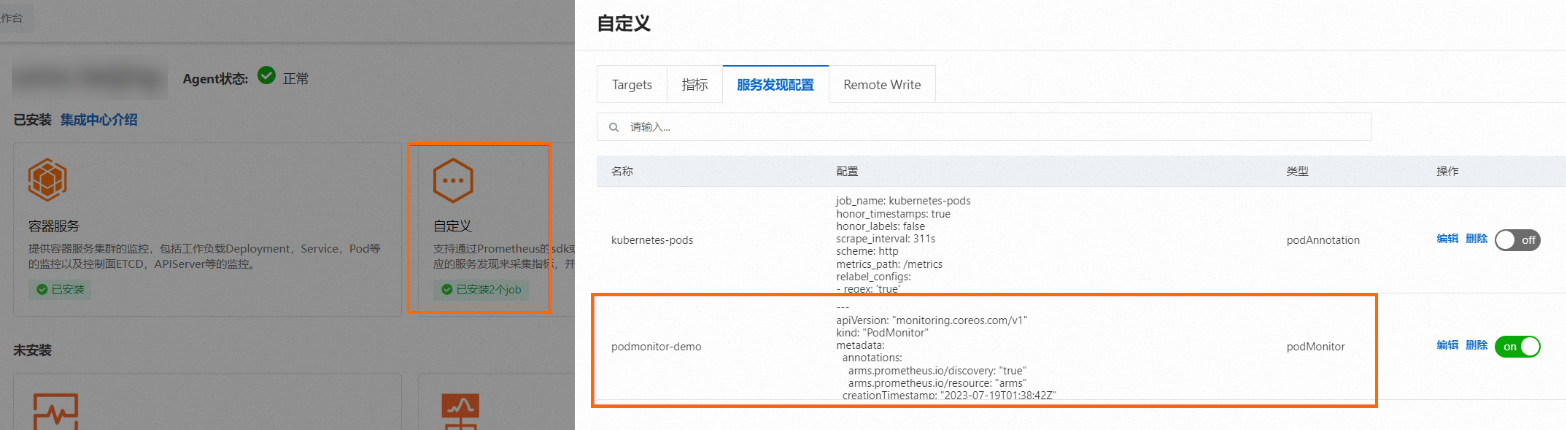
您可以登录可观测监控 Prometheus 版控制台,然后在Prometheus实例的集成中心页面,查看已成功创建的PodMonitor配置。具体操作如下:
登录ARMS控制台。
在左侧导航栏选择,进入可观测监控 Prometheus 版的实例列表页面。
- 单击目标Prometheus实例名称,进入集成中心页面。
单击已安装区域的自定义组件卡片,然后在弹出的面板中单击服务发现配置页签,查看已成功创建的PodMonitor配置。
新增自定义Job(CustomJob)
创建一个工作目录,并在工作目录中创建名为main.tf的配置文件。
provider "alicloud" { }执行以下命令,初始化Terraform运行环境。
terraform init预期输出:
Initializing the backend... Initializing provider plugins... - Checking for available provider plugins... - Downloading plugin for provider "alicloud" (hashicorp/alicloud) 1.90.1... ... You may now begin working with Terraform. Try running "terraform plan" to see any changes that are required for your infrastructure. All Terraform commands should now work. If you ever set or change modules or backend configuration for Terraform, rerun this command to reinitialize your working directory. If you forget, other commands will detect it and remind you to do so if necessary.导入Monitoring资源。
将Monitoring资源添加到main.tf文件中。
#Prometheus实例的自定义Job配置。
resource "alicloud_arms_prometheus_monitoring" "myCustomJob1" {
  cluster_id       = "c77e1106f429e4b46b0ee1720cxxxxx"  #Prometheus实例Id
  status      = "run"     #customJob的状态
  type        = "customJob"
  config_yaml = <<-EOT
			scrape_configs:
			  - job_name: prometheus1    #customJob名称
			    honor_timestamps: false
			    honor_labels: false
			    scheme: http
			    metrics_path: /metric
			    static_configs:
			      - targets:
			          - 127.0.0.1:9090
			EOT
}
执行以下命令,生成资源规划。
terraform plan预期输出:
Terraform used the selected providers to generate the following execution plan. Resource actions are indicated with the following symbols: + create Terraform will perform the following actions: # alicloud_arms_prometheus_monitoring.myCustomJob1 will be created + resource "alicloud_arms_prometheus_monitoring" "myCustomJob1" { + cluster_id = "c77e1106f429e4b46b0ee1720cxxxxx" + id = (known after apply) + monitoring_name = (known after apply) + status = "run" + type = "customJob" + config_yaml = <<-EOT scrape_configs: - job_name: prometheus1 honor_timestamps: false honor_labels: false scheme: http metrics_path: /metric static_configs: - targets: - 127.0.0.1:9090 EOT } Plan: 1 to add, 0 to change, 0 to destroy.执行以下命令,创建自定义Job。
terraform apply预期输出:
Terraform used the selected providers to generate the following execution plan. Resource actions are indicated with the following symbols:
  + create

Terraform will perform the following actions:

  # alicloud_arms_prometheus_monitoring.myCustomJob1 will be created
  + resource "alicloud_arms_prometheus_monitoring" "myCustomJob1" {
      + cluster_id        = "c77e1106f429e4b46b0ee1720c9xxxxx"
      + id                = (known after apply)
      + monitoring_name = (known after apply)
  		+ status      = "run"
 			+ type        = "customJob"
			+ config_yaml = <<-EOT
						scrape_configs:
						  - job_name: prometheus1
						    honor_timestamps: false
						    honor_labels: false
						    scheme: http
						    metrics_path: /metric
						    static_configs:
						      - targets:
						          - 127.0.0.1:9090
        EOT
    }

Plan: 1 to add, 0 to change, 0 to destroy.

Do you want to perform these actions?
  Terraform will perform the actions described above.
  Only 'yes' will be accepted to approve.

  Enter a value: yes
若结果输出出现
yes,表示当前Prometheus实例的自定义Job配置创建成功。
结果验证
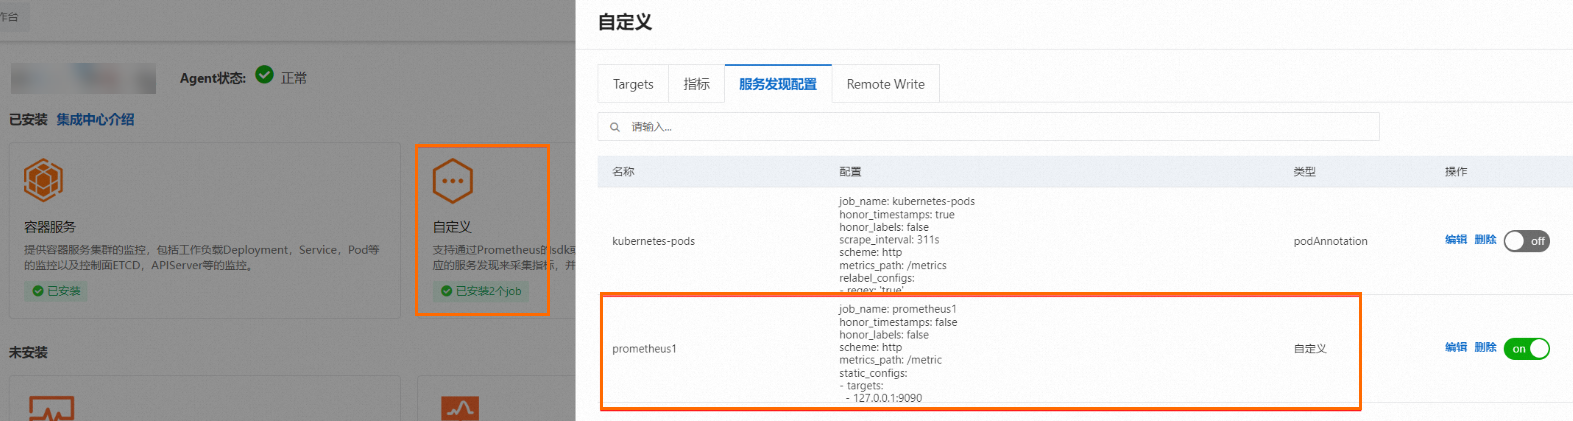
您可以登录可观测监控 Prometheus 版控制台,然后在Prometheus实例的集成中心页面,查看已成功创建自定义Job配置。具体操作如下:
登录ARMS控制台。
在左侧导航栏选择,进入可观测监控 Prometheus 版的实例列表页面。
- 单击目标Prometheus实例名称,进入集成中心页面。
单击已安装区域的自定义组件卡片,然后在弹出的面板中单击服务发现配置页签,查看已成功创建的自定义Job配置。
新增健康巡检Probe
创建一个工作目录,并在工作目录中创建名为main.tf的配置文件。
provider "alicloud" { }执行以下命令,初始化Terraform运行环境。
terraform init预期输出:
Initializing the backend... Initializing provider plugins... - Checking for available provider plugins... - Downloading plugin for provider "alicloud" (hashicorp/alicloud) 1.90.1... ... You may now begin working with Terraform. Try running "terraform plan" to see any changes that are required for your infrastructure. All Terraform commands should now work. If you ever set or change modules or backend configuration for Terraform, rerun this command to reinitialize your working directory. If you forget, other commands will detect it and remind you to do so if necessary.导入Monitoring资源。
将Monitoring资源添加到main.tf文件中。
#Prometheus实例的Probe配置。
resource "alicloud_arms_prometheus_monitoring" "myProbe1" {
  cluster_id       = "c77e1106f429e4b46b0ee1720cxxxxx"  #Prometheus实例Id
  type        = "probe"
  config_yaml = <<-EOT
			apiVersion: monitoring.coreos.com/v1
			kind: Probe
			metadata:
				name: name1-tcp-blackbox  #健康巡检名称,规则:xxx-{tcp/http/ping}-blackbox
				namespace: arms-prom #可选
			spec:
				interval: 30s         #健康巡检间隔
				jobName: blackbox     #固定值
				module: tcp_connect
				prober:               #prober配置,固定值
					path: /blackbox/probe
					scheme: http
					url: 'localhost:9335'
				targets:
					staticConfig:
						static:
							- 'arms-prom-admin.arms-prom:9335'  #健康巡检目标地址
			EOT
}
执行以下命令,生成资源规划。
terraform plan预期输出:
Terraform used the selected providers to generate the following execution plan. Resource actions are indicated with the following symbols: + create Terraform will perform the following actions: # alicloud_arms_prometheus_monitoring.myProbe1 will be created + resource "alicloud_arms_prometheus_monitoring" "myProbe1" { + cluster_id = "c77e1106f429e4b46b0ee1720cxxxxx" + id = (known after apply) + monitoring_name = (known after apply) + type = "probe" + config_yaml = <<-EOT apiVersion: monitoring.coreos.com/v1 kind: Probe metadata: name: name1-tcp-blackbox namespace: arms-prom spec: interval: 30s jobName: blackbox module: tcp_connect prober: path: /blackbox/probe scheme: http url: 'localhost:9335' targets: staticConfig: static: - 'arms-prom-admin.arms-prom:9335' EOT } Plan: 1 to add, 0 to change, 0 to destroy. Plan: 1 to add, 0 to change, 0 to destroy.执行以下命令,创建健康巡检Probe。
terraform apply预期输出:
Terraform used the selected providers to generate the following execution plan. Resource actions are indicated with the following symbols:
  + create

Terraform will perform the following actions:

  # alicloud_arms_prometheus_monitoring.myProbe1 will be created
  + resource "alicloud_arms_prometheus_monitoring" "myProbe1" {
      + cluster_id        = "c77e1106f429e4b46b0ee1720c9xxxxx"
      + id                = (known after apply)
      + monitoring_name = (known after apply)
  		+ type        = "probe"
			+ config_yaml = <<-EOT
						apiVersion: monitoring.coreos.com/v1
						kind: Probe
						metadata:
						  name: name1-tcp-blackbox
						  namespace: arms-prom
						spec:
						  interval: 30s
						  jobName: blackbox
						  module: tcp_connect
						  prober:
						    path: /blackbox/probe
						    scheme: http
						    url: 'localhost:9335'
						  targets:
						    staticConfig:
						      static:
						        - 'arms-prom-admin.arms-prom:9335'
        EOT
    }

Plan: 1 to add, 0 to change, 0 to destroy.

Do you want to perform these actions?
  Terraform will perform the actions described above.
  Only 'yes' will be accepted to approve.

  Enter a value: yes
若结果输出出现
yes,表示当前Prometheus实例的健康巡检Probe配置创建成功。
结果验证
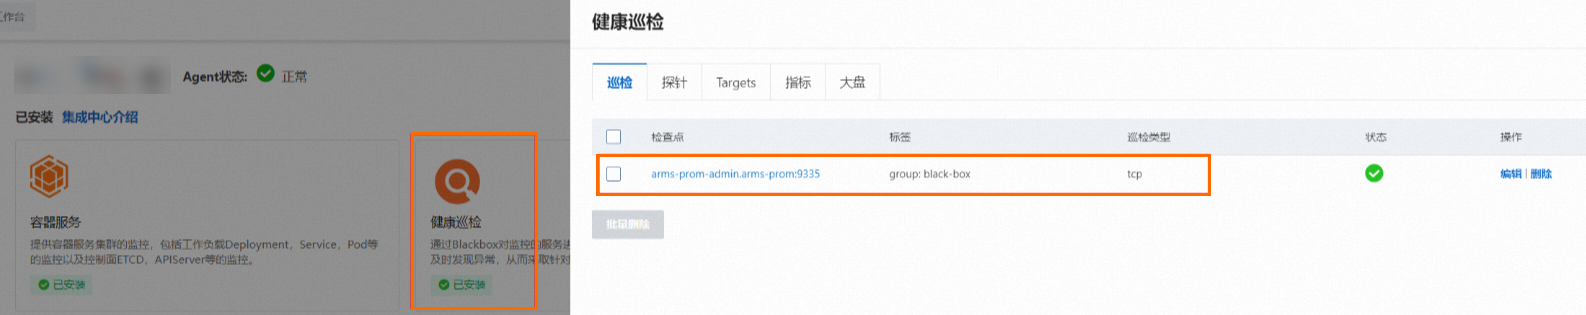
您可以登录可观测监控 Prometheus 版控制台,然后在Prometheus实例的集成中心页面,查看已成功创建的健康巡检Probe配置。具体操作如下:
登录ARMS控制台。
在左侧导航栏选择,进入可观测监控 Prometheus 版的实例列表页面。
- 单击目标Prometheus实例名称,进入集成中心页面。
单击已安装区域的健康巡检组件卡片,然后在巡检页签,查看已成功创建的健康巡检Probe配置。
删除Prometheus实例Monitoring
操作步骤
您可以执行以下命令删除通过Terraform创建的集群。
terraform destroy预期输出
...
Do you really want to destroy all resources?
  Terraform will destroy all your managed infrastructure, as shown above.
  There is no undo. Only 'yes' will be accepted to confirm.

  Enter a value: yes
...
Destroy complete! Resources: 1 destroyed.
结果验证
您可以登录可观测监控 Prometheus 版控制台,然后在Prometheus实例的集成中心页面,查看Monitoring配置已被成功删除。
登录ARMS控制台。
在左侧导航栏选择,进入可观测监控 Prometheus 版的实例列表页面。
- 单击目标Prometheus实例名称,进入集成中心页面。
单击已安装区域的自定义/健康巡检组件卡片,然后在服务发现配置/巡检页签,您可以看到已不存在目标Monitoring配置信息,表示该Monitoring配置已被成功删除。