
使用专家系统分析报告
1. 专家系统
专家系统是Asight Systems中的一个智能分析系统,可以帮助识别常见的性能问题。专家系统分析报告中事件,并提出优化建议,以便能够更有效地进行性能优化。
1.1 从GUI端使用专家系统
GUI中可以从下方tab切换到专家系统页面,如下所示:
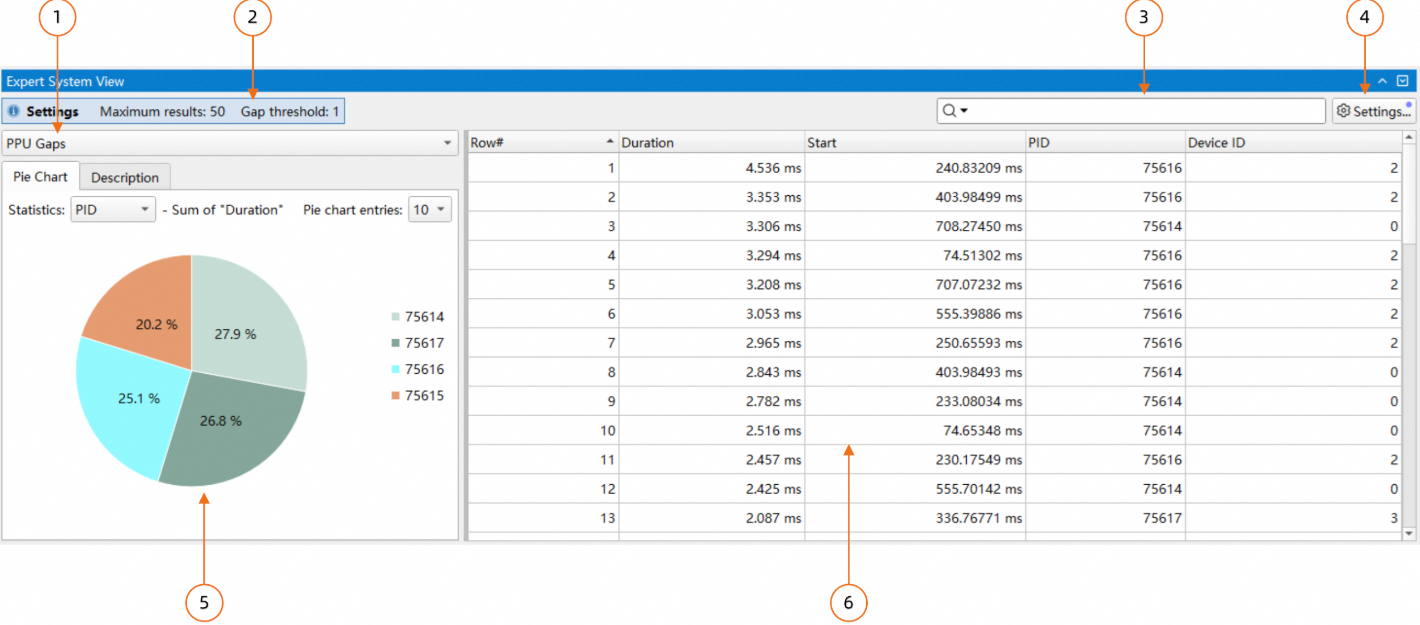
规则列表,可以在此选择分析规则;
当前生效的参数配置,是鼠标悬停时会显示详细的参数信息;
搜索框,支持搜索和过滤两种模式;
规则参数配置对话框,可以在此改变当前规则的配置;
当前规则分析结果的饼图,以及相关的优化建议,通过顶部tab切换;
当前规则的分析结果,可以通过右键菜单导出分析结果;
1.1.1 设置分析区间
可以通过Timeline View的filter功能指定一个时间区间,专家系统只会对该时间区间内的事件进行分析。在Timeline View中按住鼠标左键拖动,在选定的区间内打开右键菜单,点击“Filter and Zoom in”,即可设置统计区间。
1.1.2 跳转至Timeline View
对于部分规则,支持跳转至Timeline View,可以通过右键菜单选择跳转的方式。
1.1.3 分析结果的饼图
规则的分析结果除了以表格的形式展示外,专家系统还支持以饼图的形式展示结果:
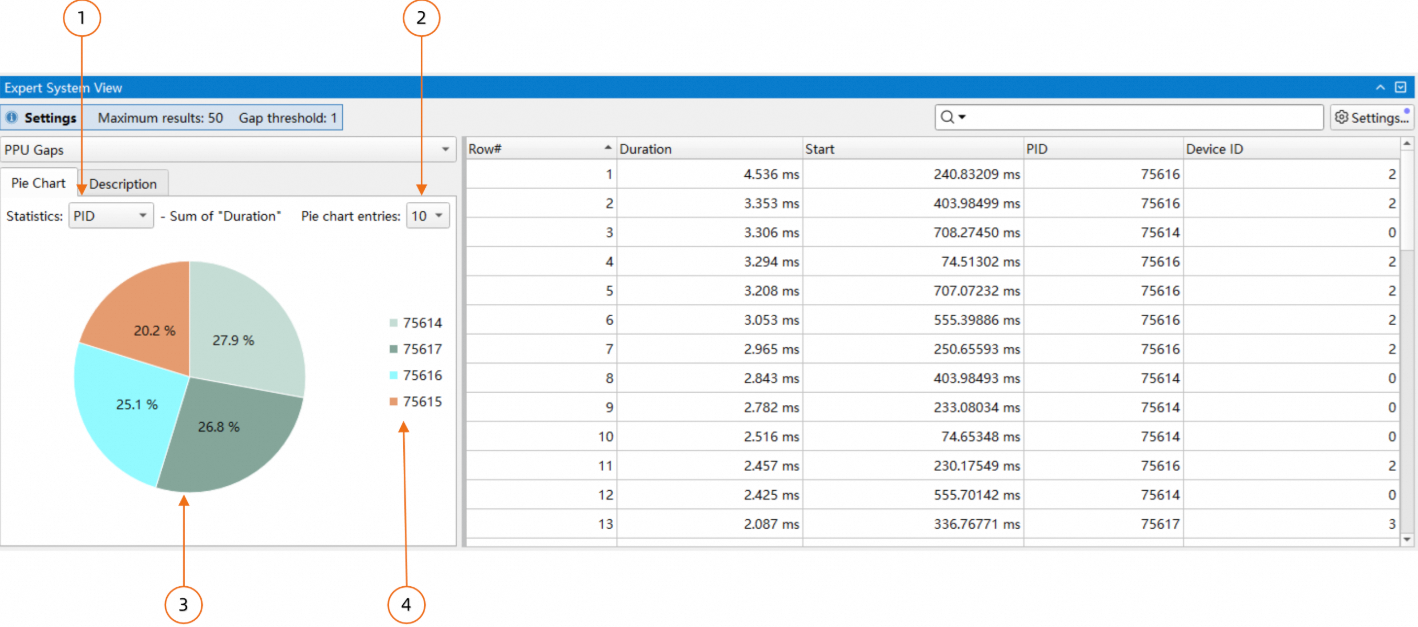
上图中:
当前饼图实现的是以"PID"为key,将右侧的表格的每一行进行分类,每一类将"Duration"这一列的值进行累加,最终计算"Duration"的时间占比显示在饼图中。这里的key可以通过组合框进行选择;
设置显示的扇形数量;
饼图,每个扇形显示的百分比是每PID的duration占整体duration的时间占比;
图例,上图中显示的PID,并按duration的降序排列;
饼图中的扇形支持点击,点击后表格只会显示对应key的行。如下图所示:
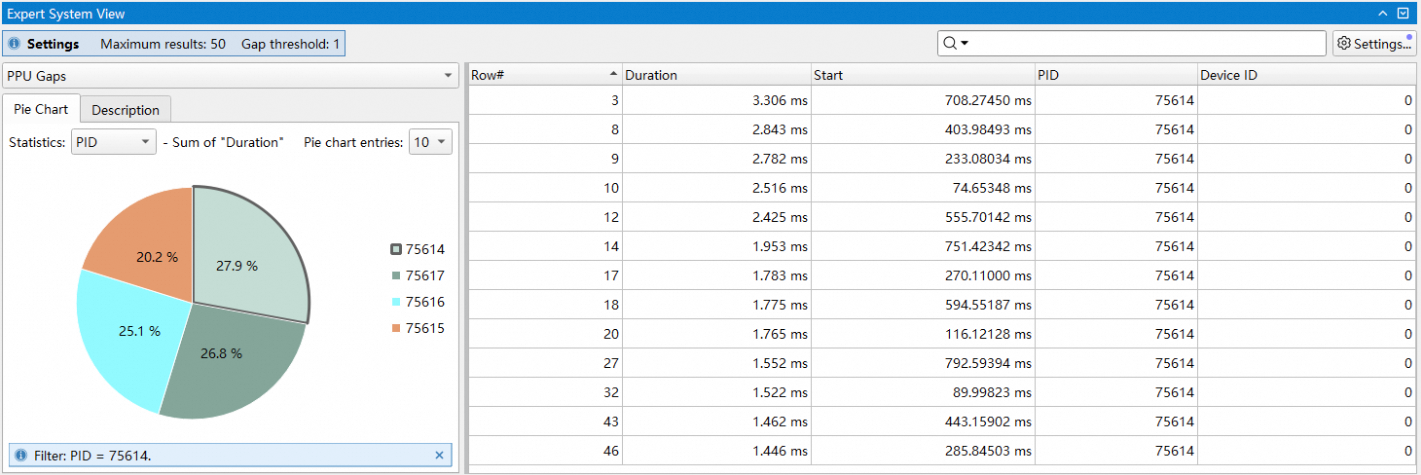
上图中,点击了PID为75614的扇形,因此在右侧表格中只会显示PID为75614的项,其他项被隐藏。再次点击扇形或饼图空白部分表格会复位。
1.2 从命令行端使用专家系统
可以通过执行asys analyze子命令,使用asys专家系统对asysrep文件进行分析,生成一系列分析报告。asys analyze子命令的使用方式为:asys analyze [option] <file.asysrep>。
1.2.1 指定报告分析类型
asys analyze支持多种报告分析类型,通过asys analyze --help-rules ALL可查看分析类型的详细说明。
通过--rule选项可指定报告分析类型,该选项可以多次指定,也可以使用逗号分隔列表来指定多个分析类型。如果未指定报告分析类型,将使用默认报告分析类型来生成报告。
例如:指定使用ppu_gaps和ppu_time_util报告分析类型生成报告:
asys analyze --rule ppu_gaps,ppu_time_util report.asysrep1.2.2 指定报告输出格式
asys analyze支持通过--format选项,指定统计报告输出格式。通过asys analyze --help-formats ALL可查看支持的输出格式和帮助信息。
column:输出到终端的默认格式,按照列表方式打印,易于阅读的输出格式,支持选项列举如下:
设置单位:设置输出数据的单位和精度
csv:输出到文件的默认格式,按照csv表格格式打印,易于导出表格以后续处理,支持选项列举如下:
设置单位:设置输出数据的单位和精度
设置单位选项允许指定显示指定种类数据时使用的单位,支持的种类和单位选项列举如下:
ratio:比例 / 百分比类型数据,支持的单位:%或者.1%:精确到小数点后一位.2%:精确到小数点后两位.3%:精确到小数点后三位
例如指定按照列表方式输出,ratio种类数据精确到小数点后三位:
asys analyze -r ppu_time_util --format column:ratio=.3% report.asysrep1.2.3 指定报告输出类型
通过--output选项可指定报告输出的输出类型,目前有3种输出类型: 打印到console控制台,输出到文件,或者输出到命令。不指定默认打印到控制台。
通过--output %指定输出类型%表示输出到控制台console,例如:
asys analyze --output % --rule ppu_gaps report.asysrep通过--output指定输出类型为输出到asysrep报告所在目录,则asys将会根据asysrep报告文件名、指定的报告分析类型和输出格式生成报告输出的文件名,输出文件名格式为:<report_name>_<rule_name>.<format>。例如指定--output在报告所在目录生成report.asysrep的ppu_gaps分析类型的分析报告,本地报告文件名称为report_ppu_gaps.csv:
asys analyze --output . --rule ppu_gaps report.asysrep通过--output @post_command指定输出结果通过post_command进行二次处理,分析报告的内容将通过管道传输到给定的命令。例如:通过grep 1142417匹配结果包含关键字1142417的结果:
asys analyze --output "@grep 1142417" --rule ppu_gaps report.asysrep1.2.4 指定统计时间范围
可通过--filter-time选项指定统计的时间范围,时间格式为开始时间/结束时间,单位为纳秒,时间指从采集开始的偏移时间,其中开始时间或者结束时间可以省略一种。例如指定统计从第10秒到第20秒的跟踪数据:
asys analyze --filter-time 10000000000/20000000000 --rule ppu_gaps report.asysrep可通过--filter-hgtx选项通过HGTX标注指定统计的时间范围,当--filter-hgtx选项被指定时,将忽略--filter-time选项。
使用--filter-hgtx选项可指定匹配的HGTX range的名称、domain和匹配索引,格式为range_name@domain/index,若匹配的HGTX range不存在domain,则@domain可省略,否则@domain需要指定。
默认asys将使用匹配的第一个HGTX range作为统计的时间范围,此时/index部分可省略,若需要指定匹配索引,则通过/index指定,索引从0开始。
例如:使用名称为self_attention的HGTX range指定统计时间范围,无domain,使用首个匹配的HGTX range的时间范围。
asys analyze --filter-hgtx self_attention --rule ppu_gaps report.asysrep例如:使用名称为pcclGroupEnd的HGTX range指定统计时间范围,domain为NCCL,使用第9个匹配的HGTX range的时间范围(索引为8)。
asys analyze --filter-hgtx "pcclGroupEnd@NCCL/8" --rule ppu_gaps report.asysrepTips:
asys analyze输出的时间戳信息可能由于
--rule选项不同而不同。若希望统一时间戳信息,可指定选项--ts-normalize true使能转换时间戳为UTC时间。asys analyze支持通过选项
--ts-shift手动调整时间戳偏移值,此选项可以和--ts-normalize配合使用。
1.3 专家系统规则
1.3.1 PPU长时间空闲分析
分析和汇总asysrep报告中PPU长时间空闲的时间段(PPU bubble),并按照空闲时长排序降序输出。
对于各个PPU设备,对每个进程进行检查,从该设备上的第一个PPU活动开始到该设备上的最后一个PPU活动结束的时间范围内,查找满足设置门限的空闲时间。
依赖的asys采集选项:--trace hggc
分析规则
当PPU没有下述活动时,视为PPU空闲:
执行kernel执行memcpy / memset执行video编解码
按照每进程、每PPU级别,统计PPU空闲时间段。若空闲时间段大于参数gap设置的门限,则此空闲时间段汇入统计结果。
统计结果按照空闲时长排序降序输出。
ppu_gaps表格列说明如下:
Row# : Row number of the PPU gap
Duration [ns] : Duration of the PPU gap
Start [ns] : Start time of the PPU gap
PID : Process identifier
Device ID : PPU device identifier
命令行使用方法
asys analyze --rule ppu_gaps report.asysrep通过--rule选定ppu_gaps时,可通过拼接多个:option的方式指定分析的相关参数,可通过asys analyze --help-rules ppu_gaps查看具体帮助信息,支持的选项举例如下:
rows=<limit>:限制输出的PPU长时间空闲结果的条数。gap=<threshold>:设置长时间空闲的时间门限,单位为毫秒。
例如:分析PPU长时间空闲,空闲时间门限为20ms,输出空闲时长最长的前10条结果:
asys analyze --rule ppu_gaps:rows=10:gap=20 report.asysrep报告结果示例如下:
Row#,Duration,Start,PID,Device ID,
1,1232895501,126020393150,1142419,6,
2,1219910832,126016153086,1142417,4,
3,1219804936,126017799911,1142416,3,
...GUI使用指南
规则设置(Settings)
Maximum number of results:限制输出的PPU长时间空闲结果的条数上限,默认值为50。
Minimum duration of PPU gaps in ms:设置长时间空闲的时间门限,单位为
毫秒,默认值为500。
表格右键菜单功能
支持在Timeline View中高亮或缩放至所选的范围。
饼图统计:对每个进程/设备的长时间空闲的持续时间进行汇总。通过饼图可以查看哪个进程/设备的bubble更多。
1.3.2 PPU时间利用率分析
功能说明
分析和汇总asysrep报告中PPU时间层面的利用率,并按照时间利用率升序输出。对于各个PPU设备,对每个进程进行基于Range Mode的检查。将该时间范围划分为相等的块(chunks),并计算每个块的PPU时间利用率。
如果选择了“PPU Active Time Range”模式,则统计的时间范围从该设备上的第一个 PPU 操作开始,到该设备上的最后一个 PPU 操作结束。如果选择了“Filtered Time Range”范围模式,则时间范围与指定的过滤时间范围相同。请注意,利用率是指“时间”利用率,而不是“资源”利用率。因此,一个简单的memcpy的“利用率”与调用所有资源的复杂kernel相同。如果多个操作在同一块中同时运行,则它们的利用率将加起来为100%。展示的结果为利用率百分比小于设定阈值的块。如果多个连续块的利用率较低,则多个块将合并展示为一条结果,并加权平均计算利用率,因此得到的各条结果的时间长度可能不同。
依赖的asys采集选项:--trace hggc
分析规则
当PPU有下述活动时,视为PPU繁忙:
执行kernel
执行memcpy / memset
执行video编解码
按照每进程、每PPU级别,计算PPU整体有活动的时间:从第一个活动开始到最后一个活动结束。
整体有活动的时间按照参数chunks分为等长的时间段,对每个时间段计算PPU在本时间段的时间利用率:繁忙时间/时间段长度。
时间利用率低于参数threshold的时间段将汇入统计结果。若多个相邻的时间段利用率均低于参数threshold,这些时间段将被合并计算利用率作为统计结果输出。
统计结果按照时间利用率升序输出。
Tips:
时间上重叠的kernel / memcpy等活动,重叠部分的时间不会重复计算,每个时间段的时间利用率不会高于100%。
可通过GUI端通过在timeline界面圈选一段时间范围,右键
Filter and zoom in指定过滤的时间范围。可通过调整
chunks和threshold参数计算整个报告的PPU时间利用率,例如:asys analyze --rule ppu_time_util:threshold=100:chunks=1:range-mode=full report.asysrep。
ppu_time_util表格列说明如下:
Row# : Row number of the chunk
In-Use [%] : Percentage of time the PPU is being used
Duration [ns] : Duration of the chunk
Start [ns] : Start time of the chunk
PID : Process identifier
Device ID : PPU device identifier
命令行使用方法
asys analyze --rule ppu_time_util report.asysrep通过--rule选定ppu_time_util时,可通过拼接多个:option的方式指定分析的相关参数,可通过asys analyze --help-rules ppu_time_util查看具体帮助信息,支持的选项举例如下:
rows=<limit>:限制输出的PPU低利用率时间段的结果的条数。threshold=<percent>:设置PPU繁忙占比的百分比门限。chunks=<number>:PPU整体有活动的时间段的切分个数。range-mode=<mode>:统计时间范围的选择模式,支持active和full模式:active:默认模式,时间范围从第一个PPU活动开始,到最后一个PPU活动结束截止。full:时间范围选取为用户指定的统计时间范围,若没有指定统计时间范围,则统计报告整体的时间范围。
compute-pipe=<index_list>:参与统计的Compute Pipe列表,多个Pipe Index之间通过/分割,若不指定,默认统计所有的Compute Pipe,可用于分析MPS模式使能时的时间利用率。
例如:分析PPU时间利用率,利用率门限为60%,时间等分为80段,输出利用率最低的前20条结果:
asys analyze --rule ppu_time_util:rows=20:threshold=60:chunks=80 report.asysrep报告结果示例如下:
Row#,In-Use,Duration,Start,PID,Device ID,
1,0.000000,12411,124667294244,1142418,5,
2,0.000000,7648,124667369358,1142419,6,
3,0.000000,7648,124667378918,1142419,6,
4,2.425268,7092,124667285970,1142418,5,
5,4.258319,7092,124667278287,1142418,5,
...GUI使用指南
规则设置(Settings)
Maximum number of results:限制输出的PPU低利用率时间段的结果的条数上限,默认值为50。
MPS Compute Pipe Index:设置参与统计的MPS Compute Pipe Index,默认为All(统计所有的Compute Pipe)。
Minimum percentage of PPU utilization:设置PPU繁忙占比的百分比门限,输出PPU时间利用率低于该值的区间,默认值为50。
Number of equal-duration chunks:PPU整体有活动的时间段的切分个数,默认值为100。
Time Range Mode:设置统计时间范围的模式:
PPU Active Time Range:默认模式,时间范围从第一个PPU活动开始,到最后一个PPU活动结束截止。Filtered Time Range:时间范围选取为用户指定的统计时间范围,若没有指定统计时间范围,则统计报告整体的时间范围。
表格右键菜单功能
支持在Timeline View中高亮或缩放至所选的范围。
饼图统计:对每个进程/设备的低利用率的持续时间进行汇总。通过饼图可以查看哪个进程/设备的利用率更低。
2. 统计系统
统计系统是Asight Systems中的一项重要功能,它对报告中数据的进行统计,可以通过这些统计结果全面了解程序的性能。
2.1 从GUI端使用统计系统
与Function View类似,可以通过下方tab切换到统计系统页面,如下所示:
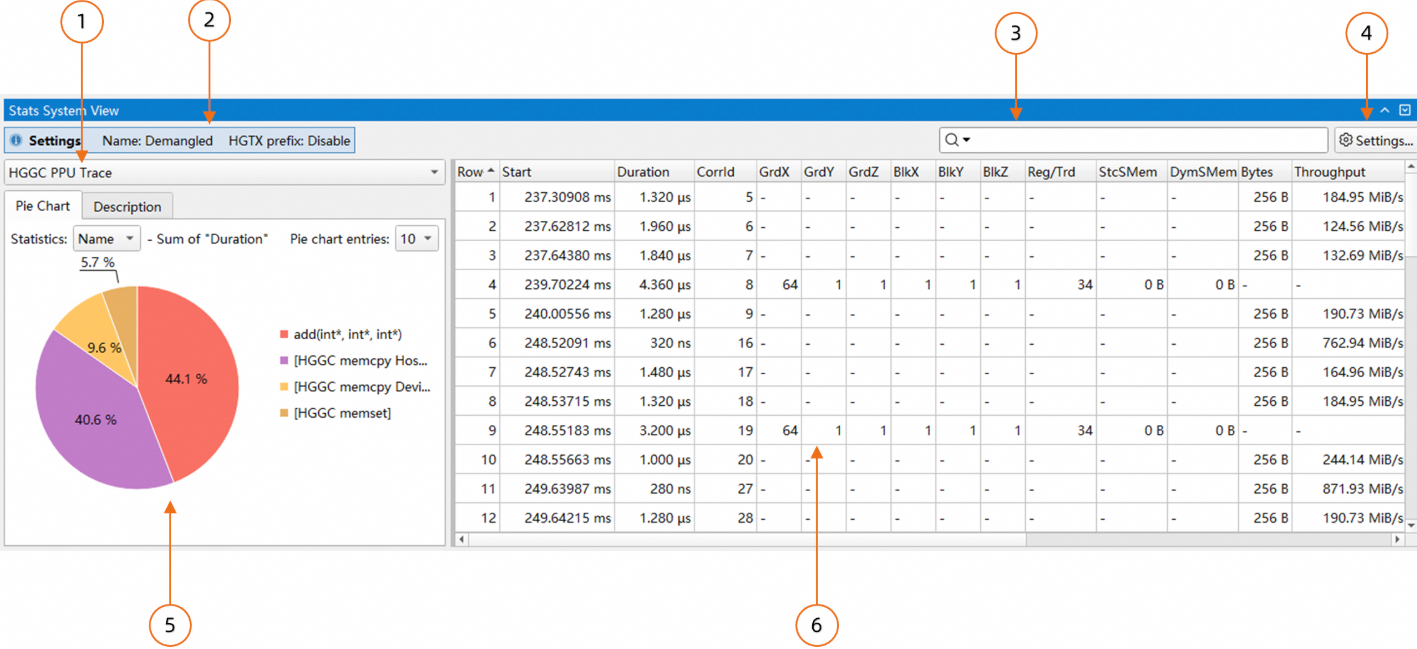
规则列表,可以在此选择统计规则;
当前生效侧参数配置,鼠标悬停时会显示参数的详细信息;
搜索框,支持搜索和过滤两种模式;
规则参数配置对话框,可以在此改变当前统计规则的配置;
统计结果的饼图,以及相关的优化建议,可以通过顶部tab切换;
统计结果表格,显示当前规则的分析结果,可以通过右键菜单导出分析结果;
2.1.1 设置统计区间
可以Timeline View的filter功能设置一个时间区间,统计系统只会对该时间区间内的事件进行统计。在Timeline View中按住鼠标左键拖动,在选定的区间内打开右键菜单,点击“Filter and Zoom in”,即可设置统计区间。
2.1.2 跳转至Timeline View
对于部分规则(目前包括Trace和Detail类的规则),支持从表格中跳转至Timeline View,可以通过在表格中打开右键菜单选择跳转的方式。
2.1.3 统计结果的饼图
规则的统计结果除了以表格的形式展示外,统计系统还支持以饼图的形式展示结果:
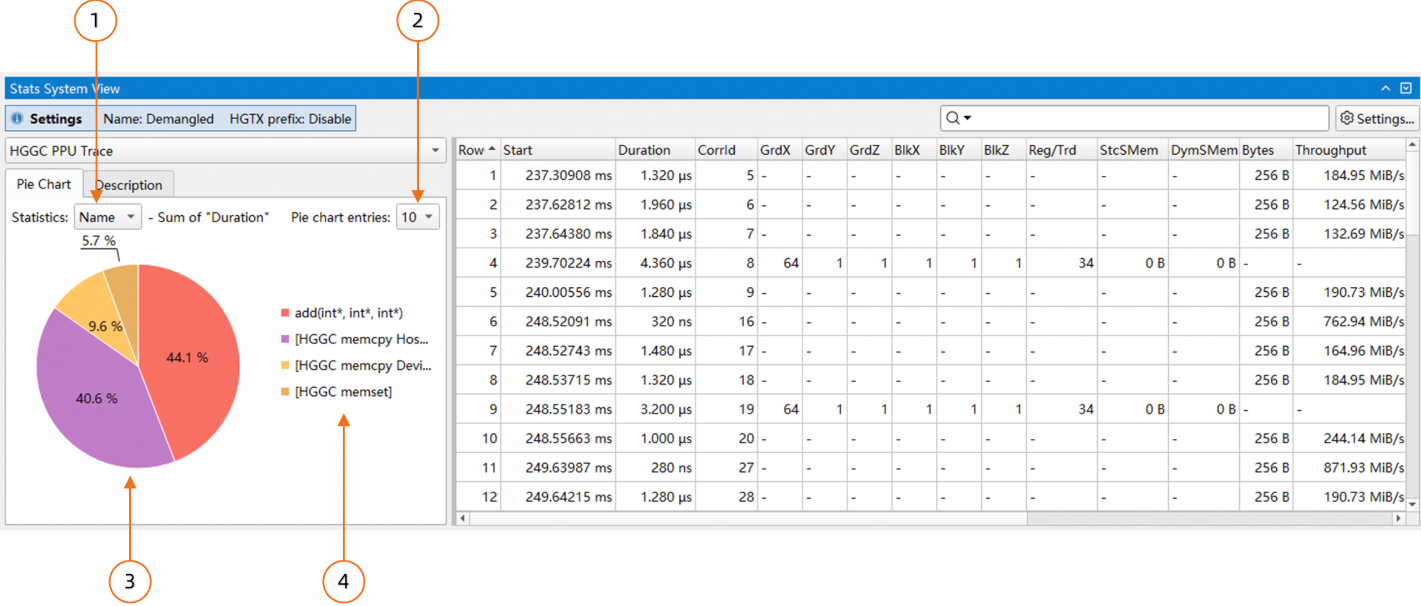
上图中:
当前饼图实现的是以"Name"为key,将右侧的表格的每一行进行分类,每一类将"Duration"这一列的值进行累加,最终计算"Duration"的时间占比显示在饼图中。这里的key可以通过组合框进行选择;
设置显示的扇形数量;
饼图,每个扇形显示的百分比是每"Name"的"Duration"占整体"Duration"的时间占比;
图例,上图中显示的"Name",并按"Duration"的降序排列;
饼图中的扇形支持点击,点击后表格只会显示对应key的行。如下图所示:
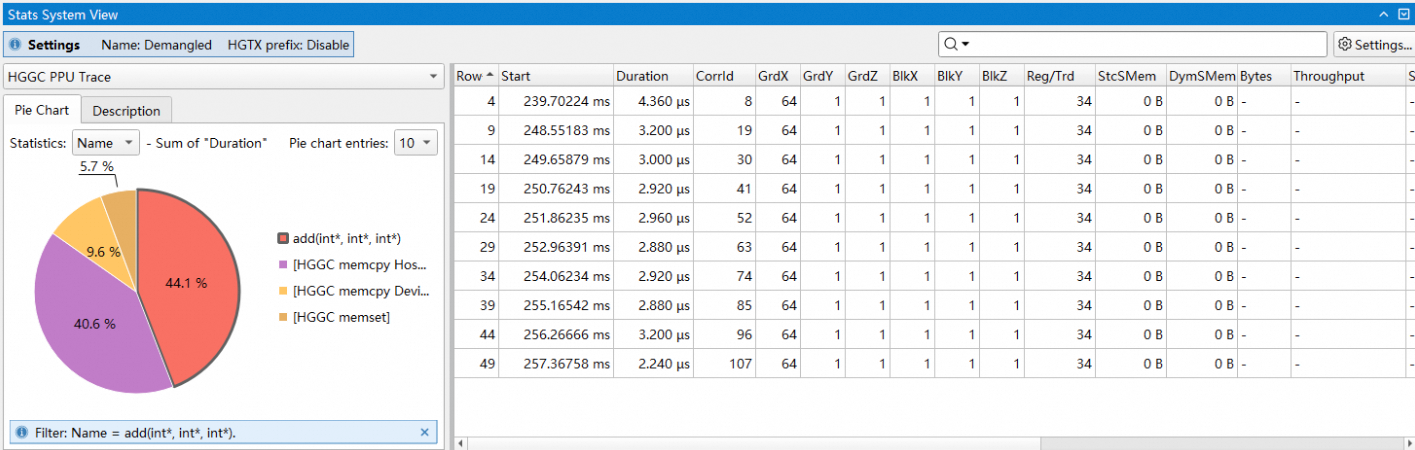
上图中,点击了name为add(int*,int*,int*)的扇形,因此在右侧表格中只会显示该名字的项,其他项被隐藏。再次点击扇形或饼图空白部分表格会复位。
2.1.4 通过选中行来统计列和
统计系统中,部分规则支持通过选中行来统计列和,并将结果显示在表头中,如下图所示:
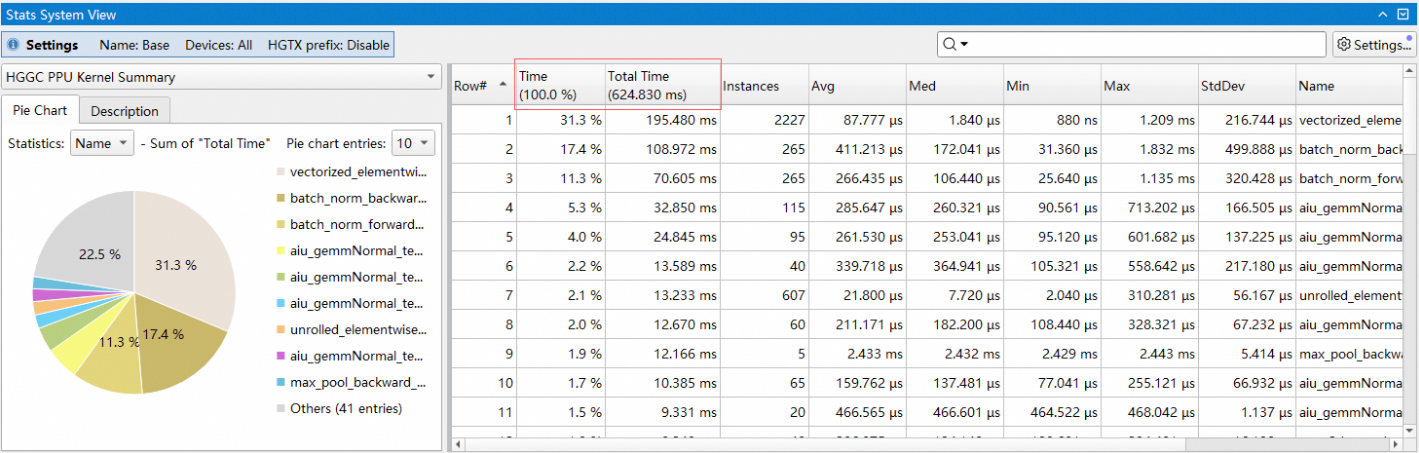
上图中选中了前三行,这三行的Time和Total Time列的值会累加显示在表头中。
2.2 从命令行端使用统计系统
在命令行端,可以通过执行asys stats命令,对指定报告进行统计分析,提供高效的统计功能和跟踪导出功能,分析结果支持输出到控制台、文件或命令管道,方便用户对数据进行查阅和二次处理。部分统计和分析功能也可通过Asight Systems GUI查看结果。
stats子命令的使用方式为:asys stats [option] <file.asysrep>
2.2.1 指定统计报告类型
asys stats支持多种统计报告类型,通过asys stats --help-reports ALL可查看统计报告类型的详细说明。
通过--report选项可指定统计报告类型,该选项可以多次指定,也可以使用逗号分隔列表来指定多个统计报告类型。若未指定统计报告类型,将使用默认统计报告类型来生成报告。
例如:指定使用hggc_ppu_kern_sum和device_memory_usage_summary统计报告类型生成报告:
asys stats --report hggc_ppu_kern_sum,device_memory_usage_summary report.asysrep2.2.2 指定统计报告格式
asys stats支持通过--format 选项,指定统计报告输出格式。通过asys stats --help-formats ALL可查看支持的输出格式和帮助信息。
column:输出到终端的默认格式,按照列表方式打印,易于阅读的输出格式,支持选项列举如下:
设置单位:设置输出数据的单位和精度。
csv:输出到文件的默认格式,按照csv表格格式打印,易于导出表格以后续处理,支持选项列举如下:
设置单位:设置输出数据的单位和精度。
设置单位选项允许指定显示指定种类数据时使用的单位,支持的种类和单位选项列举如下:
ratio:比例 / 百分比类型数据,支持的单位:%或者.1%:精确到小数点后一位。.2%:精确到小数点后两位stats。.3%:精确到小数点后三位。
例如指定按照列表方式输出,ratio种类数据精确到小数点后三位:
asys stats -r hgtx_ppu_proj_sum --format column:ratio=.3% report.asysrep2.2.3 指定统计报告输出类型
通过--output选项可指定报告输出的输出类型,目前有3种输出类型: 打印到console控制台,输出到文件,或者输出到命令。不指定默认打印到控制台。
通过--output %指定输出类型%表示输出到控制台console,例如:
asys stats --output % --report hgtx_sum report.asysrep通过--output .指定输出类型为输出到asysrep报告所在目录,则asys将会根据asysrep报告文件名、指定的统计报告类型和输出格式生成报告输出的文件名,输出文件名格式为:<file_name>_<report_name>.<format>。例如指定--output在报告所在目录生成report.asysrep的hggc_api_sum类型的统计报告,本地报告文件名称为report_hggc_api_sum.csv:
asys stats --output . --report hggc_api_sum report.asysrep通过--output @post_command指定输出结果通过post_command进行二次处理,统计报告的内容将通过管道传输到给定的命令。例如:通过grep 1142417匹配结果包含关键字1142417的结果:
asys stats --output "@grep 1142417" --report device_memory_usage_summary report.asysrep2.2.4 指定统计时间范围
可通过--filter-time选项指定统计的时间范围,时间格式为开始时间/结束时间,单位为纳秒,时间指从采集开始的偏移时间,其中开始时间或者结束时间可以省略一种。例如指定统计从第10秒到第20秒的跟踪数据:
asys stats --filter-time 10000000000/20000000000 --report device_memory_usage_summary report.asysrep可通过--filter-hgtx选项通过HGTX标注指定统计的时间范围,当--filter-hgtx选项被指定时,将忽略--filter-time选项。
使用--filter-hgtx选项可指定匹配的HGTX range的名称、domain和匹配索引,格式为range_name@domain/index,若匹配的HGTX range不存在domain,则@domain可省略,否则@domain需要指定。
默认asys将使用匹配的第一个HGTX range作为统计的时间范围,此时/index部分可省略,若需要指定匹配索引,则通过/index指定,索引从0开始。
例如:使用名称为self_attention的HGTX range指定统计时间范围,无domain,使用首个匹配的HGTX range的时间范围。
asys stats --filter-hgtx self_attention --report device_memory_usage_summary report.asysrep例如:使用名称为pcclGroupEnd的HGTX range指定统计时间范围,domain为NCCL,使用第9个匹配的HGTX range的时间范围(索引为8)。
asys stats --filter-hgtx "pcclGroupEnd@NCCL/8" --report device_memory_usage_summary report.asysrepTips:
asys stats输出的时间戳信息可能由于
--report选项不同而不同。若希望统一时间戳信息,可指定选项--ts-normalize true使能转换时间戳为UTC时间。asys stats支持通过选项
--ts-shift手动调整时间戳偏移值,此选项可以和--ts-normalize配合使用。
2.3 统计系统规则
2.3.1 设备内存使用分组汇总
分析和汇总asysrep报告中多种数据种类的PPU设备内存使用记录,按照分组(如算子库、框架)统计内存使用量,输出各个分组的内存使用汇总和详细信息。
依赖的asys采集选项:--hggc-memory-usage device
统计规则
按照每进程、每PPU级别,汇总已申请且没有释放的PPU设备内存使用记录。
对于每个申请且没有释放的内存使用记录,根据内存申请时的调用栈信息(帧的排列顺序,每帧匹配的关键字),匹配分组规则。
内存使用记录可能匹配到多个分组,输出的分组信息将显示记录归属的所有分组,通过/间隔。
汇总每种分组组合的内存使用量,结果按照内存使用量汇总降序排列。
device_memory_usage_detail表格列说明如下:
Row# : Row number of the device memory usage
PID : Process identifier
Device ID : PPU device identifier
Group List : Memory usage belonged group list, splited by '/'
Time [ns] : Memory usage timestamp
TID : Thread identifier
Context ID : Context identifier
Memory : Memory identifier
Size [bytes] : Memory usage size
Access Flag : Memory access flag
Event ID : Memory usage event identifierdevice_memory_usage_summary表格列说明如下:
Row# : Row number of the device memory usage
PID : Process identifier
Device ID : PPU device identifier
Group List : Memory usage belonged group list, splited by '/'
Memory Usage [bytes] : Device memory usage
命令行使用方法
可通过-r <rule>:usage-mode=<mode>选项指定数据种类
device_memory_usage_detail 规则支持两种数据种类:
'all':支持导出申请和释放的内存跟踪
'unreleased':支持导出泄漏的内存跟踪(默认值)
device_memory_usage_summary 规则支持四种数据种类:
'alloc-count': 申请的内存次数汇总
'alloc-size': 申请的内存量汇总
'unreleased-count': 泄漏的内存次数汇总
'unreleased-size': 泄漏的内存量汇总(默认值)
可通过--callstack-group-config选项添加分组规则,可通过:match-first-group选项指定分组策略按第一个匹配组(默认匹配所有组)。
通过--report指定分组统计报告,举例如下:
asys stats -r device_memory_usage_summary:usage-mode=unreleased-szie:match-first-group \
--callstack-group-config "acompute=(libacblas|libacdnn)" \
--callstack-group-config "launch_kernel=libtorch/LaunchKernel" \
--callstack-group-config "loss=loss.py" \
report.asysrep
-r device_memory_usage_summary:指定设备内存使用汇总报告。:usage-mode=unreleased-size:指定泄漏的内存量汇总。:match-first-group:指定只归属于第一个匹配的组。--callstack-group-config "acompute=(libacblas|libacdnn)":创建分组名称
acompute。匹配的正则表达式
(libacblas|libacdnn):匹配调用栈包含libacblas或者libacdnn关键字的内存使用。
--callstack-group-config "launch_kernel=libtorch/LaunchKernel":创建分组名称
launch_kernel。匹配的正则表达式
libtorch/LaunchKernel:匹配调用栈层级关系:父函数所在帧包含关键字libtorch,且子函数所在帧包含关键字LaunchKernel的内存使用。匹配的父、子函数所在的调用栈帧之间允许存在未匹配的调用栈帧。
--callstack-group-config "loss=loss.py":创建分组名称
loss。匹配的正则表达式
loss.py:匹配调用栈包含loss.py关键字的内存使用。匹配的调用栈支持python调用栈。
分组的统计结果输出示例如下,按照CSV格式输出,可通过--output指定输出到csv文件等处理。
PID,Device ID,Group List,Memory Usage,
1873,0,launch_kernel,213174,
1873,0,others,48674898730,
1873,0,acompute,1610624066,
1873,0,loss,28591
报告内容提供了分组
acompute、launch_kernel、loss的已申请且未释放的内存汇总,单位字节。不归属于用户指定组的内存使用,汇总到缺省的
others分组。
设备内存使用分组统计功能提供下述两种报告类型,可通过--report指定单个或者多个报告:
device_memory_usage_summary:输出每进程、每设备、每分组的已申请且未释放的内存汇总。device_memory_usage_detail:输出每笔申请且未释放的内存使用记录,以及所属的分组。
具体设备内存使用分组统计功能的描述信息,可通过 --help-reports选项查询,包含功能描述,输出格式说明等,例如执行asys stats --help-report device_memory_usage_summary,输出结果示例如下:
root@eb4c64fd3401:~# asys stats --help-report device_memory_usage_summary
device_memory_usage_summary -- Device Memory Usage Summary

    Options:
        match-first-group
            Optional argument. When used with --callstack-group-config:
            If given, only matching the first callstack group.
            Default is matching all callstack group.
        usage-mode=<mode>
            Possible values are 'alloc-size', 'unreleased-size', 'alloc-count' or 'unreleased-count'.
            Specify the memory usage mode.
            If 'alloc-size', statistic overall allocated device memory usage.
            If 'unreleased-size', statistic allocated but not freed device memory usage.
            If 'alloc-count', statistic overall allocated device memory count.
            If 'unreleased-count', statistic allocated but not freed device memory count.
            Default is 'unreleased-size'.
        Use --filter-time / --filter-hgtx to specify report time range.
        Use --callstack-group-config to create report group configuration.
        Try 'asys stats --help' for more information.

    Output:
        Row# : Row number of the device memory usage
        PID : Process identifier
        Device ID : PPU device identifier
        Group List : Memory usage belonged group list, splited by '/'
        Memory Usage [bytes] : Device memory usage

    Group and statistic device memory usage of specified mode,
    If 'alloc-size' mode,  display allocated device memory usage summary.
    If 'alloc-count' mode, display allocated device memory count summary.
    If 'unreleased-size' mode, display allocated but not freed device memory usage summary.
If 'unreleased-count' mode, display allocated but not freed device memory count summary.当内存使用记录分组匹配策略按匹配多个分组时,报告输出的分组信息将显示记录归属的所有分组,通过/间隔,例如:
acompute/launch_kernel内存使用同时归属于
acompute和launch_kernel分组。若分组匹配策略按匹配第一组,则只归属于第一个满足条件的分组。
分组的排列顺序取决于命令行选项
--callstack-group-config的创建分组顺序。
通过选项--callstack-group-config可创建分组并通过正则表达式指定匹配规则,格式为group_name=frame_filters,其中frame_filters可指定多个帧的匹配正则表达式,格式为:frame_regex1/frame_regex2/...,帧匹配正则表达式之间通过/间隔,帧的排列方向为从父函数到子函数方向排列。分组的匹配规则说明如下:
帧的匹配方式为:若正则表达式可
部分匹配调用栈的库名称或者函数签名,则判定帧匹配。调用栈的匹配方式为:若调用栈中匹配的帧的层级关系,符合
frame_filters中指定的层级关系,则判定分组匹配。
选项--callstack-group-config举例如下,通过多次使用--callstack-group-config创建多个分组,每个分组指定匹配多个帧的规则:
--callstack-group-config "torch=libtorch" --callstack-group-config "acompute=(libacblas|libacdnn)" --callstack-group-config "buffer_init=_to_copy/empty_strided"Tips:
若没有通过
--callstack-group-config添加分组规则,将会使用默认内置的分组规则。当多个
--callstack-group-config创建的分组名称相同时,匹配任一分组规则的内存使用记录,将被归属到本分组。
GUI使用指南
规则设置(Settings)
Usage Mode:统计数据种类。Device Memory Usage Detail 规则支持两种数据种类:
Unreleased Alloc Trace:支持导出泄漏的内存跟踪(默认值)
All Alloc and Free Trace:支持导出申请和释放的内存跟踪
Device Memory Usage Summary 规则支持四种数据种类:
Unreleased Alloc Size: 泄漏的内存量汇总(默认值)
Total Alloc Size: 申请的内存量汇总
Unreleased Alloc Count: 泄漏的内存次数汇总
Total Alloc Count: 申请的内存次数汇总
Group Config:创建分组并通过正则表达式指定匹配规则。格式为group_name=frame_filters,其中frame_filters可指定一个或多个帧的匹配正则表达式,格式为:frame_regex1/frame_regex2/...,帧匹配正则表达式之间通过/间隔,帧的排列方向为从父函数到子函数方向排列。
Only match the first group in order:指定只归属于按从上至下顺序第一个匹配的组。默认为不勾选,即归属于所有匹配的组。
表格右键菜单功能
Device Memory Usage Detail 规则右键菜单支持在Timeline View中高亮或缩放至所选内存跟踪。
饼图统计:对每个group/进程/设备的未释放内存使用情况进行汇总。通过饼图可以查看每个group/进程/设备可能存在的内存泄露情况。
2.3.2 HGGC API汇总
汇总asysrep报告中HGGC API的耗时,按照API总耗时降序输出。
统计规则
按照每HGGC API名称级别进行统计,累加相同名称API的耗时时间,按照API总耗时降序输出。
hggc_api_sum表格列说明如下:
注意“Time”列是根据“Total Time”列的总和计算得出的,表示该函数占所有列出函数执行时间的百分比,而不是根据应用执行时间得到的百分比。
Row# : Row number of the HGGC API summary
Time [%] : Percentage of 'Total Time'
Total Time [ns] : Total time used by all executions of this function
Num Calls : Number of calls to this function
Avg [ns] : Average execution time of this function
Med [ns] : Median execution time of this function
Min [ns] : Smallest execution time of this function
Max [ns] : Largest execution time of this function
StdDev [ns] : Standard deviation of the time of this function
Name : Name of the function
命令行使用方法
依赖的asys采集选项:--trace hggc
asys stats -r hggc_api_sum report.asysrep可通过asys stats --help-report hggc_api_sum查看具体帮助信息。
报告结果示例如下:
Row#,Time (%),Total Time (ns),Num Calls,Avg (ns),Med (ns),Min (ns),Max (ns),StdDev (ns),Name,
1,84.9,393100090,342,1149415,98746,3981,11001565,2011747,"hgMemcpyHtoDAsync_v2",
2,4.3,19851112,1297,15305,5351,2893,3860175,147778,"hgLaunchKernel",
3,2.9,13492044,1486,9079,2861,613,3707197,108998,"hgEventQuery",
4,2.9,13487638,1495,9021,6027,3191,222379,14733,"hggcLaunchKernel",
...GUI使用指南
规则设置(Settings)
该规则没有可以配置的设置选项。
饼图统计:对每个HGGC API的耗时进行汇总。
2.3.3 HGGC API跟踪
导出asysrep报告中的HGGC API跟踪数据,按照API执行时间升序输出
依赖的asys采集选项:--trace hggc
统计规则
每HGGC API调用导出一行数据,按照API执行时间升序输出。
hggc_api_trace表格列说明如下:
Row# : Row number of the HGGC API trace
Start [ns] : Timestamp when API call was made
Duration [ns] : Length of API calls
Name : API function name
CorrID : Correlation used to map to other HGGC traces
Pid : Process ID that made the call
Tid : Thread ID that made the call
Thread Name : Name of thread that called API function
命令行使用方法
asys stats -r hggc_api_trace report.asysrep可通过asys stats --help-report hggc_api_trace查看具体帮助信息。
报告结果示例如下:
Row#,Start (ns),Duration (ns),Name,CorrID,Pid,Tid,Thread Name,
1,41550,12737,"cudaProfilerStart",0,104699,104699,"python",
2,938476,28340,"cudaLaunchKernel",130170,104699,104699,"python",
3,999414,9382,"cudaLaunchKernel",130171,104699,104699,"python",
...GUI使用指南
规则设置(Settings)
该规则没有可以配置的设置选项。
表格右键菜单功能
支持在Timeline View中高亮或缩放至所选HGGC API。
饼图统计:对HGGC API的耗时进行汇总。支持切换至以进程级别对HGGC API耗时进行统计。
2.3.4 HGGC Kernel执行跟踪
导出asysrep报告中的HGGC kernel通过API launch启动到Kernel实际执行的跟踪数据,根据本kernel的launch API的起始时间升序输出。
统计规则
导出结果组织如下:每Kernel执行信息导出一行数据,根据本kernel的launch API的起始时间升序输出。
对于HGGC Graph等单个HGGC API关联多个Kernel的场景,每个Kernel导出一行数据。
Kernel Launch后的等待时间相关列(Queue Start / Queue Dur)的计算方式如下:
认为Kernel存在等待时间:Kernel实际执行开始时间 > 执行HGGC API结束时间。
等待时间计算:Kernel实际执行开始时间 - 执行HGGC API结束时间。
若Kernel在HGGC API执行结束前即开始执行,则Queue Start / Queue Dur列标记为无效值
-。
hggc_kern_exec_trace表格列说明如下:
Row# : Row number of the kernel trace
API Start [ns] : Start timestamp of HGGC API launch call
API Dur [ns] : Duration of HGGC API launch call
Queue Start [ns] : Start timestamp of queue wait time, if it exists
Queue Dur [ns] : Duration of queue wait time, if it exists
Kernel Start [ns] : Start timestamp of HGGC kernel
Kernel Dur [ns] : Duration of HGGC kernel
Total Dur [ns] : Duration from API start to kernel end
PID : Process ID that made kernel launch call
TID : Thread ID that made kernel launch call
DevId : HGGC Device ID that executed kernel (which PPU)
API Function : Name of HGGC API call used to launch kernel
GridXYZ : Grid dimensions for kernel launch call
BlockXYZ : Block dimensions for kernel launch call
Kernel Name : Name of HGGC Kernel
命令行使用方法
依赖的asys采集选项:--trace hggc
asys stats -r hggc_kern_exec_trace report.asysrep可通过asys stats --help-report hggc_kern_exec_trace查看具体帮助信息,支持的选项列举如下:
base:导出kernel的短名称(仅函数名,不包含参数)。
mangled:导出kernel的mangled名称。
默认导出HGGC Kernel的名称为demangle之后的名称。
报告结果示例如下:
Row#,API Start (ns),API Dur (ns),Queue Start (ns),Queue Dur (ns),Kernel Start (ns),Kernel Dur (ns),Total Dur (ns),PID,TID,DevId,API Function,GridXYZ,BlockXYZ,Kernel Name,
1,504935256,20348911,525284167,21237024,526172280,357034784,378271808,631660,631660,0,"hggcLaunchKernel","2 1 1","512 1 1","pcclKernel_AllReduce_RING_LL_Sum_int8_t(pcclWorkElem)",
2,845563829,20332834,865896663,20934656,866498485,17898735,38833391,631660,631660,1,"hggcLaunchKernel","2 1 1","512 1 1","pcclKernel_AllReduce_RING_LL_Sum_int8_t(pcclWorkElem)",
3,884469702,40488,884510190,627234,885096936,16944871,17572105,631660,631660,0,"hggcLaunchKernel","2 1 1","512 1 1","pcclKernel_AllReduce_RING_LL_Sum_int8_t(pcclWorkElem)",
...GUI使用指南
规则设置(Settings)
Kernel Name Mode:Kernel Name的展示模式。包括三种模式:
Base:导出kernel的短名称(仅函数名,不包含参数)。
Mangled:导出kernel的mangled名称。
Demangled:导出kernel的demangle之后的名称(默认值)。
表格右键菜单功能
支持在Timeline View中高亮或缩放至所选HGGC API。
支持在Timeline View中高亮或缩放至所选的Device Activity。
饼图统计:对所有kernel/进程/设备的kernel执行耗时进行汇总。
2.3.5 HGGC Kernel Grid Block汇总
统计asysrep报告中HGGC kernel grid block等信息,输出每kernel名称,每grid size,每block size的统计信息。
依赖的asys采集选项:--trace hgtx,hggc
统计规则
统计方式:
将
相同kernel名称且相同grid size且相同block size的Kernel执行信息进行汇总:Kernel执行时间,出现次数等。若使能
hgtx-name选项,kernel名称包含拼接的HGTX range名称
统计结果组织如下:每kernel名称,每grid size,每block size导出一行数据,结果按照Total Time列降序输出。
hggc_ppu_kern_gb_sum表格列说明如下:
注意“Time”列是根据“Total Time”列的总和计算得出的,表示该kernel占所有列出kernels执行时间的百分比,而不是根据应用执行时间得到的百分比。
Row# : Row number of the kernel summary
Time [%] : Percentage of 'Total Time'
Total Time [ns] : Total time used by all executions of this kernel
Instances : Number of calls to this kernel
Avg [ns] : Average execution time of this kernel
Med [ns] : Median execution time of this kernel
Min [ns] : Smallest execution time of this kernel
Max [ns] : Largest execution time of this kernel
StdDev [ns] : Standard deviation of the time of this kernel
GridXYZ : Grid dimensions for kernel launch call
BlockXYZ : Block dimensions for kernel launch call
Name : Name of the kernel
命令行使用方法
asys stats -r hggc_ppu_kern_gb_sum report.asysrep可通过asys stats --help-report hggc_ppu_kern_gb_sum查看具体帮助信息,支持的选项列举如下:
hgtx-name:kernel名字前通过
/拼接最接近kernel launch的HGTX range名称base:使用kernel的短名称(仅函数名,不包含参数)进行统计和输出
mangled:使用kernel的mangled名称进行统计和输出
device:指定统计的PPU device ID列表,多个PPU device ID之间通过
/分割。若不指定,默认统计所有PPU device
报告结果示例如下:
Row#,Time (%),Total Time (ns),Instances,Avg (ns),Med (ns),Min (ns),Max (ns),StdDev (ns),GridXYZ,BlockXYZ,Name,
1,6.7,16337781,65,251350,260801,115520,277681,39767,"960 1 64","256 1 1","[prof_range]: iter 9/_ZN5acdnn4cuda9transposeILNS0_8LoopModeE0ELi32ELi8ELb0ELb0EN7",
2,3.1,7415267,20,370763,370601,366482,374162,1936,"2048 1 1","512 1 1","[prof_range]: iter 8/_ZL35batch_norm_bwd_single_vector_accessILb0EN5acdnn16identity",
3,3.0,7348069,20,367403,366401,361281,375921,3885,"122880 1 1","128 1 1","_ZN2at6native29vectorized_elementwise_kernelILi4EZZZNS0_12",GUI使用指南
规则设置(Settings)
Kernel Name Mode:Kernel Name的展示模式。包括三种模式:
Base:导出kernel的短名称(仅函数名,不包含参数)
Mangled:导出kernel的mangled名称
Demangled:导出kernel的demangle之后的名称(默认值)
PPU Devices:PPU device过滤器,统计结果按照所选的PPU device进行过滤,默认值为“All”,统计所有PPU devices的数据,此项不能为空。
Add HGTX name as a prefix:使能名字前拼接最接近kernel launch的HGTX名称,通过
/间隔。默认不勾选。
饼图统计:对所有kernel的执行耗时进行汇总。
2.3.6 HGGC Kernel Grid Block跟踪
导出asysrep报告中的HGGC kernel执行的跟踪数据,以及grid size / block size等信息,根据执行的开始时间升序输出。
统计规则
导出结果组织如下:每Kernel执行信息导出一行数据,根据本kernel的执行起始时间升序输出。
hggc_ppu_kern_gb_trace表格列说明如下:
Row# : Row number of the kernel trace
Start [ns] : Timestamp of start time
Duration [ns] : Length of event
PID : Process identifier
Device ID : PPU device identifier
Context ID : Context identifier
Stream ID : Stream identifier
GridXYZ : Grid dimensions for kernel launch call
BlockXYZ : Block dimensions for kernel launch call
Name : Name of the kernel
命令行使用方法
依赖的asys采集选项:--trace hgtx,hggc
asys stats -r hggc_ppu_kern_gb_trace report.asysrep可通过asys stats --help-report hggc_ppu_kern_gb_trace查看具体帮助信息,支持的选项列举如下:
hgtx-name:kernel名字前通过
/拼接最接近kernel launch的HGTX range名称base:使用kernel的短名称(仅函数名,不包含参数)进行统计和输出
mangled:使用kernel的mangled名称进行统计和输出
报告结果示例如下:
Row#,Start (ns),Duration (ns),PID,Device ID,Context ID,Stream ID,GridXYZ,BlockXYZ,Name,
1,970508,6240,104699,0,1,1,"3 1 1","128 1 1","[prof_range]: iter 5/unrolled_elementwise_kernel",
2,1014188,44480,104699,0,1,1,"15360 1 1","128 1 1","[prof_range]: iter 5/unrolled_elementwise_kernel",
3,1158469,98480,104699,0,1,1,"960 1 64","256 1 1","[prof_range]: iter 5/transpose",
4,1257269,1880,104699,0,1,1,"1 1 32","256 1 1","[prof_range]: iter 5/transpose",GUI使用指南
规则设置(Settings)
Kernel Name Mode:Kernel Name的展示模式。包括三种模式:
Base:导出kernel的短名称(仅函数名,不包含参数)
Mangled:导出kernel的mangled名称
Demangled:导出kernel的demangle之后的名称(默认值)
Add HGTX name as a prefix:使能名字前拼接最接近kernel launch的HGTX名称,通过
/间隔。默认不勾选。
表格右键菜单功能
支持在Timeline View中高亮或缩放至所选的Device Activity
饼图统计:对所有kernel/进程/设备的kernel执行耗时进行汇总。
2.3.7 HGGC PPU kernel汇总
汇总asysrep报告中HGGC kernel的耗时,按照HGGC kernel总耗时降序输出。
依赖的asys采集选项:--trace hggc
统计规则
按照每HGGC kernel名称进行统计,HGGC kernel名称取决于base / mangled选项是否设置,默认为demangle后kernel名称(包含函数参数列表),按照HGGC kernel总耗时降序输出。
hggc_ppu_kern_sum表格列说明如下:
注意“Time”列是根据“Total Time”列的总和计算得出的,表示该kernel占所有列出kernels执行时间的百分比,而不是根据应用执行时间得到的百分比。
Row# : Row number of the kernel summary
Time [%] : Percentage of 'Total Time'
Total Time [ns] : Total time used by all executions of this kernel
Instances : Number of calls to this kernel
Avg [ns] : Average execution time of this kernel
Med [ns] : Median execution time of this kernel
Min [ns] : Smallest execution time of this kernel
Max [ns] : Largest execution time of this kernel
StdDev [ns] : Standard deviation of the time of this kernel
Name : Name of the kernel
命令行使用方法
asys stats -r hggc_ppu_kern_sum report.asysrep可通过asys stats --help-report hggc_ppu_kern_sum查看具体帮助信息,支持的选项列举如下:
hgtx-name:kernel名字前通过/拼接最接近kernel launch的HGTX range名称
base:使用kernel的短名称(仅函数名,不包含参数)进行统计和输出
mangled:使用kernel的mangled名称进行统计和输出
device:指定统计的PPU device ID列表,多个PPU device ID之间通过
/分割。若不指定,默认统计所有PPU device
报告结果示例如下:
Row#,Time (%),Total Time (ns),Instances,Avg (ns),Med (ns),Min (ns),Max (ns),StdDev (ns),Name,
1,81.6,826473830,28,29516922,17075623,16812011,357034784,64193935,"_Z39pcclKernel_AllReduce_RING_LL_Sum_int8_t12ncclWorkElem",
2,13.9,141273640,4,35318410,34326818,31248932,41371071,4288359,"_Z9deltaKernIaLi256EEvPvS0_mPd",
3,2.3,23263744,4,5815936,5866699,4743763,6786583,1087875,"_Z14InitDataKernelIaEvPT_mii",
4,2.2,22033972,4,5508493,5461251,4528464,6583005,1031905,"_Z20InitDataReduceKernelIaXadL_Z9ncclOpSumIaET_S1_S1_EEEvPS1_mmii",GUI使用指南
规则设置(Settings)
Kernel Name Mode:Kernel Name的展示模式。包括三种模式:
Base:导出kernel的短名称(仅函数名,不包含参数)
Mangled:导出kernel的mangled名称
Demangled:导出kernel的demangle之后的名称(默认值)
PPU Devices:PPU device过滤器,统计结果按照所选的PPU device进行过滤,默认值为“All”,统计所有PPU devices的数据,此项不能为空。
饼图统计:对所有kernel的kernel执行耗时进行汇总。
2.3.8 HGGC PPU跟踪
导出asysrep报告中的PPU执行HGGC Kernel / Memcpy / Memset的跟踪数据,根据执行的开始时间升序输出。
统计规则
导出结果组织如下:每Kernel / Memcpy / Memset执行信息导出一行数据,根据执行的开始时间升序输出。
由于导出结果的列包含Kernel / Memcpy / Memset的信息,对于导出的每一行数据,不适用的单元格被标记为无效值-。
hggc_ppu_trace表格列说明如下:
Row# : Row number of the PPU trace
Start [ns] : Timestamp of start time
Duration [ns] : Length of event
CorrId : Correlation ID
GrdX : Grid X values
GrdY : Grid Y values
GrdZ : Grid Z values
BlkX : Block X values
BlkY : Block Y values
BlkZ : Block Z values
Reg/Trd : Registers per thread
StcSMem [bytes] : Size of Static Shared Memory
DymSMem [bytes] : Size of Dynamic Shared Memory
Bytes [bytes] : Size of memory operation
Throughput [B/s] : Memory throughput
SrcMemKd : Memcpy source memory kind or memset memory kind
DstMemKd : Memcpy destination memory kind
Device : PPU device name and ID
Ctx : Context ID
Strm : Stream ID
Name : Trace event name
命令行使用方法
依赖的asys采集选项:--trace hggc
asys stats -r hggc_ppu_trace report.asysrep可通过asys stats --help-report hggc_ppu_trace查看具体帮助信息,支持的选项列举如下:
hgtx-name:kernel名字前通过/拼接最接近kernel launch的HGTX range名称
base:导出kernel的短名称(仅函数名,不包含参数)
mangled:导出kernel的mangled名称
默认导出HGGC Kernel的名称为demangle之后的名称。
报告结果示例如下,不适用的单元格被标记为无效值-:
Row#,Start (ns),Duration (ns),CorrId,GrdX,GrdY,GrdZ,BlkX,BlkY,BlkZ,Reg/Trd,StcSMem (bytes),DymSMem (bytes),Bytes (bytes),Throughput (B/s),SrcMemKd,DstMemKd,Device,Ctx,Strm,Name,
1,193282492,3009,5,"-","-","-","-","-","-","-","-","-",256,85078016,"Device","-","",1,1,"Memset",
2,193329286,1332,6,"-","-","-","-","-","-","-","-","-",256,192192000,"Pageable","Device","",1,1,"Memcpy HtoD (device)",
3,193380562,3415,7,"-","-","-","-","-","-","-","-","-",256,74963200,"Pageable","Device","",1,1,"Memcpy HtoD (device)",
4,231829389,4562345,8,64,1,1,1,1,1,32,0,0,"-","-","-","-","",1,1,"add(int*, int*, int*)",GUI使用指南
规则设置(Settings)
Kernel Name Mode:Kernel Name的展示模式。包括三种模式:
Base:导出kernel的短名称(仅函数名,不包含参数)
Mangled:导出kernel的mangled名称
Demangled:导出kernel的demangle之后的名称(默认值)
表格右键菜单功能
支持在Timeline View中高亮或缩放至所选kernel或内存操作。
饼图统计:对所有PPU事件/设备的执行耗时进行汇总。
2.3.9 HGTX关联kernel汇总
统计asysrep报告中HGTX range和关联的HGGC Kernel跟踪数据,输出每HGTX range名称,每Kernel名称的统计信息。
依赖的asys采集选项:--trace hgtx,hggc
统计规则
判断HGTX range和HGGC kernel的原则为:HGTX range持续时间范围内,相同线程的HGGC API触发的HGGC kernel,认为和此HGTX range关联。
统计方式:
对每进程、每线程,将相同
HGTX range名称且相同Kernel名称的Kernel执行信息进行汇总:Kernel执行时间、同名HGTX出现次数、同名Kernel出现次数等。
统计结果组织如下:每线程,每HGTX range名称,每HGGC kernel名称导出一行数据,若选项standalone使能,未关联HGTX range的HGGC kernel所在行的HGTX相关信息将标记为无效符号-。统计结果排序方式如下:
按照HGTX range名称、进程ID和线程ID升序排列
相同线程相同HGTX range名称的Kernel按照Total Time列降序排列
hgtx_kern_sum表格列说明如下:
Row# : Row number of the HGTX range kernel summary
HGTX Range : Name of the range
Style : Range style; Start/End or Push/Pop
PID : Process ID for this set of ranges and kernels
TID : Thread ID for this set of ranges and kernels
HGTX Inst : Number of HGTX range instances
Kern Inst : Number of HGGC kernel instances
Total Time [ns] : Total time used by all kernel instances of this range
Avg [ns] : Average execution time of this kernel
Med [ns] : Median execution time of this kernel
Min [ns] : Smallest execution time of this kernel
Max [ns] : Largest execution time of this kernel
StdDev [ns] : Standard deviation of the time of this kernel
Kernel Name : Name of the kernel
命令行使用方法
asys stats -r hgtx_kern_sum report.asysrep可通过asys stats --help-report hgtx_kern_sum查看具体帮助信息,支持的选项列举如下:
base:导出kernel的短名称(仅函数名,不包含参数)
mangled:导出kernel的mangled名称
standalone:导出结果包含未关联任何HGTX range的HGGC kernel
device:指定统计的PPU device ID列表,多个PPU device ID之间通过
/分割。若不指定,默认统计所有PPU deviceno-graph-mapping:导出结果不包含通过HGGC graph node映射的HGTX range信息
range=<regex_filter>:指定参与统计的HGTX range过滤正则表达式。若不指定,默认统计所有HGTX range
报告结果示例如下:
Row#,HGTX Range,Style,PID,TID,HGTX Inst,Kern Inst,Total Time (ns),Avg (ns),Med (ns),Min (ns),Max (ns),StdDev (ns),Kernel Name,
1,"DoProcess","PushPop",3588556,3588556,2,2,8036961,4018480,4018480,3474616,4562345,543864,"add(int*, int*, int*)",
2,"Loop1","PushPop",3588556,3588556,1,1,4562345,4562345,4562345,4562345,4562345,0,"add(int*, int*, int*)",
3,"Loop2","PushPop",3588556,3588556,1,1,3474616,3474616,3474616,3474616,3474616,0,"add(int*, int*, int*)",
4,"profile","PushPop",3588556,3588556,1,2,8036961,4018480,4018480,3474616,4562345,543864,"add(int*, int*, int*)",GUI使用指南
规则设置(Settings)
Kernel Name Mode:Kernel Name的展示模式。包括三种模式:
Base:导出kernel的短名称(仅函数名,不包含参数)
Mangled:导出kernel的mangled名称
Demangled:导出kernel的demangle之后的名称(默认值)
Include Standalone Kernel:是否导出未匹配到任何HGTX的kernel信息,此类kernel导出的HGTX相关信息为非法值。默认不导出。
HGTX graph node mapping:是否投影HGGC graph capture阶段HGTX到PPU侧(通过在HGTX range范围内创建的HGGC graph node建立与PPU侧到关联)。默认值为“Yes”。
PPU Devices:PPU device过滤器,统计结果按照所选的PPU device进行过滤,默认值为“All”,统计所有PPU devices的数据,此项不能为空。
饼图统计:对所有HGTX Range/进程/kernel name的kernel执行耗时进行汇总。
2.3.10 HGTX关联kernel跟踪
建立关联HGTX和HGGC kernel的关联关系,并按照每HGTX range,每HGGC kernel级别导出关联关系。
统计规则
判断HGTX range和HGGC kernel的原则为:HGTX range持续时间范围内,相同线程的HGGC API触发的HGGC kernel,认为和此HGTX range关联。
导出结果组织如下:每HGTX range,每HGGC kernel导出一行数据,若选项standalone使能,未关联HGTX range的HGGC kernel行中的HGTX range信息将标记为无效符号-。
导出顺序:
HGGC kernel按照PPU开始执行时间升序排序。
相同HGGC kernel关联的各个HGTX range行按照HGTX range的开始时间升序排序。
hgtx_kern_trace表格列说明如下:
Row# : Row number of the HGTX range kernel trace
Range name : Name of the HGTX range
Style : Range style; Start/End or Push/Pop
PID : Process identifier
TID : Thread identifier
Device ID : PPU device identifier
Context ID : Context identifier
Stream ID : Stream identifier
HGTX range ID : HGTX range identifier
Kernel exec ID : Kernel execution identifier
Kernel Start [ns] : Start timestamp of HGGC kernel
Kernel duration [ns] : Duration of HGGC kernel
API Start [ns] : Start timestamp of API call
API duration [ns] : Duration of API call
GridXYZ : Grid dimensions for kernel launch call
BlockXYZ : Block dimensions for kernel launch call
Correlation ID : Correlation identifier
Graph ID : HGGC graph identifier
Graph Node ID : HGGC graph node identifier
Kernel Name : Name of the kernel
Mangled Name : Mangled name of the kernel
命令行使用方法
依赖的asys采集选项:--trace hgtx,hggc
asys stats -r hgtx_kern_trace report.asysrep可通过asys stats --help-report hgtx_kern_trace查看具体帮助信息,支持的选项列举如下:
base:导出kernel的短名称(仅函数名,不包含参数)
mangled:导出kernel的mangled名称
standalone:导出结果包含未关联任何HGTX range的HGGC kernel
no-graph-mapping:导出结果不包含通过HGGC graph node映射的HGTX range信息
range=<regex_filter>:指定参与统计的HGTX range过滤正则表达式。若不指定,默认统计所有HGTX range
报告结果示例如下:
Row#,Range Name,Style,PID,TID,Device ID,Context ID,Stream ID,HGTX Range ID,Kernel Exec ID,Kernel Start (ns),Kernel Duration (ns),API Start (ns),API Duration (ns),GridXYZ,BlockXYZ,Correlation ID,Graph ID,Graph Node ID,Kernel Name,Mangled Name,
1,"profile","PushPop",4010376,4010376,0,1,1,6,23,85579190,11136752,80913269,4025776,"64 1 1","1 1 1",8,"-","-","add(int*, int*, int*)","_Z3addPiS_S_",
2,"Loop1","PushPop",4010376,4010376,0,1,1,7,23,85579190,11136752,80913269,4025776,"64 1 1","1 1 1",8,"-","-","add(int*, int*, int*)","_Z3addPiS_S_",
3,"DoProcess","PushPop",4010376,4010376,0,1,1,8,23,85579190,11136752,80913269,4025776,"64 1 1","1 1 1",8,"-","-","add(int*, int*, int*)","_Z3addPiS_S_",
...GUI使用指南
规则设置(Settings)
Kernel Name Mode:Kernel Name的展示模式。包括三种模式:
Base:导出kernel的短名称(仅函数名,不包含参数)
Mangled:导出kernel的mangled名称
Demangled:导出kernel的demangle之后的名称(默认值)
HGTX graph node mapping:是否投影HGGC graph capture阶段HGTX到PPU侧(通过在HGTX range范围内创建的HGGC graph node建立与PPU侧到关联)。默认值为“Yes”。
Include Standalone Kernel:是否导出未匹配到任何HGTX的kernel信息,此类kernel导出的HGTX相关信息为非法值。默认不导出。
表格右键菜单功能
支持在Timeline View中高亮或缩放至所选的HGTX Range
支持在Timeline View中高亮或缩放至所选的Device Activity
饼图统计:对所有HGTX Range/kernel name/进程/设备的kernel执行耗时进行汇总。
2.3.11 HGTX向PPU投影汇总
将asysrep报告中的CPU侧HGTX range向PPU侧投影,输出HGTX range在PPU侧实际活跃时间的统计信息。
依赖的asys采集选项:--trace hgtx,hggc
统计规则
判断HGTX range和HGGC kernel的原则为:HGTX range持续时间范围内,相同线程的HGGC API触发的HGGC kernel,认为和此HGTX range关联。
CPU侧HGTX range向PPU侧投影的方式为:HGTX range在PPU侧的活跃时间,从本HGTX关联的最早的PPU活动开始,到最晚的PPU活动结束。PPU活动包括:HGGC Kernel / memcpy / memset 相关执行信息。
统计方式:
将
相同HGTX range且相同Style的HGTX range信息进行汇总,如CPU侧时长,PPU侧投影时长等。相同的HGTX range在PPU侧的总的活跃时间
Proj Active Time计算方式为:指定的时间点存在一个或者更多HGTX range投影,则记为活跃时间。如果多个HGTX range的投影在时间上重叠,重叠的部分不会被多次计入活跃时间。相同的HGTX range投影的PPU侧占比
In-Use计算方式为:Proj Active Time/PPU侧统计时间范围,其中PPU侧统计时间范围计算方式取决于range-mode选项。
统计结果组织如下:按照In-Use降序排列,按照HGTX Range名称升序排列。
hgtx_ppu_proj_sum表格列说明如下:
Row# : Row number of the HGTX PPU projection summary
Range : Name of the HGTX range
Style : Range style; Start/End or Push/Pop
In-Use [%] : Percentage of projected active time to time range
Proj Active Time [ns] : Total projected time excluding overlapping for this range name
Total Proj Time [ns] : Total projected time used by all instances of this range name
Total Range Time [ns] : Total original HGTX range time used by all instances of this range name
Range Instances : Number of instances of this range
Proj Avg [ns] : Average projected time for this range
Proj Med [ns] : Median projected time for this range
Proj Min [ns] : Minimum projected time for this range
Proj Max [ns] : Maximum projected time for this range
Proj StdDev [ns] : Standard deviation of projected times for this range
Total PPU Ops : Total number of PPU operations
Avg PPU Ops : Average number of PPU operations
Avg Range Lvl : Average range stack depth
Avg Num Child : Average number of children ranges
命令行使用方法
asys stats -r hgtx_ppu_proj_sum report.asysrep可通过asys stats --help-report hgtx_ppu_proj_sum查看具体帮助信息,支持的选项列举如下:
device=<device_list>:指定统计的PPU device ID列表,多个PPU device ID之间通过/分割。若不指定,默认统计所有PPU device。range-mode=<mode>:PPU侧统计时间范围的选择模式,支持active和full模式。active:默认模式,时间范围从第一个PPU活动开始,到最后一个PPU活动结束截止。
full:时间范围选取为用户指定的统计时间范围,若没有指定统计时间范围,则统计报告整体的时间范围。
range=<regex_filter>:指定参与统计的HGTX range过滤正则表达式。若不指定,默认统计所有HGTX range。no-graph-mapping:导出结果不包含通过HGGC graph node映射的HGTX range信息。
GUI使用指南
规则设置(Settings)
PPU Devices:PPU device过滤器,统计结果按照所选的PPU device进行过滤,默认值为“All”,统计所有PPU devices的数据,此项不能为空。
Time Range Mode:设置统计时间范围的模式:
PPU Active Time Range:默认模式,时间范围从第一个PPU活动开始,到最后一个PPU活动结束截止。Filtered Time Range:时间范围选取为用户指定的统计时间范围,若没有指定统计时间范围,则统计报告整体的时间范围。
HGTX graph node mapping:是否投影HGGC graph capture阶段HGTX到PPU侧(通过在HGTX range范围内创建的HGGC graph node建立与PPU侧到关联)。默认值为“Yes”。
Range Name Filter:对结果中的HGTX range name进行过滤,采用(Perl兼容的)正则表达式匹配的方式,默认显示所有HGTX range。带有正则表达式语法检查,当输入的正则表达式语法错误时,出现错误提示并且不允许保存设置。
饼图统计:对CPU侧所有HGTX Range的在PPU侧的投影活动时间进行汇总。可以直观地查看各HGTX Range投影至PPU侧后的运行耗时占比。
2.3.12 HGTX向PPU投影跟踪
将asysrep报告中的CPU侧HGTX range向PPU侧投影,以展示CPU侧HGTX range在PPU侧实际活跃的时间,并导出HGTX的堆栈信息。
依赖的asys采集选项:--trace hgtx,hggc
统计规则
判断HGTX range和HGGC kernel的原则为:HGTX range持续时间范围内,相同线程的HGGC API触发的HGGC kernel,认为和此HGTX range关联。
CPU侧HGTX range向PPU侧投影的方式为:HGTX range在PPU侧的活跃时间,从本HGTX关联的最早的PPU活动开始,到最晚的PPU活动结束。PPU活动包括:HGGC Kernel / memcpy / memset 相关执行信息。
HGTX range在PPU侧的活跃时间PPU Active Time计算方式为:指定的时间点存在一个或者多个PPU侧活动,则记为活跃时间。若多个PPU侧活动在时间上重叠,重叠的部分不会被多次计入活跃时间。
导出结果组织如下:每HGTX range导出一行数据,结果按照Projected Start升序输出。
hgtx_ppu_proj_trace表格列说明如下:
Row# : Row number of the HGTX PPU projection trace
Name : Name of the HGTX range
Projected Start [ns] : Projected range start timestamp
Projected Duration [ns] : Projected range duration
PPU Active Time [ns] : Total PPU active time excluding overlapping for this range
Orig Start [ns] : Original HGTX range start timestamp
Orig Duration [ns] : Original HGTX range duration
Style : Range style; Start/End or Push/Pop
PID : Process identifier
TID : Thread identifier
NumPPUOps : Number of enclosed PPU operations
Lvl : Stack level, starts at 0
NumChild : Number of children ranges
RangeId : Arbitrary ID for range
ParentId : Range ID of the enclosing range
RangeStack : Range IDs that make up the push/pop stack
命令行使用方法
asys stats -r hgtx_ppu_proj_trace report.asysrep可通过asys stats --help-report hgtx_ppu_proj_trace查看具体帮助信息,支持的选项列举如下:
device=<device_list>:指定统计的PPU device ID列表,多个PPU device ID之间通过/分割。若不指定,默认统计所有PPU devicerange=<regex_filter>:指定参与统计的HGTX range过滤正则表达式。若不指定,默认统计所有HGTX rangeno-graph-mapping:导出结果不包含通过HGGC graph node映射的HGTX range信息
报告结果示例如下:
Row#,Name,Projected Start (ns),Projected Duration (ns),PPU Active Time (ns),Orig Start (ns),Orig Duration (ns),Style,PID,TID,NumPPUOps,Lvl,NumChild,RangeId,ParentId,RangeStack,
1,"profile",777876074,53206947,21448563,776113485,56055065,"PushPop",295684,295684,50,0,10,6,"-",":6",
2,"Loop1",777876074,14961664,10470590,776142784,28572367,"PushPop",295684,295684,5,1,1,7,6,":6:7",
3,"DoProcess",777876074,14961664,10470590,776146124,27485685,"PushPop",295684,295684,5,2,0,8,7,":6:7:8",
...GUI使用指南
规则设置(Settings)
PPU Devices:PPU device过滤器,统计结果按照所选的PPU device进行过滤,默认值为“All”,统计所有PPU devices的数据,此项不能为空。
HGTX graph node mapping:是否投影HGGC graph capture阶段HGTX到PPU侧(通过在HGTX range范围内创建的HGGC graph node建立与PPU侧到关联)。默认值为“Yes”。
Range Name Filter:对结果中的HGTX range name进行过滤,采用(Perl兼容的)正则表达式匹配的方式,默认显示所有HGTX range。带有正则表达式语法检查,当输入的正则表达式语法错误时,出现错误提示并且不允许保存设置
表格右键菜单功能
支持在Timeline View中高亮或缩放至所选的HGTX Range
支持在Timeline View中高亮或缩放至所选的Device Activity
饼图统计:对CPU侧所有HGTX Range以range name或进程进行分类,在PPU侧的投影活动时间进行汇总。可以直观地查看各HGTX Range或进程投影至PPU侧后的运行耗时占比。
2.3.13 HGTX range汇总
汇总asysrep报告中HGTX range的耗时,按照range总耗时降序输出。
依赖的asys采集选项:--trace hgtx
统计规则
按照每HGTX range domain和名称级别进行统计,累加相同domain和名称的HGTX range的耗时时间,若HGTX range包含domain,输出的HGTX range名称格式为domain:range,按照range总耗时降序输出。
若通过process/thread选项指定统计范围,线程匹配thread过滤条件或者所属进程匹配process过滤条件,均参与统计。
hgtx_sum表格列说明如下:
注意“Time”列是根据“Total Time”列的总和计算得出的,表示该range占所有列出ranges执行时间的百分比,而不是根据应用执行时间得到的百分比。
Row# : Row number of the HGTX range summary
Time [%] : Percentage of 'Total Time'
Total Time [ns] : Total time used by all instances of this range
Instances : Number of instances of this range
Avg [ns] : Average execution time of this range
Med [ns] : Median execution time of this range
Min [ns] : Smallest execution time of this range
Max [ns] : Largest execution time of this range
StdDev [ns] : Standard deviation of the time of this range
Style : Range style; Start/End or Push/Pop
Range : Name of the range
命令行使用方法
asys stats -r hgtx_sum report.asysrep可通过asys stats --help-report hgtx_sum查看具体帮助信息。支持的选项列举如下:
rows=<limit>:限制输出的HGTX range的条数process=<pid_list>:指定统计的进程的PID列表,多个PID之间通过/分割。若不指定,默认统计所有进程thread=<tid_list>:指定统计的线程的TID列表,多个TID之间通过/分割。若不指定,默认统计所有线程
报告结果示例如下:
Row#,Time (%),Total Time (ns),Instances,Avg (ns),Med (ns),Min (ns),Max (ns),StdDev (ns),Style,Range,
1,25.7,181837947,1,181837947,181837947,181837947,181837947,0,"PushPop","[prof_range]: iter 6",
2,25.1,177622641,1,177622641,177622641,177622641,177622641,0,"PushPop","[prof_range]: iter 9",
3,25.1,177254919,1,177254919,177254919,177254919,177254919,0,"PushPop","[prof_range]: iter 7",
4,24.1,170843422,1,170843422,170843422,170843422,170843422,0,"PushPop","[prof_range]: iter 8",
...GUI使用指南
规则设置(Settings)
Processes:指定统计的进程。默认为“All”,统计所有进程
Maximum number of results:展示结果的最大行数。默认为-1,表示无上限
饼图统计:对所有HGTX Range的总耗时进行汇总。可以直观地查看各HGTX Range的耗时占比。
2.3.14 OSRT API汇总
汇总asysrep报告中操作系统API(OS runtime API)的耗时,按照API总耗时降序输出。
依赖的asys采集选项:--trace osrt
统计规则
按照每OSRT API名称级别进行统计,累加相同名称API的耗时时间,按照API总耗时降序输出。
osrt_sum表格列说明如下:
注意“Time”列是根据“Total Time”列的总和计算得出的,表示该函数占所有列出函数执行时间的百分比,而不是根据应用执行时间得到的百分比。
Row# : Row number of the OS runtime summary
Time [%] : Percentage of 'Total Time'
Total Time [ns] : Total time used by all executions of this function
Num Calls : Number of calls to this function
Avg [ns] : Average execution time of this function
Med [ns] : Median execution time of this function
Min [ns] : Smallest execution time of this function
Max [ns] : Largest execution time of this function
StdDev [ns] : Standard deviation of the time of this function
Name : Name of the function
命令行使用方法
asys stats -r osrt_sum report.asysrep可通过asys stats --help-report osrt_sum查看具体帮助信息。
报告结果示例如下:
Row#,Time (%),Total Time (ns),Num Calls,Avg (ns),Med (ns),Min (ns),Max (ns),StdDev (ns),Name,
1,85.6,8901500720,255,34907845,4994783,1095,348667026,63811239,"pthread_cond_wait",
2,6.9,721563692,1105,652998,1055069,52083,1072141,485233,"nanosleep",
3,6.7,700892565,7,100127509,100123388,100121020,100143853,8411,"poll",
...GUI使用指南
规则设置(Settings)
该规则没有可以配置的设置选项
饼图统计:对所有OSRT API的总耗时进行汇总。可以直观地查看各OSRT API的耗时占比。
2.3.15 PCCL传输各阶段汇总
分析和汇总asysrep报告中PCCL传输各阶段耗时,按照阶段总耗时降序输出。
依赖的asys采集选项:--trace pccl
统计规则
按照每线程、每channel、每方向、每传输阶段,统计传输阶段的耗时(平均值、最大值、最小值等)、出现次数等指标,按照传输阶段总耗时降序输出。
pccl_stage_sum表格列说明如下:
Row# : Row number of the stage summary
PID : Process identifier
Device ID : PPU device identifier
TID : Thread identifier
Channel ID : PCCL channel identifier
Channel Type : PCCL channel type
Name : Stage name
Total Time [ns] : Stage total time
Instances : Number of this stage
Avg [ns] : Average of stage duration
Med [ns] : Median of stage duration
Min [ns] : Minimum of stage duration
Max [ns] : Maximum of stage duration
Stdev [ns] : Standard deviation of stage duration
命令行使用方法
asys stats --report pccl_stage_sum report.asysrep可通过asys stats --help-report pccl_stage_sum查看具体帮助信息。
报告结果示例如下:
Row#,PID,Device ID,TID,Channel ID,Channel Type,Name,Total Time,Instances,Avg,Med,Min,Max,Stdev,
1,631660,0,631712,1,RX,RecvWait,305528068,24,12730336,13761981,9669723,18509164,2407844,
2,631660,1,631711,1,TX,GPUWait,299988851,24,12499535,12786840,9625474,16580086,2217489,
3,631660,0,631712,1,TX,GPUWait,297674072,24,12403086,12579239,9570100,17151019,2208876,
...GUI使用指南
规则设置(Settings)
该规则没有可以配置的设置选项
饼图统计:对所有PCCL stage/进程/设备的PCCL stage总耗时进行汇总。可以直观地查看在不同统计维度下PCCL stage总的耗时占比。
2.3.16 HGGC PPU memory数据量汇总
汇总asysrep报告中HGGC PPU memory操作(memcpy / memset)的数据量 ,按照memory操作数据量总和降序输出。
依赖的asys采集选项:--trace hggc
统计规则
按照每memory操作类型,统计本类型操作数据量,按照操作数据量总和降序输出。
memcpy根据拷贝的类型进行区分,如
[HGGC memcpy Host-to-Device]/[HGGC memcpy Device-to-Host]
hggc_ppu_mem_size_sum表格列说明如下:
Row# : Row number of the memory summary
Total [bytes] : Total memory utilized by this operation
Count : Number of executions of this operation
Avg [bytes] : Average memory size of this operation
Med [bytes] : Median memory size of this operation
Min [bytes] : Smallest memory size of this operation
Max [bytes] : Largest memory size of this operation
StdDev [bytes] : Standard deviation of the memory size of this operation
Operation : Name of the memory operation
命令行使用方法
asys stats --report hggc_ppu_mem_size_sum report.asysrep可通过asys stats --help-report hggc_ppu_mem_size_sum查看具体帮助信息。
报告结果示例如下:
Row#,Total (bytes),Count,Avg (bytes),Med (bytes),Min (bytes),Max (bytes),StdDev (bytes),Operation,
1,9896352144,564,17546723,1024,12,556254464,74087070,"[HGGC memset]",
2,536876208,342,1569813,16,4,67108864,10157989,"[HGGC memcpy Host-to-Device]",
3,156,44,3,1,1,16,4,"[HGGC memcpy Device-to-Host]",
4,64,12,5,4,4,8,1,"[HGGC memcpy Device-to-Device]",GUI使用指南
规则设置(Settings)
该规则没有可以配置的设置选项。
饼图统计:对所有Memory operation的memory操作数据量进行汇总。可以直观地查看各个Memory operation的memory操作数据量的对比情况。
2.3.17 HGGC PPU memory耗时汇总
汇总asysrep报告中HGGC PPU memory操作(memcpy / memset)的耗时 ,按照memory操作耗时总时长降序输出。
依赖的asys采集选项:--trace hggc
统计规则
按照每memory操作类型,统计本类型操作耗时,按照操作耗时总时长降序输出。
memcpy根据拷贝的类型进行区分,如
[HGGC memcpy Host-to-Device]/[HGGC memcpy Device-to-Host]
hggc_ppu_mem_time_sum表格列说明如下:
注意“Time”列是根据“Total Time”列的总和计算得出的,表示该memory操作类型占所有列出的memory操作耗时总时长的百分比,而不是根据应用执行时间得到的百分比。
Row# : Row number of the memory summary
Time [%] : Percentage of 'Total Time'
Total Time [ns] : Total time used by all executions of this operation
Count : Number of operations to this type
Avg [ns] : Average execution time of this operation
Med [ns] : Median execution time of this operation
Min [ns] : Smallest execution time of this operation
Max [ns] : Largest execution time of this operation
StdDev [ns] : Standard deviation of the time of this operation
Operation : Name of the memory operation
命令行使用方法
asys stats --report hggc_ppu_mem_time_sum report.asysrep可通过asys stats --help-report hggc_ppu_mem_time_sum查看具体帮助信息。
报告结果示例如下:
Row#,Time (%),Total Time (ns),Count,Avg (ns),Med (ns),Min (ns),Max (ns),StdDev (ns),Operation,
1,69.3,19697314,342,57594,1240,1080,2413129,364424,"[HGGC memcpy Host-to-Device]",
2,30.6,8687991,564,15404,720,120,496801,67433,"[HGGC memset]",
3,0.1,20920,44,475,400,320,960,165,"[HGGC memcpy Device-to-Host]",
4,0.1,15600,12,1300,1240,920,1800,293,"[HGGC memcpy Device-to-Device]",GUI使用指南
规则设置(Settings)
该规则没有可以配置的设置选项
饼图统计:对所有Memory operation的耗时进行汇总。可以直观地查看各个Memory operation的耗时占比。
2.3.18 PCCL不同步跟踪
将asysrep报告中的PCCL kernel根据通信进行分组,计算每组通信的PCCL kernel之间执行时间不同步的占比,并导出最晚开始执行的PCCL kernel的信息。
依赖的asys采集选项:
--trace hggc
统计规则
将执行时间上存在重叠的PCCL kernel分入一个通信组,对每个通信组的所有kernel计算如下时间:
重叠时间:本通信组内所有PCCL kernel重叠的时间持续时间:从本通信组第一个kernel开始执行到最后一个kernel停止执行的时间
不同步比例计算方式为:(持续时间 - 重叠时间) / 持续时间。每通信组输出一行跟踪数据,结果按照不同步占比降序输出。
pccl_desync_trace表格列说明如下:
Row# : Row number of PCCL communication trace
Start [ns] : Start time of PCCL communication
Duration [ns] : Eclapsed duration of PCCL communication
Overlap [ns] : Overlapping duration of all PCCL kernel
Desync Rate [%] : Desynchronization rate of PCCL communication
Last Process : Last kernel process ID in this PCCL communication
Last Device : Last kernel device ID in this PCCL communication
Last Kernel : Last kernel ID in this PCCL communication
Max Duration [ns] : Longest kernel duration in this PCCL communication
Min Duration [ns] : Shortest kernel duration in this PCCL communication
Avg Duration [ns] : Average kernel duration in this PCCL communication
Instances : Number of kernel in this PCCL communication
Kernel Name : Name of the PCCL kernel
命令行使用方法
asys stats -r pccl_desync_trace report.asysrep可通过asys stats --help-report pccl_desync_trace查看具体帮助信息,支持的选项列举如下:
hgtx-name:kernel名字前通过
/拼接最接近kernel launch的HGTX range名称base:使用kernel的短名称(仅函数名,不包含参数)进行统计和输出
mangled:使用kernel的mangled名称进行统计和输出
device:指定统计的PPU device ID列表,多个PPU device ID之间通过
/分割。若不指定,默认统计所有PPU device
报告结果示例如下:
Row#,Start (ns),Duration (ns),Overlap (ns),Desync Rate (%),Last Process,Last Device,Last Kernel,Max Duration (ns),Min Duration (ns),Avg Duration (ns),Instances,Kernel Name,
1,113393971366,699213,15256,97.8,1142413,0,38654,697883,15400,538712,8,"pcclKernel_AllReduce_RING_LL_Sum_uint8_t(ncclWorkElem)",
2,113395036610,267497,12450,95.3,1142419,6,38798,266721,14040,191886,8,"pcclKernel_AllReduce_RING_LL_Sum_uint8_t(ncclWorkElem)",
...GUI使用指南
规则设置(Settings)
Kernel Name Mode:Kernel Name的展示模式。包括三种模式:
Base:导出kernel的短名称(仅函数名,不包含参数)
Mangled:导出kernel的mangled名称
Demangled:导出kernel的demangle之后的名称(默认值)
PPU Devices:PPU device过滤器,统计结果按照所选的PPU device进行过滤,默认值为“All”,统计所有PPU devices的数据,此项不能为空。
Add HGTX name as a prefix:使能名字前拼接最接近kernel launch的HGTX名称,通过
/间隔。默认不勾选。
表格右键菜单功能
支持在Timeline View中高亮或缩放至所选追踪的最后一个不同步的PCCL Kernel。
饼图统计:对PCCL不同步情况出现时,最慢的进程/设备进行汇总。可以直观地查看哪个进程/设备上最容易出现PCCL执行时间最晚导致PCCL不同步情况出现。
2.3.19 PCCL不同步汇总
将asysrep报告中的PCCL kernel根据通信进行分组,计算每组通信的PCCL kernel之间执行时间不同步的占比,输出同名PCCL kernel通信组的不同步占比的统计结果。
依赖的asys采集选项:--trace hggc
统计规则
将执行时间上存在重叠的PCCL kernel分入一个通信组,对每个通信组的所有kernel计算如下时间:
重叠时间:本通信组内所有PCCL kernel重叠的时间持续时间:从本通信组第一个kernel开始执行到最后一个kernel停止执行的时间
不同步比例计算方式为:(持续时间 - 重叠时间) / 持续时间。
按照每kernel名称统计通信组的耗时和不同步占比,按照通信组的耗时汇总降序输出。
pccl_desync_summary表格列说明如下:
注意“Time”列是根据“Total Duration”列的总和计算得出的,表示该PCCL kernel所在通信组耗时占所有列出的通信组耗时总时长的百分比,而不是根据应用执行时间得到的百分比。
Row# : Row number of PCCL communication summary
Time [%] : Percentage of 'Total Duration'
Count : Number of communication of this PCCL kernel
Desync Avg [%] : Average desynchronization rate of this PCCL kernel
Desync Med [%] : Median desynchronization rate of this PCCL kernel
Desync Min [%] : Smallest desynchronization rate of this PCCL kernel
Desync Max [%] : Largest desynchronization rate of this PCCL kernel
Desync StdDev [%] : Standard deviation of desynchronization rate of this PCCL kernel
Total Duration [ns] : Total eclapsed duration of all communication of this PCCL kernel
Total Overlap [ns] : Total overlap duration of all communication of this PCCL kernel
Kernel Name : Name of the PCCL kernel
命令行使用方法
asys stats -r pccl_desync_summary report.asysrep可通过asys stats --help-report pccl_desync_summary查看具体帮助信息,支持的选项列举如下:
hgtx-name:kernel名字前通过
/拼接最接近kernel launch的HGTX range名称base:使用kernel的短名称(仅函数名,不包含参数)进行统计和输出
mangled:使用kernel的mangled名称进行统计和输出
device:指定统计的PPU device ID列表,多个PPU device ID之间通过
/分割。若不指定,默认统计所有PPU device
报告结果示例如下:
Row#,Time (%),Count,Desync Avg (%),Desync Med (%),Desync Min (%),Desync Max (%),Desync StdDev (%),Total Duration (ns),Total Overlap (ns),Kernel Name,
1,95.4,4,98.3,98.9,95.3,100.0,1.9,931583768,60421,"pcclKernel_AllReduce_RING_LL_Sum_uint8_t(ncclWorkElem)",
2,4.6,1,100.0,100.0,100.0,100.0,0.0,44549251,17168,"pcclKernel_AllReduce_RING_LL_Sum_double(ncclWorkElem)",GUI使用指南
规则设置(Settings)
Kernel Name Mode:Kernel Name的展示模式。包括三种模式:
Base:导出kernel的短名称(仅函数名,不包含参数)
Mangled:导出kernel的mangled名称
Demangled:导出kernel的demangle之后的名称(默认值)
PPU Devices:PPU device过滤器,统计结果按照所选的PPU device进行过滤,默认值为“All”,统计所有PPU devices的数据,此项不能为空。
Add HGTX name as a prefix:使能名字前拼接最接近kernel launch的HGTX名称,通过
/间隔。默认不勾选。
饼图统计:对所有PCCL kernel通信组的总耗时进行汇总。