
Memcheck使用指南 (v2.1)
1. 概述
HGGC Memcheck是一组用于功能性正确检查的工具套件。该套件中包含了一系列的检查工具,其中,memcheck用于访存越界以及非对齐的检查;initcheck用于未初始化内存使用的检查;synccheck用于非正确使用sync指令的检查;racecheck用于程序中shared memory使用的data hazards检查。
2. 使用介绍
2.1 命令行参数
Option | Values | Default | Description |
coredump-name | |||
demangle | full, simple, no | full | Demangle function names |
destroy-on-device-error | context, kernel | context | Behavior of hggc-memcheck on a precise device error. |
filter | - | - | The filter option can be used to control the kernels that will be checked by the tool |
force-blocking-launches | yes, no | no | Force launches to be blocking |
force-synchronization-limit | { number } | 0 | Set the maximum number of launches occurring on a given stream without forcing a synchronization. A lower value can help reducing tools usage of device memory at the cost of performances. |
help | show help information | ||
launch-count | { number } | 0 | Limit the number of kernel launches to check. The count is only incremented for launches that match the kernel filters. Use 0 for unlimited. |
launch-skip | { number } | 0 | Set the number of kernel launches to skip before starting to check. The count is only incremented for launches that match the kernel filters. |
log-file | - | - | File where hggc-memcheck will write all of its text output. If not specified, memcheck output is written to stdout. |
prefix | { string } | ========= | Changes the prefix string displayed by hggc-memcheck. |
print-limit | { number } | 10000 | When this is set, memcheck will stop printing errors after reaching the given number of errors. Use 0 for unlimited printing. |
report-api-errors | all, explicit, no | explicit | Print errors if any API call fails |
show-backtrace | yes, no | yes | Display a backtrace on error. |
tool | memcheck, initcheck, synccheck, racecheck | memcheck | |
[memcheck option] | |||
leak-check | full, no | no | Print leak information for HGGC allocations(When context is being destroyed). |
padding | { number } | 16384 | size of redzone in bytes. |
[racecheck option] | |||
racecheck-detect-level | warn, error | warn | Set the minimum level of race conditions to detect |
[initcheck option] | |||
track-unused-memory | yes, no | no | Check for unused memory allocations. |
unused-memory-threshold | { number } | 0 | Threshold for unused memory reporting. This is the minimum percentage value under which partially unused allocations are not reported. |
3. Memcheck工具
Memcheck工具用于运行时对HGGC应用中的访存越界进行检查。工具可以准确地global, local以及shared memory的访存越界以及非对齐访问进行检查。Memcheck还可检查用户应用中的device内存泄漏。
3.1 支持的错误种类
memcheck工具支持如下的错误种类检测。
Name | Description | Location | Precision |
Memory access error | global, local, shared内存的访存越界以及非对齐访问 | Device | Precise |
HGGC API error | HGGC API返回失败结果 | Host | Precise |
hggcMalloc memory leaks | 分配的设备内存没有释放,造成内存泄漏 | Host | Precise |
3.2 Memcheck使用
memcheck为hggc-memcheck的默认工具,也可以直接通过--tool选项进行指定。
hggc-memcheck --tool memcheck [memcheck options] user_app [user_app options]3.3 Memcheck报错示例
3.3.1 Memory access error
========= Invalid __global__ atomic of size 4
=========     at: 0x78000088 in TestAlloc(int*)
=========     by thread (10,0,0) in block (0,0,0)
========= Address 0x777c4028 is out of bounds上面是一个访存错误的报错示例。第1行,包含了访问内存的address space,访存指令的种类以及访问内存的大小信息。其中,address space可以为__global__, shared__以及__private。指令的种类包含read,write以及atomic。
第2行,包含了出错指令的pc以及所在函数。编译时,若保留了line info(clang编译使用选项 -gline-tables-only),可以打印出具体的对应到原文件中的行号。
第3行,包含了造成访存错误的thread和block编号。
第4行,包含了访存指令具体访问的地址,以及是何种错误。目前支持out of bounds以及misaligned两种错误。
3.3.2 Leak error
========= Leaked 12 bytes at 0x75f84000上面是一个leak error的报错示例。若通过hggcMalloc分配的内存在其所在HGGC context销毁时未手动释放,则会进行报错。报错包含了分配的内存首地址以及分配的大小。
3.3.3 HGGC API error
========= Program hit hggcErrorInvalidValue (error 1) due to "invalid argument" on HGGC API call to hggcMemcpy.上面是一个HGGC API error的报错示例,包含了API的名字以及返回值。
3.4 HGGC API error检查
hggc-memcheck可以检查用户程序对HGGC API的结果。当返回失败时。hggc-memcheck会打印错误信息,但不会停止进程,也不会进行别的额外处理。
下列非0返回值并不会被报告:
hggcErrorNotReady for hggcEventQuery and hggcStreamQuery APIs.
hggcErrorPeerAccessAlreadyEnabled for hggcDeviceEnablePeerAccess API.
hggcErrorPeerAccessNotEnabled for hggcDeviceDisablePeerAccess API.
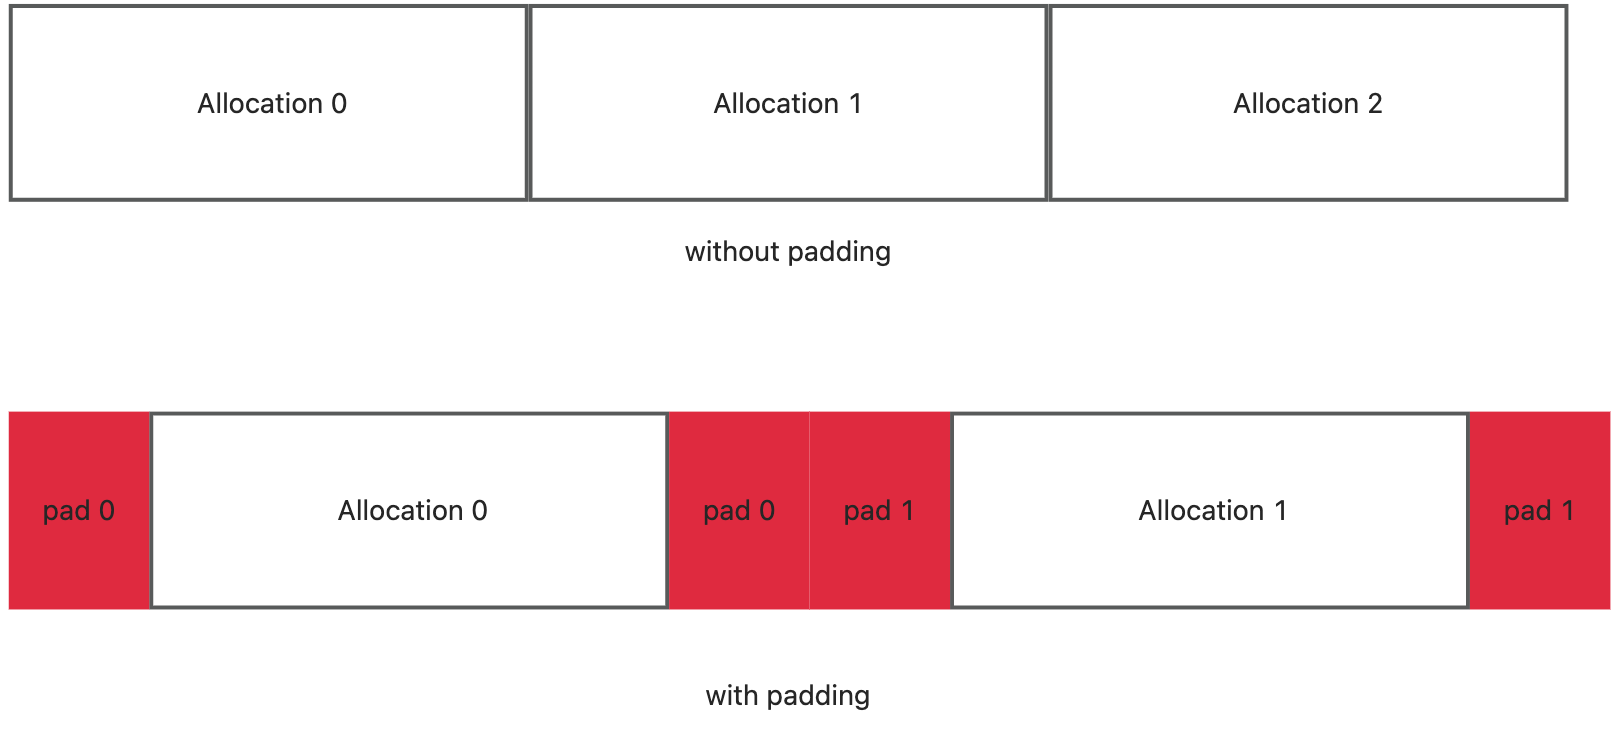
3.5 Padding(Redzone)
hggc-memcheck可以对通过hggcMalloc分配的内存加入padding(red zone)。当没有padding时,若越界到下一个可访问内存,则并不会被检测出错误。通过--padding选项可以指定padding的大小,单位为bytes,指定的大小会自动被round up到4的整数倍。分配内存时,会在分配的内存前后都加入指定大小的redzone。加入padding后,可以使得内存越界的检查更加精确,但是会消耗更多的device memory。
4. Racecheck工具
Racecheck工具用于运行时对HGGC程序进行shared memory的data hazards检查。
HGGC程序中,同一个block的所有thread都可以对同一块shared memory进行访问。程序员对访问顺序的一些不正确理解可能造成shared memory的data race。
目前,Racecheck只会对来自不同warp中threads的data hazrds进行检测。同一个warp内的不会检测。
4.1 Data hazards种类
Data hazard指的是当两个线程都尝试访问同一个内存地址时,造成的不确定行为。最终的结果和两个线程的访问顺序有关。Racecheck会定位以下三种data hazards:
Write-After-Write (WAW) hazards:两个线程都尝试写入同一个地址。
Write-After-Read (WAR) hazards:两个线程,其中一个尝试读,一个尝试写,且目标地址相同,读操作在写操作之前。
Read-After-Write (RAW) hazards两个线程,其中一个尝试读,一个尝试写,且目标地址相同,写操作在读操作之前。
4.2 Racecheck使用
运行hggc-memcheck,通过--tool racecheck选项,来运行Racecheck
hggc-memcheck --tool racecheck [memcheck options] user_app [user_app options]当Racecheck检测到data hazards时,用户可以根据报告修改程序来消除data race。通常在两个内存操作之间的适当位置加上__syncthreads()保证操作的顺序即可消除data hazrds。
当指定tool为racecheck时,不会做任何内存访问的检测。建议用户先运行hggc-memcheck来保证程序中没有非法的内存访问。
4.3 Racecheck报错示例
========= Error: Race reported between Write access at 0x78000048 in test.cu:9:sumKernel(int*, int*)
========= and Read access at 0x78000338 in test.cu:14:sumKernel(int*, int*) [16 hazards]上面展示了一个Racecheck的报错示例,所有报错,都必然包含一个写操作。然后会显示所有和该写操作产生data hazards的操作。report中还会打印操作的PC,如果编译时带了lineinfo,则该操作对应到源代码中的位置也会被打印。
5. Initcheck工具
Initcheck工具用于在运行时检查对未初始化的Device memory使用,当前只支持在device端访问未初始化的global memory时报错。
5.1 Initcheck使用
运行hggc-memcheck,通过--tool initcheck选项,来运行Initcheck
hggc-memcheck --tool initcheck [memcheck options] user_app [user_app options]Initcheck不会对内存的越界与否进行检查,使用Initcheck前需保证访存没有越界。
6. Synccheck工具
Synccheck工具用于运行时对__syncwarp()使用的检查。
6.1 Synccheck使用
运行hggc-memcheck,通过--tool synccheck选项,来运行Synccheck。
hggc-memcheck --tool synccheck [memcheck options] user_app [user_app options]7. 使用示例
7.1 Memcheck使用示例
下面是一段包含了global,shared,local越界以及非对齐访问的代码。
#include <stdio.h>

__device__ int x;

__global__ void TestMisalign(void) {
    *(int*) ((char*)&x + 1) = 42;
}

__device__ __noinline__ void init(int *addr, int val) {
  *addr = val;
}

__global__ void TestAlloc(int *addr) {
  unsigned i = threadIdx.x;
  atomicAdd(&addr[i], 1);
}

__global__ void TestShared() {

  extern __shared__ int d[ ];

  init(&d[threadIdx.x], 1);
}

__global__ void TestPrivate(int i) {
  int a[10];
  init(&a[i], 1);
}

int main() {
  int a[10];
  for (int i = 0; i < 10; ++i) {
      a[i] = i;
  }
  int *da = nullptr;
  hggcMalloc((void **)&da, 10*sizeof(int));
  hggcMemcpy(da, a, 10*sizeof(int), hggcMemcpyHostToDevice);
  TestAlloc<<<1, 11>>>(da);
  hggcDeviceSynchronize();

  TestShared<<<1, 11, 10*sizeof(int)>>>();
  hggcDeviceSynchronize();

  TestPrivate<<<1, 1>>>(10);
  hggcDeviceSynchronize();

  TestMisalign<<<1, 1>>>();
  hggcDeviceSynchronize();

  return 0;
}使用如下命令,编译上述码,并运行memcheck工具。
clang++ test.cu -L ${PATH_TO_PPU_SDK}/lib/ -lhggc -lhggcrt1
hggc-memcheck --destroy-on-device-error kernel ./a.out
得到如下运行结果:
========= Invalid __global__ atomic of size 4
=========     at: 0x760000f8 in TestAlloc(int*)
=========     by thread (10,0,0) in block (0,0,0)
=========     Address 0x75a40028 is out of bounds
=========     Saved host backtrace up to driver entry point at kernel launch time
=========     Host Frame: (hgLaunchKernel + 0xad6) [0x7fae725da766 ]
=========     Host Frame: (hggcapiLaunchKernel + 0xad) [0x7fae71f8c00d ]
=========     Host Frame: (hggcLaunchKernel + 0x3e8) [0x7fae720be6c8 ]
=========     Host Frame: (_Z9TestAllocPi + 0x78) [0x400a58 ]
=========     Host Frame: (main + 0xd9) [0x400c39 ]
=========     Host Frame: (__libc_start_main + 0xe7) [0x7fae7124cc87 ]
=========     Host Frame: (_start + 0x2a) [0x40089a ]
=========
========= Invalid __shared__ write of size 4
=========     at: 0x76000080 in init(int*, int)
=========     by thread (10,0,0) in block (0,0,0)
=========     Address 0x00000028 is out of bounds
=========     Saved host backtrace up to driver entry point at kernel launch time
=========     Host Frame: (hgLaunchKernel + 0xad6) [0x7fae725da766 ]
=========     Host Frame: (hggcapiLaunchKernel + 0xad) [0x7fae71f8c00d ]
=========     Host Frame: (hggcLaunchKernel + 0x3e8) [0x7fae720be6c8 ]
=========     Host Frame: (_Z10TestSharedv + 0x6c) [0x400acc ]
=========     Host Frame: (main + 0x177) [0x400cd7 ]
=========     Host Frame: (__libc_start_main + 0xe7) [0x7fae7124cc87 ]
=========     Host Frame: (_start + 0x2a) [0x40089a ]
=========
========= Invalid __private__ write of size 4
=========     at: 0x76000080 in init(int*, int)
=========     by thread (0,0,0) in block (0,0,0)
=========     Address 0x0000002c is out of bounds
=========     Saved host backtrace up to driver entry point at kernel launch time
=========     Host Frame: (hgLaunchKernel + 0xad6) [0x7fae725da766 ]
=========     Host Frame: (hggcapiLaunchKernel + 0xad) [0x7fae71f8c00d ]
=========     Host Frame: (hggcLaunchKernel + 0x3e8) [0x7fae720be6c8 ]
=========     Host Frame: (_Z11TestPrivatei + 0x77) [0x400b57 ]
=========     Host Frame: (main + 0x214) [0x400d74 ]
=========     Host Frame: (__libc_start_main + 0xe7) [0x7fae7124cc87 ]
=========     Host Frame: (_start + 0x2a) [0x40089a ]
=========
========= Invalid __global__ write of size 4
=========     at: 0x76000040 in TestMisalign()
=========     by thread (0,0,0) in block (0,0,0)
=========     Address 0x75b00001 is misaligned
=========     Saved host backtrace up to driver entry point at kernel launch time
=========     Host Frame: (hgLaunchKernel + 0xad6) [0x7fae725da766 ]
=========     Host Frame: (hggcapiLaunchKernel + 0xad) [0x7fae71f8c00d ]
=========     Host Frame: (hggcLaunchKernel + 0x3e8) [0x7fae720be6c8 ]
=========     Host Frame: (_Z12TestMisalignv + 0x6c) [0x4009cc ]
=========     Host Frame: (main + 0x2ac) [0x400e0c ]
=========     Host Frame: (__libc_start_main + 0xe7) [0x7fae7124cc87 ]
=========     Host Frame: (_start + 0x2a) [0x40089a ]
=========
========= ERROR SUMMARY: 4 errors通过编译选项-gline-tables-only,可以在编译时保留行号信息,使得memcheck在报错时提供发生越界的指令对应到源文件中的位置。
clang++ test.cu -L ../PPU_SDK/lib/ -lhggc -lhggcrt1 -gline-tables-only
hggc-memcheck --destroy-on-device-error kernel ./a.out
运行结果:
========= Invalid __global__ atomic of size 4
=========     at: 0x770000f8 in test.cu:15:TestAlloc(int*)
=========     by thread (10,0,0) in block (0,0,0)
=========     Address 0x75f40028 is out of bounds
=========     Saved host backtrace up to driver entry point at kernel launch time
=========     Host Frame: (hgLaunchKernel + 0xad6) [0x7f0b5bcdd766 ]
=========     Host Frame: (hggcapiLaunchKernel + 0xad) [0x7f0b5b68f00d ]
=========     Host Frame: (hggcLaunchKernel + 0x3e8) [0x7f0b5b7c16c8 ]
=========     Host Frame: (_Z9TestAllocPi + 0x78) [0x400a58 ]
=========     Host Frame: (main + 0xd9) [0x400c39 ]
=========     Host Frame: (__libc_start_main + 0xe7) [0x7f0b5a94fc87 ]
=========     Host Frame: (_start + 0x2a) [0x40089a ]
=========
========= Invalid __shared__ write of size 4
=========     at: 0x77000080 in test.cu:10:init(int*, int)
=========     by thread (10,0,0) in block (0,0,0)
=========     Address 0x00000028 is out of bounds
=========     Saved host backtrace up to driver entry point at kernel launch time
=========     Host Frame: (hgLaunchKernel + 0xad6) [0x7f0b5bcdd766 ]
=========     Host Frame: (hggcapiLaunchKernel + 0xad) [0x7f0b5b68f00d ]
=========     Host Frame: (hggcLaunchKernel + 0x3e8) [0x7f0b5b7c16c8 ]
=========     Host Frame: (_Z10TestSharedv + 0x6c) [0x400acc ]
=========     Host Frame: (main + 0x177) [0x400cd7 ]
=========     Host Frame: (__libc_start_main + 0xe7) [0x7f0b5a94fc87 ]
=========     Host Frame: (_start + 0x2a) [0x40089a ]
=========
========= Invalid __private__ write of size 4
=========     at: 0x77000080 in test.cu:10:init(int*, int)
=========     by thread (0,0,0) in block (0,0,0)
=========     Address 0x0000002c is out of bounds
=========     Saved host backtrace up to driver entry point at kernel launch time
=========     Host Frame: (hgLaunchKernel + 0xad6) [0x7f0b5bcdd766 ]
=========     Host Frame: (hggcapiLaunchKernel + 0xad) [0x7f0b5b68f00d ]
=========     Host Frame: (hggcLaunchKernel + 0x3e8) [0x7f0b5b7c16c8 ]
=========     Host Frame: (_Z11TestPrivatei + 0x77) [0x400b57 ]
=========     Host Frame: (main + 0x214) [0x400d74 ]
=========     Host Frame: (__libc_start_main + 0xe7) [0x7f0b5a94fc87 ]
=========     Host Frame: (_start + 0x2a) [0x40089a ]
=========
========= Invalid __global__ write of size 4
=========     at: 0x77000040 in test.cu:6:TestMisalign()
=========     by thread (0,0,0) in block (0,0,0)
=========     Address 0x76000001 is misaligned
=========     Saved host backtrace up to driver entry point at kernel launch time
=========     Host Frame: (hgLaunchKernel + 0xad6) [0x7f0b5bcdd766 ]
=========     Host Frame: (hggcapiLaunchKernel + 0xad) [0x7f0b5b68f00d ]
=========     Host Frame: (hggcLaunchKernel + 0x3e8) [0x7f0b5b7c16c8 ]
=========     Host Frame: (_Z12TestMisalignv + 0x6c) [0x4009cc ]
=========     Host Frame: (main + 0x2ac) [0x400e0c ]
=========     Host Frame: (__libc_start_main + 0xe7) [0x7f0b5a94fc87 ]
=========     Host Frame: (_start + 0x2a) [0x40089a ]
=========
========= ERROR SUMMARY: 4 errors使用memcheck工具时,还可以对程序中的device内存泄漏进行检查。通过选项--leak-check full,可以在HGGC context销毁时,报告未释放的内存。
还是针对之前的例子,执行如下命令:
hggc-memcheck --destroy-on-device-error kernel --leak-check full ./a.out除了正常的报错信息外,还输出了如下信息。报错中包含了泄漏的大小、地址,以及在host端调用API分配时保存的backtrace。
========= Leaked 40 bytes at 0x770c0000
=========     Saved host backtrace up to driver entry point at hggcMalloc time
=========     Host Frame: (hggcapiMalloc + 0x64) [0x7f37ca542b74 ]
=========     Host Frame: (hggcMalloc + 0x2cb) [0x7f37ca5c251b ]
=========     Host Frame: (main + 0x52) [0x400bb2 ]
=========     Host Frame: (__libc_start_main + 0xe7) [0x7f37c9801c87 ]
=========     Host Frame: (_start + 0x2a) [0x40089a ]
=========
========= LEAK SUMMARY: 40 bytes leaked in 1 allocations
7.2 Racecheck使用示例
#define N 1024
#define THREADS_PER_BLOCK 256

__global__ void race(int *d_array) {
    __shared__ int s_array[N];

    int tid = threadIdx.x + blockIdx.x * blockDim.x;
    s_array[tid] = tid;

    if (tid < N-1) {
        d_array[tid] = s_array[tid]+s_array[tid +1];
    }
}

int main() {
    int h_array[N];
    int *d_array;

    hggcMalloc((void **)&d_array, N * sizeof(int));
    race<<<(N + THREADS_PER_BLOCK - 1) / THREADS_PER_BLOCK, THREADS_PER_BLOCK>>>(d_array);
    hggcMemcpy(h_array, d_array, N * sizeof(int), hggcMemcpyDeviceToHost);
    hggcFree(d_array);

    return 0;
}上述程序中,总共有1024个threads,分成32个warp(1024 / 32 = 32)。每个thread在第8行会写入shared memory,在第11行会读取自己写入的以及相邻的thread写入的shared memory。Racecheck工具目前只对不同warp间的data hazard进行检查,因此,每个warp的最后一个thread的读都和下一个warp的第一个thread的写产生了data hazard,总共有31 * 4(bytes)个hazard。
运行,如下命令:
clang++ test2.cu -L ../PPU_SDK/lib/ -lhggc -lhggcrt1 -gline-tables-only
hggc-memcheck --tool racecheck a.out
得到如下输出:
========= Error: Race reported between Write access at 0x78000058 in test2.cu:8:race(int*)
=========     and Read access at 0x78000070 in test2.cu:11:race(int*) [124 hazards]
=========
========= RACECHECK SUMMARY: 1 hazard(s) displayed
7.3 Initcheck使用示例
__global__
void vectorAdd(int *v)
{
    int tx = threadIdx.x + blockDim.x * blockIdx.x;

    v[tx] += tx;
}

int main(int argc, char **argv)
{
    int *d_vec = NULL;

    hggcMalloc((void**)&d_vec, sizeof(int) * BLOCKS * THREADS);
    hggcMemset(d_vec, 0, BLOCKS * THREADS);

    vectorAdd<<<BLOCKS, THREADS>>>(d_vec);
    hggcDeviceSynchronize();

    hggcFree(d_vec);
    return 0;
}上述程序中,14行的hggcMemset的size为乘以数据类型的size,因此d_vec指向的内存并未完全初始化,编译上述程序并通过如下命令进行检查。
hggc-memcheck --tool initcheck ./a.out部分报错信息如下:
========= Uninitialized __global__ memory read of size 4
=========     at: 0x00000130 in vectorAdd(int*)
=========     by thread (4,0,0) in block (0,0,0)
=========     Address 0x75680010
=========     Saved host backtrace up to driver entry point at kernel launch time
=========     Host Frame: (hggcapiLaunchKernel + 0xa8) [0x7fc237b3cee8 ]
...
7.4 Synccheck使用示例
#define THREADS 32

__shared__ int smem[THREADS];

__global__ void
myKernel(int *sum_out)
{
    int tx = threadIdx.x;

    unsigned int mask = __ballot_sync(0xffffffff, tx < (THREADS / 2));

    if (tx <= (THREADS / 2)) {
        smem[tx] = tx;

        __syncwarp(mask);

        *sum_out = 0;
        for (int i = 0; i < (THREADS / 2); ++i)
            *sum_out += smem[i];
    }

    __syncthreads();
}


int main(int argc, char *argv[ ])

{
    int *sum_out = NULL;

    hggcMalloc((void**)&sum_out, sizeof(int));

    myKernel<<<1,THREADS>>>(sum_out);

    hggcDeviceSynchronize();
    hggcFree(sum_out);

    return 0;
}上述程序中,mask的值为0xffff,但是thread0~16都会执行15行的__syncwarp。实际执行的thread大于同步的mask时,认为是错误的同步编译上述程序并运行如下命令检查:
hggc-memcheck --tool synccheck a.out部分报错信息如下:
========= Barrier error detected. Invalid arguments
=========     at 0x00000178 in myKernel(int*)
=========     by thread (16,0,0) in block (0,0,0)
=========     Saved host backtrace up to driver entry point at kernel launch time
=========     Host Frame: (hggcapiLaunchKernel + 0xa8) [0x7f83c41a1ee8 ]
=========     Host Frame: (hggcLaunchKernel + 0x267) [0x7f83c41ca6a7 ]
......
7.5 coredump使用示例
memcheck支持在检查出越界时产生coredump信息,辅助用户定位kernel代码的越界问题。
__global__ void foo(int *a) {
  a[threadIdx.x] = 0;
}

int main() {
  int *a;
  hggcMalloc((void **)&a, 32 * sizeof(int));
  foo<<<1, 33>>>(a);

  return 0;
}
上面是一个简单的访存越界的例子。运行如下命令:
hgcc test.cu -G
hggc-memcheck --generate-coredump yes --coredump-name hggc.core a.out
产生的报错信息如下:
========= Invalid __global__ write of size 4
=========     at: 0x00000128 in test.cu:2:foo(int*)
=========     by thread (32,0,0) in block (0,0,0)
=========     Address 0xb1800080 is out of bounds
=========     and is 1 bytes after the nearest allocation at 0xb1800000 of size 128 bytes
=========     Saved host backtrace up to driver entry point at kernel launch time
=========     Host Frame: (hggcapiLaunchKernel + 0xa8) [0x7fbb7a959678 ]
=========     Host Frame: (hggcLaunchKernel + 0x267) [0x7fbb7a983787 ]
=========     Host Frame: (_ZL22__device_stub__Z3fooPiPi + 0xf9) [0x400d5f ]
=========     Host Frame: (_Z3fooPi + 0x18) [0x400d9b ]
=========     Host Frame: (main + 0x96) [0x400c41 ]
=========     Host Frame: (__libc_start_main + 0xe7) [0x7fbb7abc4c87 ]
=========     Host Frame: (_start + 0x2a) [0x400a1a ]
=========
========= Generating coredump file hggc.core
========= It can be loaded in the debugger with the following command:
========= ppu-gdb -ex 'target alippucore hggc.core'
=========
========= ERROR SUMMARY: 1 errors第15~17行表示coredump产生成功,并给出了通过ppu-gdb工具查看coredump的提示,直接运行提示中的命令,即可直接定位到产生越界的位置:
#0  0x00000000b2000038 in foo (a=0xb1800000) at test.cu:2
2         a[threadIdx.x] = 0;
8. 已知问题
当使用hggc graph的方式luanch kernel时,hggc-memcheck会强制使用dynamic graph的形式。
当在多线程使用hggc graph时,若多个线程同时luanch的graph中存在多个kernel nodes时,可能会出现错误或死锁。
使用racecheck检查async copy时(vmem load to tsm),只能准确检测通过commit group进行同步的async copy。对通过mbar同步的async copy,可能会存在误报。
9. 常见问题
Q:程序运行退出时显示“Error: process didn't terminate successfully”
A:说明用户进程没有正常退出,通常是出现了segmentation fault。
Q:程序运行退出时显示“Internal Sanitizer Error: an uncaught error occured...”
A:通常是因为memcheck无法分配出足够的内存。memcheck在运行时需要额外分配大量的内存,当分配失败时,memcheck将会放弃之后的所有check,但不会阻止用户进程继续运行。发现这个报错后,可以尝试通过force-blocking-launches/force-synchronization-limit选项,强制在指定launch次数后进行同步,来减少memcheck的内存占用。