
本文介绍http_logs测试结果。
配置信息
项目 | 说明 |
实例配置 |
|
分片数 |
|
压测结果
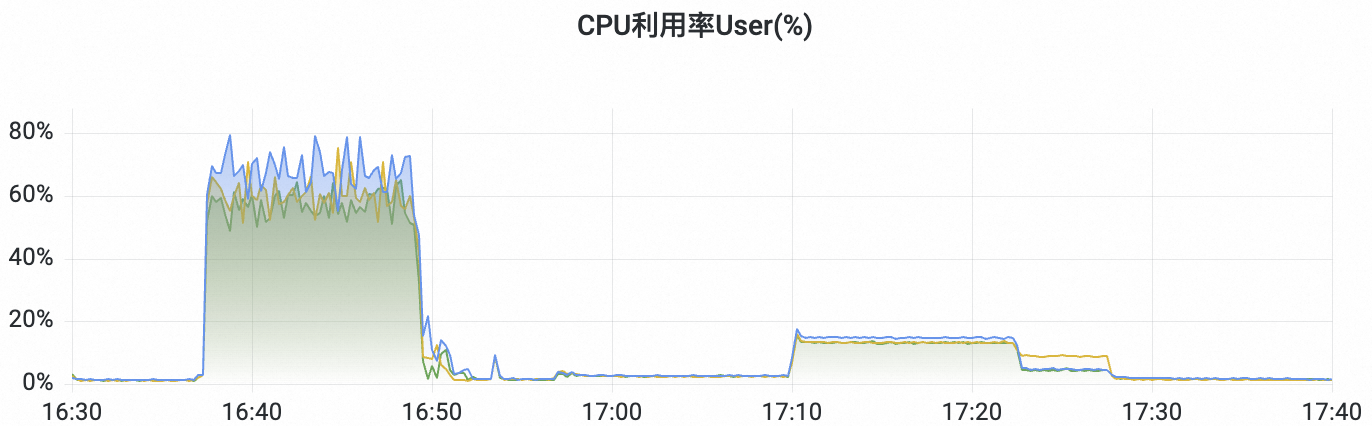
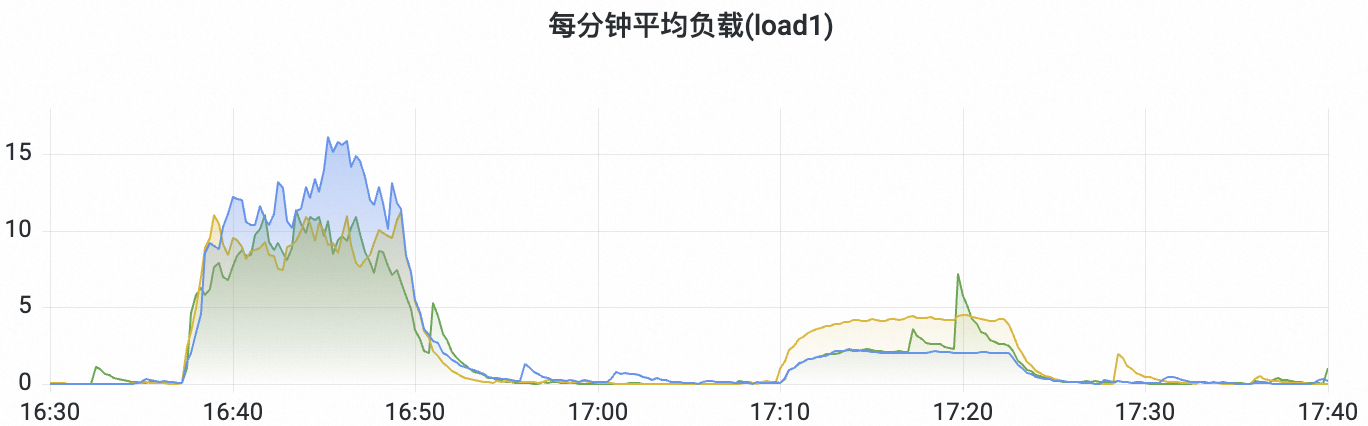
系统资源指标
基准测试报告
Metric | Task | Value | Unit |
Cumulative indexing time of primary shards | 96.02483333333333 | min | |
Min cumulative indexing time across primary shards | 0 | min | |
Median cumulative indexing time across primary shards | 0.6908 | min | |
Max cumulative indexing time across primary shards | 13.357216666666666 | min | |
Cumulative indexing throttle time of primary shards | 0 | min | |
Min cumulative indexing throttle time across primary shards | 0 | min | |
Median cumulative indexing throttle time across primary shards | 0 | min | |
Max cumulative indexing throttle time across primary shards | 0 | min | |
Cumulative merge time of primary shards | 62.5407 | min | |
Cumulative merge count of primary shards | 338 | ||
Min cumulative merge time across primary shards | 0 | min | |
Median cumulative merge time across primary shards | 0.09385 | min | |
Max cumulative merge time across primary shards | 11.123383333333333 | min | |
Cumulative merge throttle time of primary shards | 33.66108333333333 | min | |
Min cumulative merge throttle time across primary shards | 0 | min | |
Median cumulative merge throttle time across primary shards | 0 | min | |
Max cumulative merge throttle time across primary shards | 6.664866666666667 | min | |
Cumulative refresh time of primary shards | 28.387116666666667 | min | |
Cumulative refresh count of primary shards | 845 | ||
Min cumulative refresh time across primary shards | 0 | min | |
Median cumulative refresh time across primary shards | 0.21836666666666668 | min | |
Max cumulative refresh time across primary shards | 3.947983333333333 | min | |
Cumulative flush time of primary shards | 31.678216666666668 | min | |
Cumulative flush count of primary shards | 219 | ||
Min cumulative flush time across primary shards | 0 | min | |
Median cumulative flush time across primary shards | 0.17058333333333334 | min | |
Max cumulative flush time across primary shards | 4.8444666666666665 | min | |
Total Young Gen GC time | 70.345 | s | |
Total Young Gen GC count | 1652 | ||
Total Old Gen GC time | 0 | s | |
Total Old Gen GC count | 0 | ||
Store size | 19.0481973066926 | GB | |
Translog size | 2.5099143385887146e-06 | GB | |
Heap used for segments | 0 | MB | |
Heap used for doc values | 0 | MB | |
Heap used for terms | 0 | MB | |
Heap used for norms | 0 | MB | |
Heap used for points | 0 | MB | |
Heap used for stored fields | 0 | MB | |
Segment count | 43 | ||
Min Throughput | index-append | 347226.24 | docs/s |
Mean Throughput | index-append | 362489.83 | docs/s |
Median Throughput | index-append | 360842.46 | docs/s |
Max Throughput | index-append | 380265.05 | docs/s |
50th percentile latency | index-append | 101.52973001822829 | ms |
90th percentile latency | index-append | 174.12889120168984 | ms |
99th percentile latency | index-append | 294.076322163455 | ms |
99.9th percentile latency | index-append | 383.0756519942088 | ms |
99.99th percentile latency | index-append | 474.0800815746041 | ms |
100th percentile latency | index-append | 567.0780669897795 | ms |
50th percentile service time | index-append | 101.52973001822829 | ms |
90th percentile service time | index-append | 174.12889120168984 | ms |
99th percentile service time | index-append | 294.076322163455 | ms |
99.9th percentile service time | index-append | 383.0756519942088 | ms |
99.99th percentile service time | index-append | 474.0800815746041 | ms |
100th percentile service time | index-append | 567.0780669897795 | ms |
error rate | index-append | 0.00 | % |
Min Throughput | wait-until-merges-finish | 0.01 | ops/s |
Mean Throughput | wait-until-merges-finish | 0.01 | ops/s |
Median Throughput | wait-until-merges-finish | 0.01 | ops/s |
Max Throughput | wait-until-merges-finish | 0.01 | ops/s |
100th percentile latency | wait-until-merges-finish | 142961.9787329575 | ms |
100th percentile service time | wait-until-merges-finish | 142961.9787329575 | ms |
error rate | wait-until-merges-finish | 0.00 | % |
Min Throughput | default | 8.01 | ops/s |
Mean Throughput | default | 8.01 | ops/s |
Median Throughput | default | 8.01 | ops/s |
Max Throughput | default | 8.01 | ops/s |
50th percentile latency | default | 3.0086994520388544 | ms |
90th percentile latency | default | 9.965826524421574 | ms |
99th percentile latency | default | 11.008469861699348 | ms |
100th percentile latency | default | 26.511861942708492 | ms |
50th percentile service time | default | 2.008806506637484 | ms |
90th percentile service time | default | 9.395253949332982 | ms |
99th percentile service time | default | 10.025381053565152 | ms |
100th percentile service time | default | 25.79023700673133 | ms |
error rate | default | 0.00 | % |
Min Throughput | term | 49.20 | ops/s |
Mean Throughput | term | 49.23 | ops/s |
Median Throughput | term | 49.23 | ops/s |
Max Throughput | term | 49.27 | ops/s |
50th percentile latency | term | 6.855602492578328 | ms |
90th percentile latency | term | 11.69242230243981 | ms |
99th percentile latency | term | 47.51210636692129 | ms |
100th percentile latency | term | 60.75358996167779 | ms |
50th percentile service time | term | 5.700481066014618 | ms |
90th percentile service time | term | 10.472511139232665 | ms |
99th percentile service time | term | 20.373463727301193 | ms |
100th percentile service time | term | 60.19569095224142 | ms |
error rate | term | 0.00 | % |
Min Throughput | range | 1.00 | ops/s |
Mean Throughput | range | 1.01 | ops/s |
Median Throughput | range | 1.01 | ops/s |
Max Throughput | range | 1.01 | ops/s |
50th percentile latency | range | 9.533086966257542 | ms |
90th percentile latency | range | 11.593271023593843 | ms |
99th percentile latency | range | 13.014930022182202 | ms |
100th percentile latency | range | 63.355737016536295 | ms |
50th percentile service time | range | 7.672585023101419 | ms |
90th percentile service time | range | 9.853146516252309 | ms |
99th percentile service time | range | 10.909930769121537 | ms |
100th percentile service time | range | 61.63533206563443 | ms |
error rate | range | 0.00 | % |
Min Throughput | 200s-in-range | 32.98 | ops/s |
Mean Throughput | 200s-in-range | 32.98 | ops/s |
Median Throughput | 200s-in-range | 32.98 | ops/s |
Max Throughput | 200s-in-range | 32.98 | ops/s |
50th percentile latency | 200s-in-range | 4.311734694056213 | ms |
90th percentile latency | 200s-in-range | 10.907246905844662 | ms |
99th percentile latency | 200s-in-range | 28.443391487235253 | ms |
100th percentile latency | 200s-in-range | 38.23821316473186 | ms |
50th percentile service time | 200s-in-range | 3.12557106371969 | ms |
90th percentile service time | 200s-in-range | 9.537175332661718 | ms |
99th percentile service time | 200s-in-range | 27.872975110076418 | ms |
100th percentile service time | 200s-in-range | 37.259861011989415 | ms |
error rate | 200s-in-range | 0.00 | % |
Min Throughput | 400s-in-range | 49.99 | ops/s |
Mean Throughput | 400s-in-range | 49.99 | ops/s |
Median Throughput | 400s-in-range | 49.99 | ops/s |
Max Throughput | 400s-in-range | 50.00 | ops/s |
50th percentile latency | 400s-in-range | 3.5948780132457614 | ms |
90th percentile latency | 400s-in-range | 10.792034689802676 | ms |
99th percentile latency | 400s-in-range | 13.870618947548817 | ms |
100th percentile latency | 400s-in-range | 18.7013199320063 | ms |
50th percentile service time | 400s-in-range | 2.020227024331689 | ms |
90th percentile service time | 400s-in-range | 9.364983905106783 | ms |
99th percentile service time | 400s-in-range | 11.734412480145721 | ms |
100th percentile service time | 400s-in-range | 17.261439934372902 | ms |
error rate | 400s-in-range | 0.00 | % |
Min Throughput | hourly_agg | 0.20 | ops/s |
Mean Throughput | hourly_agg | 0.20 | ops/s |
Median Throughput | hourly_agg | 0.20 | ops/s |
Max Throughput | hourly_agg | 0.20 | ops/s |
50th percentile latency | hourly_agg | 136.54737797332928 | ms |
90th percentile latency | hourly_agg | 142.0227188616991 | ms |
99th percentile latency | hourly_agg | 151.89586265129037 | ms |
100th percentile latency | hourly_agg | 152.79366890899837 | ms |
50th percentile service time | hourly_agg | 132.4190204613842 | ms |
90th percentile service time | hourly_agg | 138.22795343585312 | ms |
99th percentile service time | hourly_agg | 146.77236715331674 | ms |
100th percentile service time | hourly_agg | 147.11265498772264 | ms |
error rate | hourly_agg | 0.00 | % |
Min Throughput | multi_term_agg | 0.20 | ops/s |
Mean Throughput | multi_term_agg | 0.20 | ops/s |
Median Throughput | multi_term_agg | 0.20 | ops/s |
Max Throughput | multi_term_agg | 0.20 | ops/s |
50th percentile latency | multi_term_agg | 2367.4558379570954 | ms |
90th percentile latency | multi_term_agg | 2412.063580157701 | ms |
99th percentile latency | multi_term_agg | 2448.738736625528 | ms |
100th percentile latency | multi_term_agg | 2456.9199619581923 | ms |
50th percentile service time | multi_term_agg | 2364.4321935717016 | ms |
90th percentile service time | multi_term_agg | 2409.9422270199284 | ms |
99th percentile service time | multi_term_agg | 2445.0612810847815 | ms |
100th percentile service time | multi_term_agg | 2453.7810110487044 | ms |
error rate | multi_term_agg | 0.00 | % |
Min Throughput | scroll | 25.06 | pages/s |
Mean Throughput | scroll | 25.10 | pages/s |
Median Throughput | scroll | 25.09 | pages/s |
Max Throughput | scroll | 25.18 | pages/s |
50th percentile latency | scroll | 236.0118554206565 | ms |
90th percentile latency | scroll | 253.0103184399195 | ms |
99th percentile latency | scroll | 275.72076155687665 | ms |
100th percentile latency | scroll | 305.800141999498 | ms |
50th percentile service time | scroll | 234.054452565033 | ms |
90th percentile service time | scroll | 251.18821508949623 | ms |
99th percentile service time | scroll | 274.1976609290576 | ms |
100th percentile service time | scroll | 303.36535605601966 | ms |
error rate | scroll | 0.00 | % |
Min Throughput | desc_sort_size | 0.50 | ops/s |
Mean Throughput | desc_sort_size | 0.50 | ops/s |
Median Throughput | desc_sort_size | 0.50 | ops/s |
Max Throughput | desc_sort_size | 0.50 | ops/s |
50th percentile latency | desc_sort_size | 30.20302194636315 | ms |
90th percentile latency | desc_sort_size | 34.84157184138895 | ms |
99th percentile latency | desc_sort_size | 42.068427709164105 | ms |
100th percentile latency | desc_sort_size | 42.87396895233542 | ms |
50th percentile service time | desc_sort_size | 27.651965501718223 | ms |
90th percentile service time | desc_sort_size | 31.990970799233764 | ms |
99th percentile service time | desc_sort_size | 40.97331579308957 | ms |
100th percentile service time | desc_sort_size | 41.21278098318726 | ms |
error rate | desc_sort_size | 0.00 | % |
Min Throughput | asc_sort_size | 0.50 | ops/s |
Mean Throughput | asc_sort_size | 0.50 | ops/s |
Median Throughput | asc_sort_size | 0.50 | ops/s |
Max Throughput | asc_sort_size | 0.50 | ops/s |
50th percentile latency | asc_sort_size | 12.307231954764575 | ms |
90th percentile latency | asc_sort_size | 19.182581291534007 | ms |
99th percentile latency | asc_sort_size | 28.305189085658643 | ms |
100th percentile latency | asc_sort_size | 28.89118203893304 | ms |
50th percentile service time | asc_sort_size | 9.823135973419994 | ms |
90th percentile service time | asc_sort_size | 17.718770098872483 | ms |
99th percentile service time | asc_sort_size | 25.830642610089857 | ms |
100th percentile service time | asc_sort_size | 26.263036066666245 | ms |
error rate | asc_sort_size | 0.00 | % |
Min Throughput | desc_sort_timestamp | 0.50 | ops/s |
Mean Throughput | desc_sort_timestamp | 0.50 | ops/s |
Median Throughput | desc_sort_timestamp | 0.50 | ops/s |
Max Throughput | desc_sort_timestamp | 0.50 | ops/s |
50th percentile latency | desc_sort_timestamp | 67.83323152922094 | ms |
90th percentile latency | desc_sort_timestamp | 75.52366814343259 | ms |
99th percentile latency | desc_sort_timestamp | 80.46719964477235 | ms |
100th percentile latency | desc_sort_timestamp | 83.0270980950445 | ms |
50th percentile service time | desc_sort_timestamp | 65.52262848708779 | ms |
90th percentile service time | desc_sort_timestamp | 73.47431293455884 | ms |
99th percentile service time | desc_sort_timestamp | 79.71515331533737 | ms |
100th percentile service time | desc_sort_timestamp | 80.43214201461524 | ms |
error rate | desc_sort_timestamp | 0.00 | % |
Min Throughput | asc_sort_timestamp | 0.50 | ops/s |
Mean Throughput | asc_sort_timestamp | 0.50 | ops/s |
Median Throughput | asc_sort_timestamp | 0.50 | ops/s |
Max Throughput | asc_sort_timestamp | 0.50 | ops/s |
50th percentile latency | asc_sort_timestamp | 14.132936543319374 | ms |
90th percentile latency | asc_sort_timestamp | 19.143687351606786 | ms |
99th percentile latency | asc_sort_timestamp | 21.206677736481655 | ms |
100th percentile latency | asc_sort_timestamp | 21.811246988363564 | ms |
50th percentile service time | asc_sort_timestamp | 12.537293951027095 | ms |
90th percentile service time | asc_sort_timestamp | 17.926402122247964 | ms |
99th percentile service time | asc_sort_timestamp | 18.56849261792377 | ms |
100th percentile service time | asc_sort_timestamp | 19.111867994070053 | ms |
error rate | asc_sort_timestamp | 0.00 | % |
Min Throughput | desc_sort_with_after_timestamp | 0.50 | ops/s |
Mean Throughput | desc_sort_with_after_timestamp | 0.51 | ops/s |
Median Throughput | desc_sort_with_after_timestamp | 0.51 | ops/s |
Max Throughput | desc_sort_with_after_timestamp | 0.55 | ops/s |
50th percentile latency | desc_sort_with_after_timestamp | 34.18125654570758 | ms |
90th percentile latency | desc_sort_with_after_timestamp | 40.8586090663448 | ms |
99th percentile latency | desc_sort_with_after_timestamp | 50.589673066278934 | ms |
100th percentile latency | desc_sort_with_after_timestamp | 53.850436001084745 | ms |
50th percentile service time | desc_sort_with_after_timestamp | 31.65915299905464 | ms |
90th percentile service time | desc_sort_with_after_timestamp | 38.16645856713876 | ms |
99th percentile service time | desc_sort_with_after_timestamp | 47.313830738421544 | ms |
100th percentile service time | desc_sort_with_after_timestamp | 50.69484293926507 | ms |
error rate | desc_sort_with_after_timestamp | 0.00 | % |
Min Throughput | asc_sort_with_after_timestamp | 0.50 | ops/s |
Mean Throughput | asc_sort_with_after_timestamp | 0.51 | ops/s |
Median Throughput | asc_sort_with_after_timestamp | 0.51 | ops/s |
Max Throughput | asc_sort_with_after_timestamp | 0.55 | ops/s |
50th percentile latency | asc_sort_with_after_timestamp | 40.90008256025612 | ms |
90th percentile latency | asc_sort_with_after_timestamp | 48.37722381344065 | ms |
99th percentile latency | asc_sort_with_after_timestamp | 50.86850221036003 | ms |
100th percentile latency | asc_sort_with_after_timestamp | 52.17323510441929 | ms |
50th percentile service time | asc_sort_with_after_timestamp | 38.328394992277026 | ms |
90th percentile service time | asc_sort_with_after_timestamp | 45.870730734895915 | ms |
99th percentile service time | asc_sort_with_after_timestamp | 48.10314835980535 | ms |
100th percentile service time | asc_sort_with_after_timestamp | 49.01298810727894 | ms |
error rate | asc_sort_with_after_timestamp | 0.00 | % |
Min Throughput | wait-until-merges-1-seg-finish | 168.05 | ops/s |
Mean Throughput | wait-until-merges-1-seg-finish | 168.05 | ops/s |
Median Throughput | wait-until-merges-1-seg-finish | 168.05 | ops/s |
Max Throughput | wait-until-merges-1-seg-finish | 168.05 | ops/s |
100th percentile latency | wait-until-merges-1-seg-finish | 5.6394439889118075 | ms |
100th percentile service time | wait-until-merges-1-seg-finish | 5.6394439889118075 | ms |
error rate | wait-until-merges-1-seg-finish | 0.00 | % |
Min Throughput | desc-sort-timestamp-after-force-merge-1-seg | 2.00 | ops/s |
Mean Throughput | desc-sort-timestamp-after-force-merge-1-seg | 2.00 | ops/s |
Median Throughput | desc-sort-timestamp-after-force-merge-1-seg | 2.00 | ops/s |
Max Throughput | desc-sort-timestamp-after-force-merge-1-seg | 2.01 | ops/s |
50th percentile latency | desc-sort-timestamp-after-force-merge-1-seg | 79.58603493170813 | ms |
90th percentile latency | desc-sort-timestamp-after-force-merge-1-seg | 92.1215433278121 | ms |
99th percentile latency | desc-sort-timestamp-after-force-merge-1-seg | 99.03356183320287 | ms |
100th percentile latency | desc-sort-timestamp-after-force-merge-1-seg | 104.04413589276373 | ms |
50th percentile service time | desc-sort-timestamp-after-force-merge-1-seg | 78.12130748061463 | ms |
90th percentile service time | desc-sort-timestamp-after-force-merge-1-seg | 90.80293622100726 | ms |
99th percentile service time | desc-sort-timestamp-after-force-merge-1-seg | 98.26578442705797 | ms |
100th percentile service time | desc-sort-timestamp-after-force-merge-1-seg | 101.6428149305284 | ms |
error rate | desc-sort-timestamp-after-force-merge-1-seg | 0.00 | % |
Min Throughput | asc-sort-timestamp-after-force-merge-1-seg | 2.01 | ops/s |
Mean Throughput | asc-sort-timestamp-after-force-merge-1-seg | 2.01 | ops/s |
Median Throughput | asc-sort-timestamp-after-force-merge-1-seg | 2.01 | ops/s |
Max Throughput | asc-sort-timestamp-after-force-merge-1-seg | 2.01 | ops/s |
50th percentile latency | asc-sort-timestamp-after-force-merge-1-seg | 13.114754459820688 | ms |
90th percentile latency | asc-sort-timestamp-after-force-merge-1-seg | 18.854280060622845 | ms |
99th percentile latency | asc-sort-timestamp-after-force-merge-1-seg | 19.692866730038077 | ms |
100th percentile latency | asc-sort-timestamp-after-force-merge-1-seg | 19.815898966044188 | ms |
50th percentile service time | asc-sort-timestamp-after-force-merge-1-seg | 11.990199447609484 | ms |
90th percentile service time | asc-sort-timestamp-after-force-merge-1-seg | 17.72854698356241 | ms |
99th percentile service time | asc-sort-timestamp-after-force-merge-1-seg | 18.339456203393638 | ms |
100th percentile service time | asc-sort-timestamp-after-force-merge-1-seg | 18.429666059091687 | ms |
error rate | asc-sort-timestamp-after-force-merge-1-seg | 0.00 | % |
Min Throughput | desc-sort-with-after-timestamp-after-force-merge-1-seg | 0.50 | ops/s |
Mean Throughput | desc-sort-with-after-timestamp-after-force-merge-1-seg | 0.51 | ops/s |
Median Throughput | desc-sort-with-after-timestamp-after-force-merge-1-seg | 0.51 | ops/s |
Max Throughput | desc-sort-with-after-timestamp-after-force-merge-1-seg | 0.55 | ops/s |
50th percentile latency | desc-sort-with-after-timestamp-after-force-merge-1-seg | 41.08424705918878 | ms |
90th percentile latency | desc-sort-with-after-timestamp-after-force-merge-1-seg | 47.353704564739026 | ms |
99th percentile latency | desc-sort-with-after-timestamp-after-force-merge-1-seg | 55.107947689248256 | ms |
100th percentile latency | desc-sort-with-after-timestamp-after-force-merge-1-seg | 56.52152805123478 | ms |
50th percentile service time | desc-sort-with-after-timestamp-after-force-merge-1-seg | 38.61414303537458 | ms |
90th percentile service time | desc-sort-with-after-timestamp-after-force-merge-1-seg | 45.048674393910915 | ms |
99th percentile service time | desc-sort-with-after-timestamp-after-force-merge-1-seg | 52.2978496644646 | ms |
100th percentile service time | desc-sort-with-after-timestamp-after-force-merge-1-seg | 53.7227219901979 | ms |
error rate | desc-sort-with-after-timestamp-after-force-merge-1-seg | 0.00 | % |
Min Throughput | asc-sort-with-after-timestamp-after-force-merge-1-seg | 0.50 | ops/s |
Mean Throughput | asc-sort-with-after-timestamp-after-force-merge-1-seg | 0.51 | ops/s |
Median Throughput | asc-sort-with-after-timestamp-after-force-merge-1-seg | 0.51 | ops/s |
Max Throughput | asc-sort-with-after-timestamp-after-force-merge-1-seg | 0.55 | ops/s |
50th percentile latency | asc-sort-with-after-timestamp-after-force-merge-1-seg | 52.69520456204191 | ms |
90th percentile latency | asc-sort-with-after-timestamp-after-force-merge-1-seg | 61.81727375369519 | ms |
99th percentile latency | asc-sort-with-after-timestamp-after-force-merge-1-seg | 69.19539148919291 | ms |
100th percentile latency | asc-sort-with-after-timestamp-after-force-merge-1-seg | 83.6602309718728 | ms |
50th percentile service time | asc-sort-with-after-timestamp-after-force-merge-1-seg | 50.14868645230308 | ms |
90th percentile service time | asc-sort-with-after-timestamp-after-force-merge-1-seg | 58.972123358398676 | ms |
99th percentile service time | asc-sort-with-after-timestamp-after-force-merge-1-seg | 66.88031297875575 | ms |
100th percentile service time | asc-sort-with-after-timestamp-after-force-merge-1-seg | 81.85732888523489 | ms |
error rate | asc-sort-with-after-timestamp-after-force-merge-1-seg | 0.00 | % |