
本文介绍nyc_taxis测试结果。
配置信息
项目 | 说明 |
实例配置 |
|
分片数 |
|
压测结果
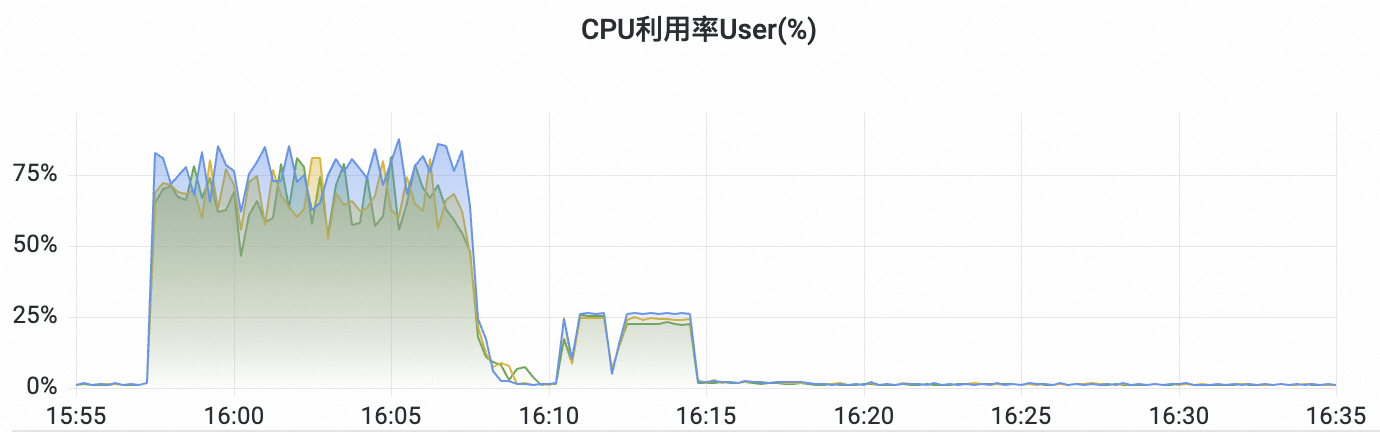
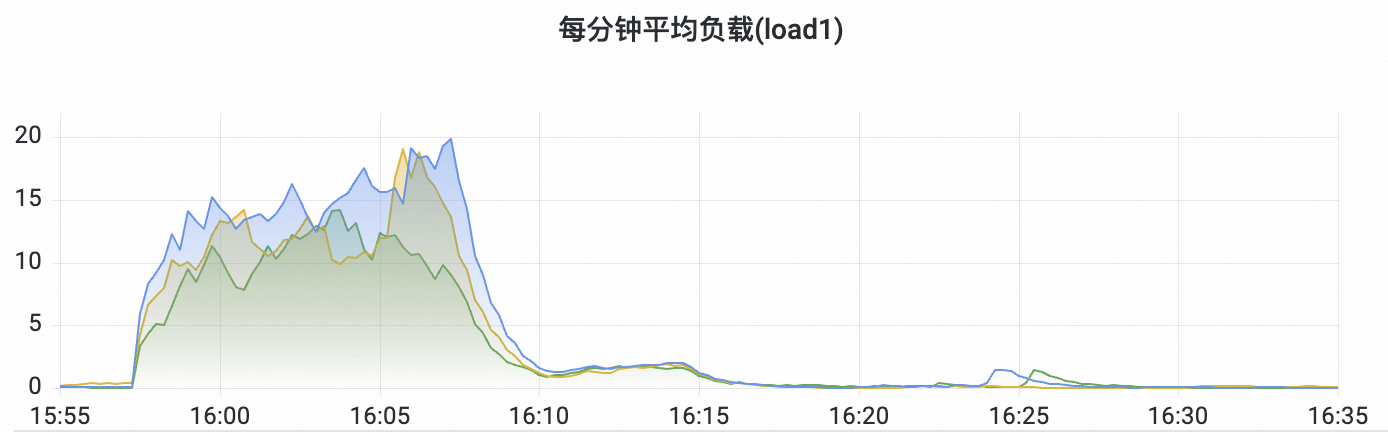
系统资源指标
基准测试报告
Metric | Task | Value | Unit |
Cumulative indexing time of primary shards | 120.89258333333333 | min | |
Min cumulative indexing time across primary shards | 0 | min | |
Median cumulative indexing time across primary shards | 19.158966666666668 | min | |
Max cumulative indexing time across primary shards | 22.97256666666667 | min | |
Cumulative indexing throttle time of primary shards | 0 | min | |
Min cumulative indexing throttle time across primary shards | 0 | min | |
Median cumulative indexing throttle time across primary shards | 0 | min | |
Max cumulative indexing throttle time across primary shards | 0 | min | |
Cumulative merge time of primary shards | 40.24863333333334 | min | |
Cumulative merge count of primary shards | 80 | ||
Min cumulative merge time across primary shards | 0 | min | |
Median cumulative merge time across primary shards | 6.100516666666667 | min | |
Max cumulative merge time across primary shards | 9.321366666666668 | min | |
Cumulative merge throttle time of primary shards | 19.546666666666667 | min | |
Min cumulative merge throttle time across primary shards | 0 | min | |
Median cumulative merge throttle time across primary shards | 2.5521000000000003 | min | |
Max cumulative merge throttle time across primary shards | 6.1625 | min | |
Cumulative refresh time of primary shards | 20.899116666666664 | min | |
Cumulative refresh count of primary shards | 168 | ||
Min cumulative refresh time across primary shards | 0 | min | |
Median cumulative refresh time across primary shards | 3.2376 | min | |
Max cumulative refresh time across primary shards | 4.04325 | min | |
Cumulative flush time of primary shards | 8.57435 | min | |
Cumulative flush count of primary shards | 35 | ||
Min cumulative flush time across primary shards | 0 | min | |
Median cumulative flush time across primary shards | 1.2199 | min | |
Max cumulative flush time across primary shards | 2.1376166666666667 | min | |
Total Young Gen GC time | 59.058 | s | |
Total Young Gen GC count | 1042 | ||
Total Old Gen GC time | 0 | s | |
Total Old Gen GC count | 0 | ||
Store size | 24.061688645742834 | GB | |
Translog size | 3.5855919122695923e-07 | GB | |
Heap used for segments | 0 | MB | |
Heap used for doc values | 0 | MB | |
Heap used for terms | 0 | MB | |
Heap used for norms | 0 | MB | |
Heap used for points | 0 | MB | |
Heap used for stored fields | 0 | MB | |
Segment count | 155 | ||
Min Throughput | index | 265282.45 | docs/s |
Mean Throughput | index | 278931.96 | docs/s |
Median Throughput | index | 279550.74 | docs/s |
Max Throughput | index | 289914.81 | docs/s |
50th percentile latency | index | 274.9252160429023 | ms |
90th percentile latency | index | 410.3077901643702 | ms |
99th percentile latency | index | 779.8319394700236 | ms |
99.9th percentile latency | index | 1451.05195701716 | ms |
100th percentile latency | index | 1889.2036500619724 | ms |
50th percentile service time | index | 274.9252160429023 | ms |
90th percentile service time | index | 410.3077901643702 | ms |
99th percentile service time | index | 779.8319394700236 | ms |
99.9th percentile service time | index | 1451.05195701716 | ms |
100th percentile service time | index | 1889.2036500619724 | ms |
error rate | index | 0.01 | % |
Min Throughput | wait-until-merges-finish | 0.01 | ops/s |
Mean Throughput | wait-until-merges-finish | 0.01 | ops/s |
Median Throughput | wait-until-merges-finish | 0.01 | ops/s |
Max Throughput | wait-until-merges-finish | 0.01 | ops/s |
100th percentile latency | wait-until-merges-finish | 88735.99451303016 | ms |
100th percentile service time | wait-until-merges-finish | 88735.99451303016 | ms |
error rate | wait-until-merges-finish | 0.00 | % |
Min Throughput | default | 3.02 | ops/s |
Mean Throughput | default | 3.03 | ops/s |
Median Throughput | default | 3.03 | ops/s |
Max Throughput | default | 3.06 | ops/s |
50th percentile latency | default | 4.110544919967651 | ms |
90th percentile latency | default | 4.550682823173702 | ms |
99th percentile latency | default | 4.911339302780115 | ms |
100th percentile latency | default | 6.466208607889712 | ms |
50th percentile service time | default | 2.9984465218149126 | ms |
90th percentile service time | default | 3.158695006277412 | ms |
99th percentile service time | default | 3.5007848078385018 | ms |
100th percentile service time | default | 3.9039970142766833 | ms |
error rate | default | 0.00 | % |
Min Throughput | range | 10.38 | ops/s |
Mean Throughput | range | 12.20 | ops/s |
Median Throughput | range | 11.96 | ops/s |
Max Throughput | range | 14.38 | ops/s |
50th percentile latency | range | 7388.169783516787 | ms |
90th percentile latency | range | 9101.095886761323 | ms |
99th percentile latency | range | 9450.589573987527 | ms |
100th percentile latency | range | 9488.78713499289 | ms |
50th percentile service time | range | 43.534678989090025 | ms |
90th percentile service time | range | 66.22437349287793 | ms |
99th percentile service time | range | 94.52101155882714 | ms |
100th percentile service time | range | 119.36185497324914 | ms |
error rate | range | 0.00 | % |
Min Throughput | simple_keyword_range | 271.10 | ops/s |
Mean Throughput | simple_keyword_range | 271.10 | ops/s |
Median Throughput | simple_keyword_range | 271.10 | ops/s |
Max Throughput | simple_keyword_range | 271.10 | ops/s |
50th percentile latency | simple_keyword_range | 160.20158305764198 | ms |
90th percentile latency | simple_keyword_range | 221.36549613205716 | ms |
99th percentile latency | simple_keyword_range | 232.3506000544876 | ms |
100th percentile latency | simple_keyword_range | 233.4632680285722 | ms |
50th percentile service time | simple_keyword_range | 3.1396379927173257 | ms |
90th percentile service time | simple_keyword_range | 3.409258532337845 | ms |
99th percentile service time | simple_keyword_range | 3.7918976217043108 | ms |
100th percentile service time | simple_keyword_range | 12.595133972354233 | ms |
error rate | simple_keyword_range | 0.00 | % |
Min Throughput | nested_keyword_range | 2.12 | ops/s |
Mean Throughput | nested_keyword_range | 2.13 | ops/s |
Median Throughput | nested_keyword_range | 2.13 | ops/s |
Max Throughput | nested_keyword_range | 2.13 | ops/s |
50th percentile latency | nested_keyword_range | 46890.45416604495 | ms |
90th percentile latency | nested_keyword_range | 65298.98733377923 | ms |
99th percentile latency | nested_keyword_range | 69518.8213843084 | ms |
100th percentile latency | nested_keyword_range | 69977.0413270453 | ms |
50th percentile service time | nested_keyword_range | 463.06185802677646 | ms |
90th percentile service time | nested_keyword_range | 483.95256634103134 | ms |
99th percentile service time | nested_keyword_range | 518.3660491439515 | ms |
100th percentile service time | nested_keyword_range | 530.2275479771197 | ms |
error rate | nested_keyword_range | 0.00 | % |
Min Throughput | date_histogram_fixed_interval | 84.61 | ops/s |
Mean Throughput | date_histogram_fixed_interval | 84.61 | ops/s |
Median Throughput | date_histogram_fixed_interval | 84.61 | ops/s |
Max Throughput | date_histogram_fixed_interval | 84.61 | ops/s |
50th percentile latency | date_histogram_fixed_interval | 845.1072525931522 | ms |
90th percentile latency | date_histogram_fixed_interval | 1119.2103361478075 | ms |
99th percentile latency | date_histogram_fixed_interval | 1162.7690079377498 | ms |
100th percentile latency | date_histogram_fixed_interval | 1169.8024501092732 | ms |
50th percentile service time | date_histogram_fixed_interval | 6.816218490712345 | ms |
90th percentile service time | date_histogram_fixed_interval | 9.091131354216486 | ms |
99th percentile service time | date_histogram_fixed_interval | 52.602869507391034 | ms |
100th percentile service time | date_histogram_fixed_interval | 57.545293937437236 | ms |
error rate | date_histogram_fixed_interval | 0.00 | % |
Min Throughput | date_histogram_calendar_interval | 64.96 | ops/s |
Mean Throughput | date_histogram_calendar_interval | 64.96 | ops/s |
Median Throughput | date_histogram_calendar_interval | 64.96 | ops/s |
Max Throughput | date_histogram_calendar_interval | 64.96 | ops/s |
50th percentile latency | date_histogram_calendar_interval | 1142.3773280112073 | ms |
90th percentile latency | date_histogram_calendar_interval | 1511.9556333054788 | ms |
99th percentile latency | date_histogram_calendar_interval | 1586.5284818527289 | ms |
100th percentile latency | date_histogram_calendar_interval | 1594.4983590161428 | ms |
50th percentile service time | date_histogram_calendar_interval | 9.167851007077843 | ms |
90th percentile service time | date_histogram_calendar_interval | 13.121740473434329 | ms |
99th percentile service time | date_histogram_calendar_interval | 54.01757572195497 | ms |
100th percentile service time | date_histogram_calendar_interval | 61.796467984095216 | ms |
error rate | date_histogram_calendar_interval | 0.00 | % |
Min Throughput | distance_amount_agg | 0.69 | ops/s |
Mean Throughput | distance_amount_agg | 0.69 | ops/s |
Median Throughput | distance_amount_agg | 0.69 | ops/s |
Max Throughput | distance_amount_agg | 0.69 | ops/s |
50th percentile latency | distance_amount_agg | 72101.60419048043 | ms |
90th percentile latency | distance_amount_agg | 90813.71640962316 | ms |
100th percentile latency | distance_amount_agg | 95403.41441496275 | ms |
50th percentile service time | distance_amount_agg | 1437.5905300257728 | ms |
90th percentile service time | distance_amount_agg | 1484.1330729657784 | ms |
100th percentile service time | distance_amount_agg | 1538.2837769575417 | ms |
error rate | distance_amount_agg | 0.00 | % |
Min Throughput | autohisto_agg | 1.51 | ops/s |
Mean Throughput | autohisto_agg | 1.51 | ops/s |
Median Throughput | autohisto_agg | 1.51 | ops/s |
Max Throughput | autohisto_agg | 1.52 | ops/s |
50th percentile latency | autohisto_agg | 22.022984456270933 | ms |
90th percentile latency | autohisto_agg | 31.503943470306695 | ms |
99th percentile latency | autohisto_agg | 77.94265176169574 | ms |
100th percentile latency | autohisto_agg | 79.20147757977247 | ms |
50th percentile service time | autohisto_agg | 20.59652894968167 | ms |
90th percentile service time | autohisto_agg | 30.1520986831747 | ms |
99th percentile service time | autohisto_agg | 76.62434825440869 | ms |
100th percentile service time | autohisto_agg | 77.724555041641 | ms |
error rate | autohisto_agg | 0.00 | % |
Min Throughput | date_histogram_agg | 1.51 | ops/s |
Mean Throughput | date_histogram_agg | 1.52 | ops/s |
Median Throughput | date_histogram_agg | 1.51 | ops/s |
Max Throughput | date_histogram_agg | 1.53 | ops/s |
50th percentile latency | date_histogram_agg | 22.00095949228853 | ms |
90th percentile latency | date_histogram_agg | 31.55413924250752 | ms |
99th percentile latency | date_histogram_agg | 42.689885459840426 | ms |
100th percentile latency | date_histogram_agg | 67.8213459905237 | ms |
50th percentile service time | date_histogram_agg | 20.49802750116214 | ms |
90th percentile service time | date_histogram_agg | 30.125503591261804 | ms |
99th percentile service time | date_histogram_agg | 40.66798856016262 | ms |
100th percentile service time | date_histogram_agg | 66.596640041098 | ms |
error rate | date_histogram_agg | 0.00 | % |
Min Throughput | desc_sort_tip_amount | 0.50 | ops/s |
Mean Throughput | desc_sort_tip_amount | 0.51 | ops/s |
Median Throughput | desc_sort_tip_amount | 0.50 | ops/s |
Max Throughput | desc_sort_tip_amount | 0.51 | ops/s |
50th percentile latency | desc_sort_tip_amount | 10.260522074531764 | ms |
90th percentile latency | desc_sort_tip_amount | 11.551995284389706 | ms |
99th percentile latency | desc_sort_tip_amount | 13.638862329535234 | ms |
100th percentile latency | desc_sort_tip_amount | 22.94063800945878 | ms |
50th percentile service time | desc_sort_tip_amount | 7.738117012195289 | ms |
90th percentile service time | desc_sort_tip_amount | 8.866730611771345 | ms |
99th percentile service time | desc_sort_tip_amount | 10.279342669528035 | ms |
100th percentile service time | desc_sort_tip_amount | 21.314551937393844 | ms |
error rate | desc_sort_tip_amount | 0.00 | % |
Min Throughput | asc_sort_tip_amount | 0.50 | ops/s |
Mean Throughput | asc_sort_tip_amount | 0.51 | ops/s |
Median Throughput | asc_sort_tip_amount | 0.50 | ops/s |
Max Throughput | asc_sort_tip_amount | 0.51 | ops/s |
50th percentile latency | asc_sort_tip_amount | 6.194674992002547 | ms |
90th percentile latency | asc_sort_tip_amount | 6.795230880379677 | ms |
99th percentile latency | asc_sort_tip_amount | 7.099999329075217 | ms |
100th percentile latency | asc_sort_tip_amount | 7.132313912734389 | ms |
50th percentile service time | asc_sort_tip_amount | 3.6282854853197932 | ms |
90th percentile service time | asc_sort_tip_amount | 3.876287618186325 | ms |
99th percentile service time | asc_sort_tip_amount | 3.972453564638273 | ms |
100th percentile service time | asc_sort_tip_amount | 4.158333991654217 | ms |
error rate | asc_sort_tip_amount | 0.00 | % |