本文为您介绍如何创建和操作DataFrame对象,以及使用DataFrame完成基本的数据处理。
数据准备
本文将以u.user、u.item和u.data数据进行举例。其中u.user是用户相关的数据,u.item是电影相关的数据,u.data是评分相关的数据。
创建表:
pyodps_ml_100k_users(用户相关的数据)。CREATE TABLE IF NOT EXISTS pyodps_ml_100k_users ( user_id BIGINT COMMENT '用户id', age BIGINT COMMENT '年龄', sex STRING COMMENT '性别', occupation STRING COMMENT '职业', zip_code STRING COMMENT '邮编' );pyodps_ml_100k_movies(电影相关的数据)。CREATE TABLE IF NOT EXISTS pyodps_ml_100k_movies ( movie_id BIGINT COMMENT '电影 ID', title STRING COMMENT '电影标题', release_date STRING COMMENT '上映日期', video_release_date STRING COMMENT '视频发布日期', IMDb_URL STRING COMMENT 'IMDb 链接', unknown TINYINT COMMENT '未知', Action TINYINT COMMENT '动作', Adventure TINYINT COMMENT '冒险', Animation TINYINT COMMENT '动画', Children TINYINT COMMENT '儿童', Comedy TINYINT COMMENT '喜剧', Crime TINYINT COMMENT '犯罪', Documentary TINYINT COMMENT '纪录片', Drama TINYINT COMMENT '戏剧', Fantasy TINYINT COMMENT '奇幻', FilmNoir TINYINT COMMENT '黑色电影', Horror TINYINT COMMENT '恐怖', Musical TINYINT COMMENT '音乐', Mystery TINYINT COMMENT '悬疑', Romance TINYINT COMMENT '浪漫', SciFi TINYINT COMMENT '科幻', Thriller TINYINT COMMENT '惊悚', War TINYINT COMMENT '战争', Western TINYINT COMMENT '西部' );pyodps_ml_100k_ratings(评分相关的数据)。CREATE TABLE IF NOT EXISTS pyodps_ml_100k_ratings ( user_id BIGINT COMMENT '用户id', movie_id BIGINT COMMENT '电影id', rating BIGINT COMMENT '得分', timestamp BIGINT COMMENT '时间戳' )
基于Tunnel Upload 将本地数据文件内容导入MaxCompute的表中。更多Tunnel操作,请参见Tunnel命令。
Tunnel upload -fd | path_to_file/u.user pyodps_ml_100k_users;
Tunnel upload -fd | path_to_file/u.item pyodps_ml_100k_movies;
Tunnel upload -fd | path_to_file/u.data pyodps_ml_100k_ratings;
DataFrame对象操作
现在已经有了三张表,分别是pyodps_ml_100k_movies(电影相关的数据)、pyodps_ml_100k_users(用户相关的数据)、pyodps_ml_100k_ratings(评分相关的数据)。以下示例使用IPython运行。
确保已经安装了Python。IPython是基于Python的,所以需要先安装Python环境。接着通过pip install IPython 安装IPython。安装完成后,可以通过执行IPython命令来启动IPython的交互式环境,开始编写和执行Python代码。
创建ODPS对象。
import os from odps import ODPS # 确保 ALIBABA_CLOUD_ACCESS_KEY_ID 环境变量设置为用户 Access Key ID, # ALIBABA_CLOUD_ACCESS_KEY_SECRET 环境变量设置为用户 Access Key Secret, # 不建议直接使用 Access Key ID / Access Key Secret 字符串 o = ODPS( os.getenv('ALIBABA_CLOUD_ACCESS_KEY_ID'), os.getenv('ALIBABA_CLOUD_ACCESS_KEY_SECRET'), project='your-default-project', endpoint='your-end-point', )通过传入Table对象创建一个DataFrame对象。
from odps.df import DataFrame
users = DataFrame(o.get_table('pyodps_ml_100k_users'));
您可以通过
dtypes属性查看这个DataFrame的字段及字段类型。print(users.dtypes)返回值
odps.Schema {
  user_id             int64
  age                 int64
  sex                 string
  occupation          string
  zip_code            string
}
通过
head方法,您可以获取前N条数据并进行快速预览。print(users.head(10))返回值
   user_id  age  sex     occupation  zip_code
0        1   24    M     technician     85711
1        2   53    F          other     94043
2        3   23    M         writer     32067
3        4   24    M     technician     43537
4        5   33    F          other     15213
5        6   42    M      executive     98101
6        7   57    M  administrator     91344
7        8   36    M  administrator     05201
8        9   29    M        student     01002
9       10   53    M         lawyer     90703
如果您不需要看到所有字段,则可以进行如下操作:
从中筛选出一部分字段。
print(users[['user_id', 'age']].head(5))返回值
   user_id  age
0        1   24
1        2   53
2        3   23
3        4   24
4        5   33
只做排除个别字段操作。
print(users.exclude('zip_code', 'age').head(5))返回值
   user_id  sex  occupation
0        1    M  technician
1        2    F       other
2        3    M      writer
3        4    M  technician
4        5    F       other
排除掉一些字段,通过计算得到一些新的列。例如将
sex为M的置为True,否则为False,并取名为sex_bool。print(users.select(users.exclude('zip_code', 'sex'), sex_bool=users.sex == 'M').head(5))返回值
   user_id  age  occupation  sex_bool
0        1   24  technician      True
1        2   53       other     False
2        3   23      writer      True
3        4   24  technician      True
4        5   33       other     False
查看男用户和女用户的个数。
print(users.groupby(users.sex).agg(count=users.count()))返回值
sex count 0 F 273 1 M 670将用户按职业划分,从高到低进行排序,查看人数最多的前10职业。
df = users.groupby('occupation').agg(count=users['occupation'].count())
df1 = df.sort(df['count'], ascending=False)
print(df1.head(10))
返回值
      occupation  count
0        student    196
1          other    105
2       educator     95
3  administrator     79
4       engineer     67
5     programmer     66
6      librarian     51
7         writer     45
8      executive     32
9      scientist     31
或者通过
value_counts方法快速实现。该方法返回的行数受到options.df.odps.sort.limit的限制,详情请参见配置选项。df = users.occupation.value_counts()[:10] print(df.head(10))返回值
      occupation  count
0        student    196
1          other    105
2       educator     95
3  administrator     79
4       engineer     67
5     programmer     66
6      librarian     51
7         writer     45
8      executive     32
9      scientist     31
使用
join将这三张表联合起来,然后保存为一张新的表pyodps_ml_100k_lens。movies = DataFrame(o.get_table('pyodps_ml_100k_movies')) ratings = DataFrame(o.get_table('pyodps_ml_100k_ratings')) o.delete_table('pyodps_ml_100k_lens', if_exists=True) lens = movies.join(ratings).join(users).persist('pyodps_ml_100k_lens') print(lens.dtypes)返回值
odps.Schema {
  movie_id                          int64
  title                             string
  release_date                      string
  ideo_release_date                 string
  imdb_url                          string
  unknown                           int64
  action                            int64
  adventure                         int64
  animation                         int64
  children                          int64
  comedy                            int64
  crime                             int64
  documentary                       int64
  drama                             int64
  fantasy                           int64
  filmnoir                          int64
  horror                            int64
  musical                           int64
  mystery                           int64
  romance                           int64
  scifi                             int64
  thriller                          int64
  war                               int64
  western                           int64
  user_id                           int64
  rating                            int64
  timestamp                         int64
  age                               int64
  sex                               string
  occupation                        string
  zip_code                          string
}
Dataframe数据处理
请您首先下载鸢尾花数据集。本文使用DataWorks PyODPS节点功能,详情请参见开发PyODPS 3任务。
创建测试数据表 。
使用DataWorks表管理功能新建表:
选择编辑页面左上角DDL
 。
。输入建表语句如下,完成后提交表。
CREATE TABLE pyodps_iris (
    sepallength double COMMENT '片长度(cm)',
    sepalwidth double COMMENT '片宽度(cm)',
    petallength double COMMENT '瓣长度(cm)',
    petalwidth double COMMENT '瓣宽度(cm)',
    name string COMMENT '种类'
) ;
上传测试数据 。
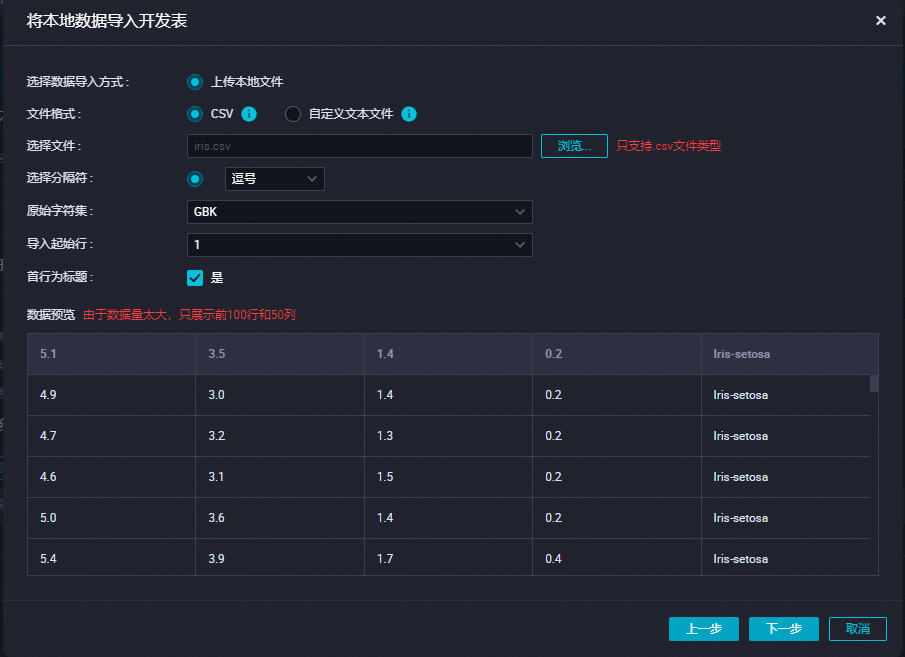
在新建表上单击右键,选择导入数据,单击下一步,上传您刚下载的数据集。

单击按位置匹配后导入数据。
打开相应的业务流程,右键单击MaxCompute,选择新建节点,选择PyODPS 3,新建一个PyODPS节点,用于存放和运行代码。
输入代码后,单击运行
 ,运行后可在下方运行日志处查看结果。代码详情如下。
from odps import ODPS
from odps.df import DataFrame, output
import os

# 确保 ALIBABA_CLOUD_ACCESS_KEY_ID 环境变量设置为用户 Access Key ID,
# ALIBABA_CLOUD_ACCESS_KEY_SECRET 环境变量设置为用户 Access Key Secret,
# 不建议直接使用 Access Key ID / Access Key Secret 字符串
o = ODPS(
    os.getenv('ALIBABA_CLOUD_ACCESS_KEY_ID'),
    os.getenv('ALIBABA_CLOUD_ACCESS_KEY_SECRET'),
    project='your-default-project',
    endpoint='your-end-point',
)
# 从ODPS表创建DataFrame对象iris。
iris = DataFrame(o.get_table('pyodps_iris'))
print(iris.head(10))
# 打印iris部分内容。
print(iris.sepallength.head(5))

# 使用自定义函数求iris的两列之和。
print(iris.apply(lambda row: row.sepallength + row.sepalwidth, axis=1, reduce=True, types='float').rename('sepaladd').head(3))

# 指定函数的输出名称和类型。
@output(['iris_add', 'iris_sub'], ['float', 'float'])
def handle(row):
    # 使用yield关键字可返回多行结果。
    yield row.sepallength - row.sepalwidth, row.sepallength + row.sepalwidth
    yield row.petallength - row.petalwidth, row.petallength + row.petalwidth

# 打印前5行结果,axis=1表示列的轴沿着水平的方向。
  print(iris.apply(handle, axis=1).head(5))
运行结果:
# print(iris.head(10))
   sepallength  sepalwidth  petallength  petalwidth         name
0          4.9         3.0          1.4         0.2  Iris-setosa
1          4.7         3.2          1.3         0.2  Iris-setosa
2          4.6         3.1          1.5         0.2  Iris-setosa
3          5.0         3.6          1.4         0.2  Iris-setosa
4          5.4         3.9          1.7         0.4  Iris-setosa
5          4.6         3.4          1.4         0.3  Iris-setosa
6          5.0         3.4          1.5         0.2  Iris-setosa
7          4.4         2.9          1.4         0.2  Iris-setosa
8          4.9         3.1          1.5         0.1  Iris-setosa
9          5.4         3.7          1.5         0.2  Iris-setosa


# print(iris.sepallength.head(5))
   sepallength
0          4.9
1          4.7
2          4.6
3          5.0
4          5.4

# print(iris.apply(lambda row: row.sepallength + row.sepalwidth, axis=1, reduce=True, types='float').rename('sepaladd').head(3))
   sepaladd
0       7.9
1       7.9
2       7.7

# print(iris.apply(handle,axis=1).head(5))
   iris_add  iris_sub
0       1.9       7.9
1       1.2       1.6
2       1.5       7.9
3       1.1       1.5
4       1.5       7.7
