本文详细介绍了PolarDB-X列存索引的TPC-H测试设计、测试过程和测试结果。
背景信息
TPC-H是业界常用的一套Benchmark,由TPC委员会制定发布,用于评测数据库的分析型查询能力。TPC-H查询包含8张数据表、22条复杂的SQL查询,大多数查询包含若干表Join、子查询和Group-by聚合等。
本文的TPC-H的实现基于TPC-H的基准测试,并不能与已发布的TPC-H基准测试结果相比较,本文中的测试并不符合TPC-H基准测试的所有要求。
测试设计
测试数据量
测试基于100 GB数据量(Scalar Factor=100),其中主要表数据量如下:
LINEITEM约6亿行
ORDERS 1.5亿行
PART_SUPP 8000万行
测试所用实例规格
节点规格 | 节点数 | 数据集大小 |
8c32g | 2/4 | 100 GB |
16c64g | 2/3/4/6 | 100 GB |
测试所用压力机规格
ecs.g7.4xlarge(16 vCPU,64 GB内存)
测试方法
步骤1:准备压力机ECS
需准备一个ECS,后续操作步骤中涉及的数据导入、运行压测等使用的都是这台ECS机器。
请将测试所用的ECS部署在VPC网络内,并记住该VPC的名称和ID,后续的所有实例都将部署在该VPC内。
建议ECS的操作系统为CentOS,并开放公网IP。
步骤2:准备压测所用PolarDB-X实例
创建PolarDB-X实例,具体步骤请参见创建实例。
需保证PolarDB-X实例和压力机ECS在同一个VPC中。
为PolarDB-X实例的白名单添加压力机ECS的内网地址。
步骤3:调整实例参数
为了在压测场景下达到最佳性能,需要调整PolarDB-X计算层实例参数。
修改参数XPROTO_MAX_DN_CONCURRENT的值为4000,具体步骤请参见参数设置。
通过命令行连接到PolarDB-X实例,在同一会话内执行如下SQL语句,关闭日志记录、CPU采样统计与统计信息自动采集。
set global RECORD_SQL = false;
set global MPP_METRIC_LEVEL = 0;
set global ENABLE_CPU_PROFILE = false;
set global ENABLE_BACKGROUND_STATISTIC_COLLECTION=false;
set global ENABLE_STATISTIC_FEEDBACK=false;
步骤4:安装BenchmarkBoot压测工具
为压力机ECS安全组开放4121端口,具体步骤请参见添加安全组规则。
登录压力机ECS,执行
bash -c "$(curl -fsSL https://benchmark-boot.oss-cn-hangzhou.aliyuncs.com/setup.sh)"安装BenchmarkBoot压测工具,具体步骤请参见BenchmarkBoot下载安装。在浏览器上打开http://{压力机公网IP}:4121,出现BenchmarkBoot首页代表安装成功。
步骤5:数据准备
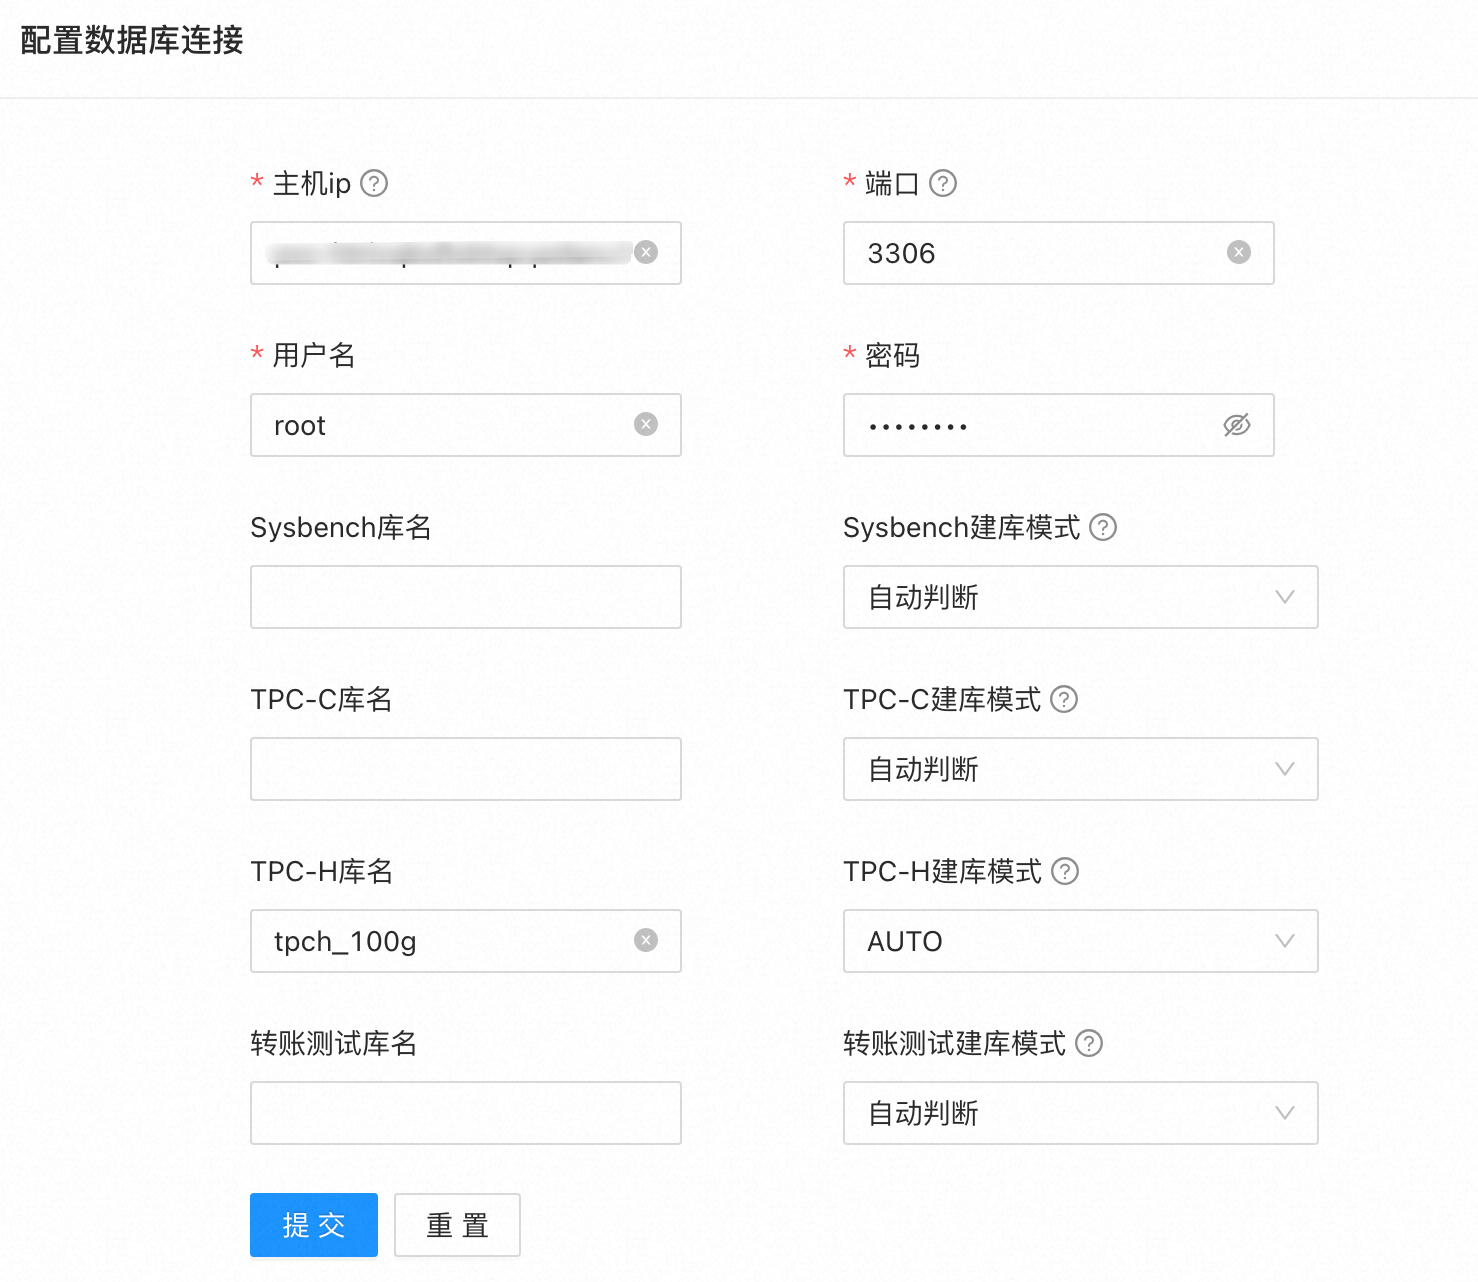
在BenchmarkBoot的界面中,配置PolarDB-X连接串(主机ip、端口、用户名、密码),输入TPC-H库名、建库模式选择AUTO,单击提交。
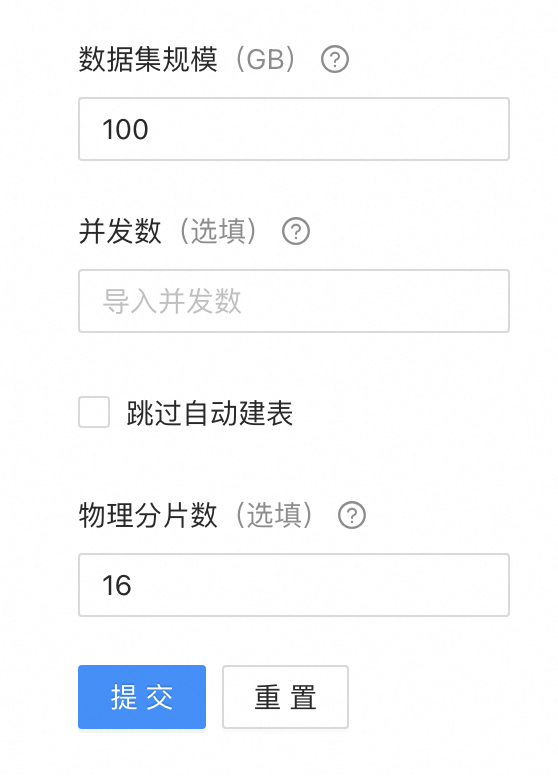
在BenchmarkBoot的界面中,输入数据集规模(GB)为100,物理分片数为16,单击提交,导入TPC-H 100 GB数据到PolarDB-X主实例。
 说明
说明在数据导入完成后,BenchmarkBoot会自动执行analyze table收集统计信息。
确认上一步的TPC-H 100 GB数据集导入完成后,在PolarDB-X主实例上执行以下SQL创建列存索引,具体步骤请参见创建和使用CCI。
create clustered columnar index `nation_col_index` on nation(`n_nationkey`) partition by hash(`n_nationkey`) partitions 1; create clustered columnar index `region_col_index` on region(`r_regionkey`) partition by hash(`r_regionkey`) partitions 1; create clustered columnar index `customer_col_index` on customer(`c_custkey`) partition by hash(`c_custkey`) partitions 64; create clustered columnar index `part_col_index` on part(`p_size`) partition by hash(`p_partkey`) partitions 64; create clustered columnar index `partsupp_col_index` on partsupp(`ps_partkey`) partition by hash(`ps_partkey`) partitions 64; create clustered columnar index `supplier_col_index` on supplier(`s_suppkey`) partition by hash(`s_suppkey`) partitions 64; create clustered columnar index `orders_col_index` on orders(`o_orderdate`,`o_orderkey`) partition by hash(`o_orderkey`) partitions 64; create clustered columnar index `lineitem_col_index` on lineitem(`l_shipdate`,`l_orderkey`) partition by hash(`l_orderkey`) partitions 64;说明可以执行
show columnar index查看当前的列存索引状态,具体步骤请参见SHOW COLUMNAR INDEX。创建列存索引总耗时约为45分钟。
步骤6:添加列存只读实例
为PolarDB-X主实例添加列存只读实例,具体步骤请参见添加列存只读实例。
为PolarDB-X列存只读实例的白名单添加压力机ECS的内网地址。
步骤7:进行TPC-H测试
在BenchmarkBoot的界面中,配置列存只读实例连接串,输入TPC-H库名、建库模式选择自动判断,单击提交。
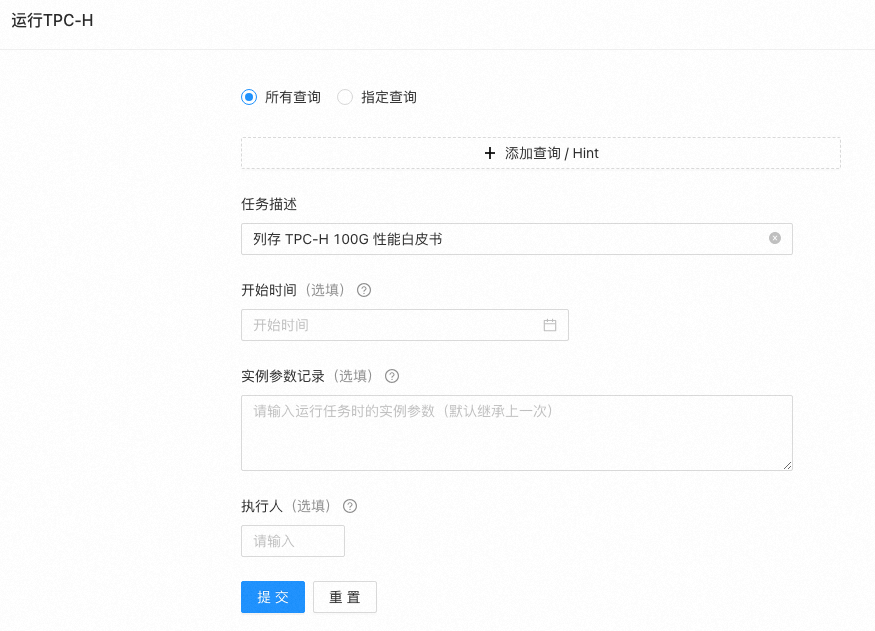
在BenchmarkBoot的界面中,选择所有查询、输入任务描述,单击提交,运行TPC-H测试的22条查询语句。
在BenchmarkBoot的界面中,查看最终压测结果。
说明第一次运行TPC-H需要预热,建议运行多轮后,得到最终稳定的压测结果。
测试结果
以下结果的时间单位为:秒(s)
查询 | 8c32g * 2 | 8c32g * 4 | 16c64g * 2 | 16c64g * 3 | 16c64g * 4 | 16c64g * 6 |
Q1 | 5.9 | 3.99 | 4.37 | 1.6 | 1.22 | 0.86 |
Q2 | 2.41 | 1.68 | 1.63 | 1.15 | 1.04 | 0.86 |
Q3 | 4.18 | 2.13 | 2.43 | 1.77 | 1.20 | 0.88 |
Q4 | 3.72 | 1.02 | 0.94 | 0.78 | 0.48 | 0.44 |
Q5 | 5.63 | 3.12 | 3.27 | 2.05 | 1.68 | 1.4 |
Q6 | 0.41 | 0.38 | 0.42 | 0.18 | 0.15 | 0.13 |
Q7 | 5.47 | 2.94 | 2.93 | 2.08 | 1.72 | 1.34 |
Q8 | 3.61 | 2.31 | 1.98 | 1.81 | 1.68 | 1.51 |
Q9 | 13.6 | 6.91 | 7.46 | 4.93 | 3.85 | 3.11 |
Q10 | 6.36 | 3.12 | 3.5 | 2.31 | 1.73 | 1.26 |
Q11 | 1.51 | 0.64 | 0.74 | 0.53 | 0.49 | 0.35 |
Q12 | 1.86 | 0.82 | 0.78 | 0.57 | 0.40 | 0.35 |
Q13 | 8.85 | 4.29 | 4.44 | 2.6 | 1.64 | 1.2 |
Q14 | 0.94 | 0.58 | 0.7 | 0.51 | 0.38 | 0.31 |
Q15 | 1.26 | 0.76 | 0.88 | 0.59 | 0.47 | 0.37 |
Q16 | 2.3 | 1 | 1.19 | 0.75 | 0.61 | 0.46 |
Q17 | 1.86 | 0.75 | 0.69 | 0.47 | 0.43 | 0.49 |
Q18 | 8.43 | 4.18 | 4.43 | 3.16 | 2.19 | 1.6 |
Q19 | 4.92 | 2.16 | 1.86 | 1.07 | 1.02 | 0.73 |
Q20 | 1.88 | 1.34 | 1.17 | 0.73 | 0.78 | 0.73 |
Q21 | 12.05 | 3.18 | 3.11 | 2.38 | 1.72 | 1.57 |
Q22 | 2.67 | 1.25 | 1.39 | 0.98 | 0.66 | 0.61 |
总时间 | 99.82 | 48.55 | 50.31 | 33.00 | 25.54 | 20.56 |