在微服务架构中,OpenTelemetry提供了一个强大的跟踪框架,能够捕捉到在分布式系统中服务之间传递的请求跟踪数据,这些数据对于理解请求流程和服务间的依赖关系至关重要。但是如果需要涉及到深入分析单个微服务的内部性能,例如当服务响应速度变慢或者出现超时,跟踪数据可能无法完全揭示问题的原因。在这种情况下,我们需要更细致的性能分析数据(Profiling数据)帮助我们定位问题根因。
工作原理
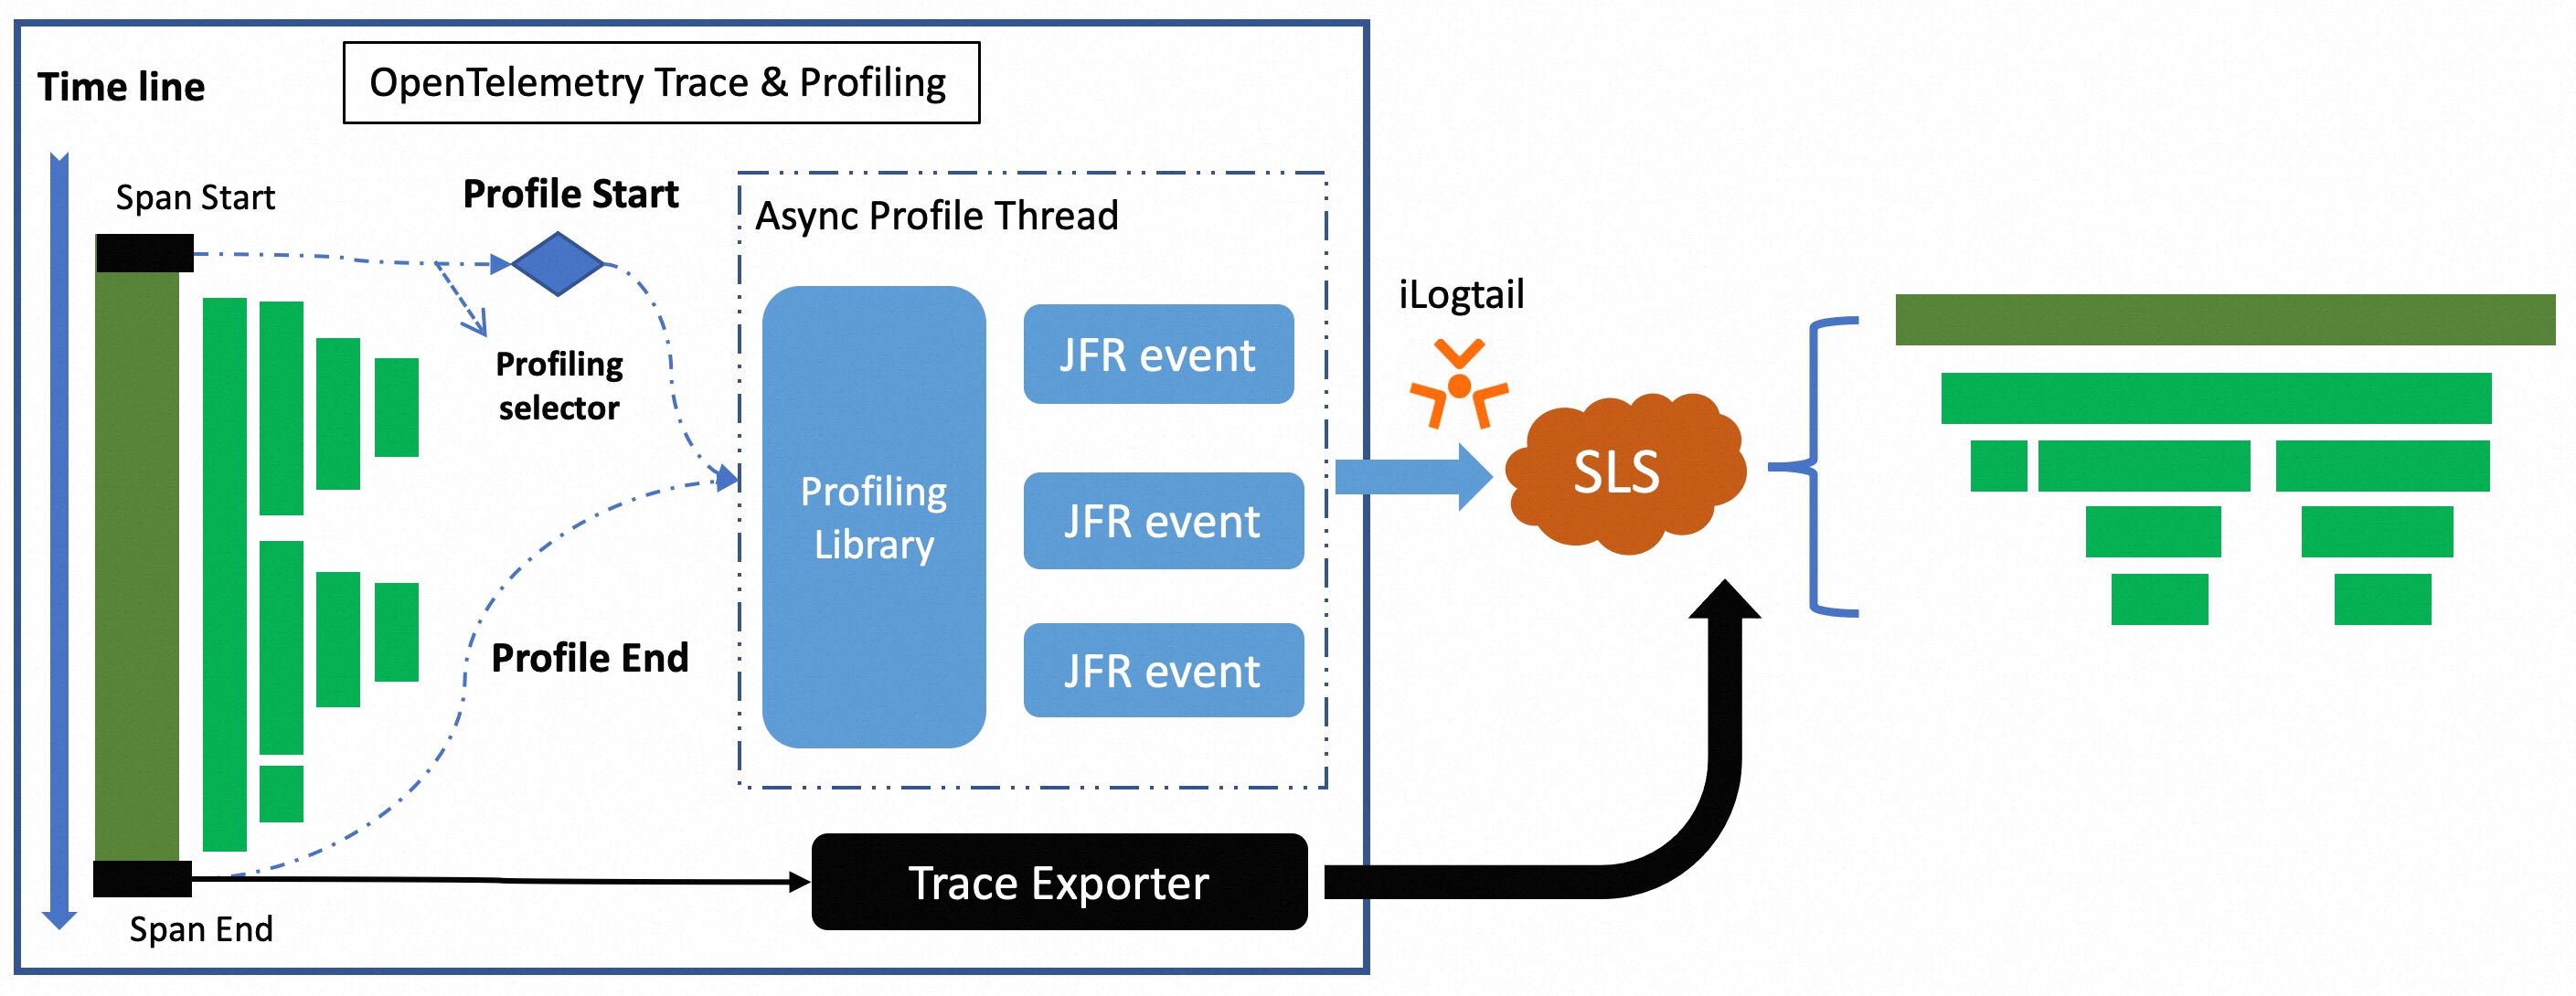
根据Profiling配置确定需要分析的Trace数据。当相应的Trace被捕获时,扩展包会触发Java Flight Recorder (JFR)的Profiling任务,收集方法执行时间、内存消耗、CPU使用等运行时信息。
采集到的Profiling数据通过ilogtail发送到日志服务,在日志服务可以通过Trace ID将Profiling数据与Trace数据相关联,帮助开发者找到应用中的性能热点。
应用场景
以下两个场景出现问题无法定位,Profiling数据可以找到这些盲点,从而更好地理解应用程序的性能瓶颈。
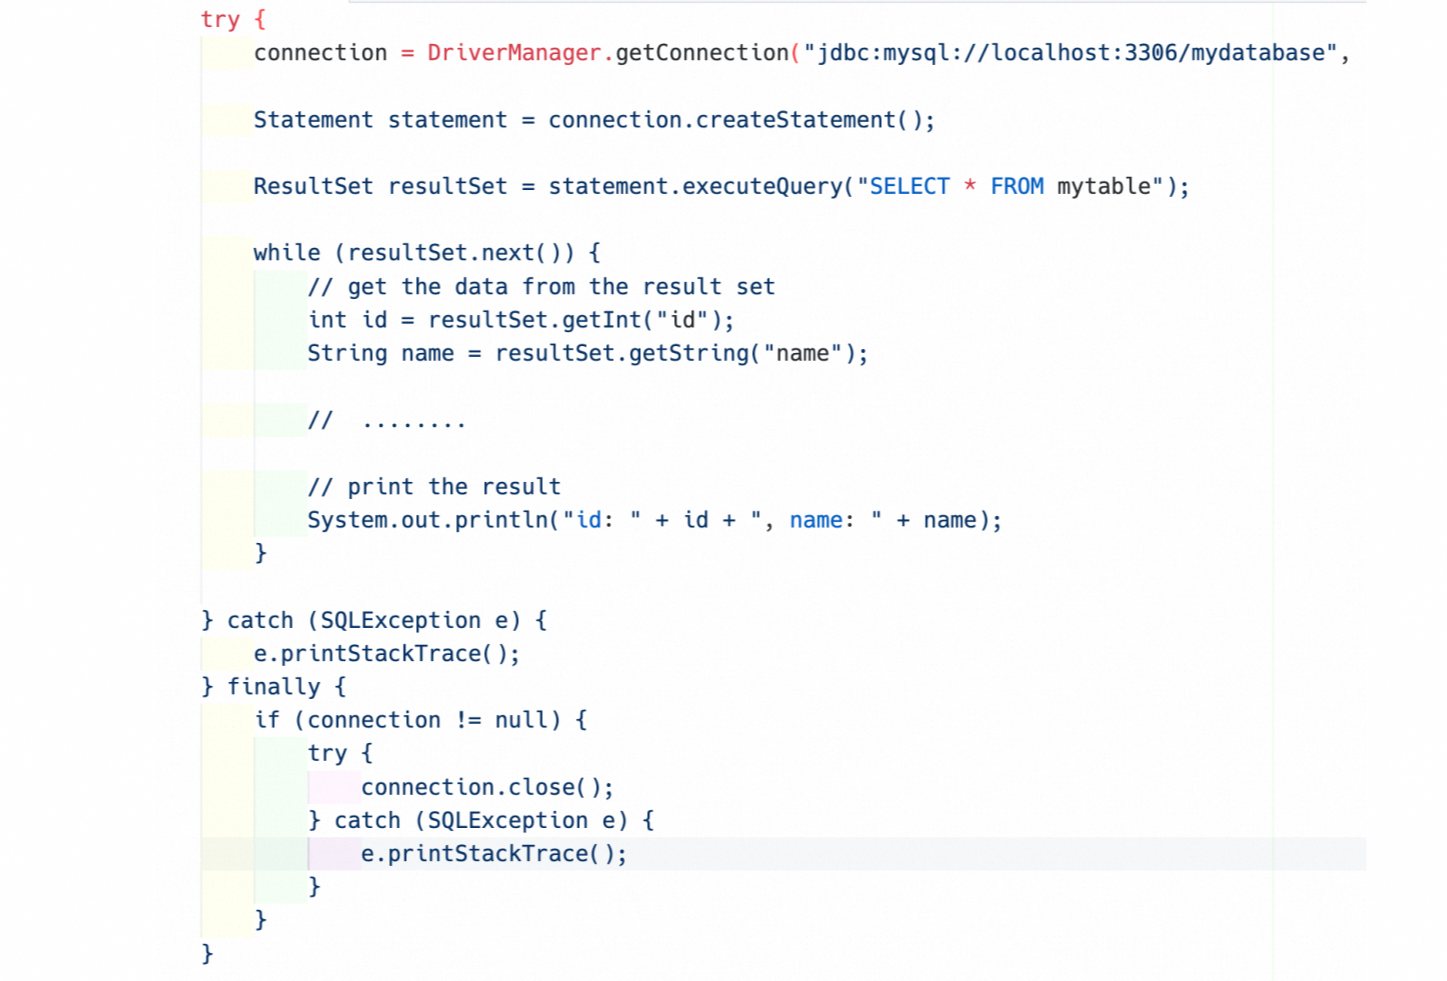
内存申请过多,导致频繁GC
应用程序使用JDBC进行数据库操作,而在执行数据查询时,没有对返回的数据量进行限制。如图所示,如果表数据量过大,那么会造成大量内存申请从而导致频繁的GC,最终影响应用程序的性能。
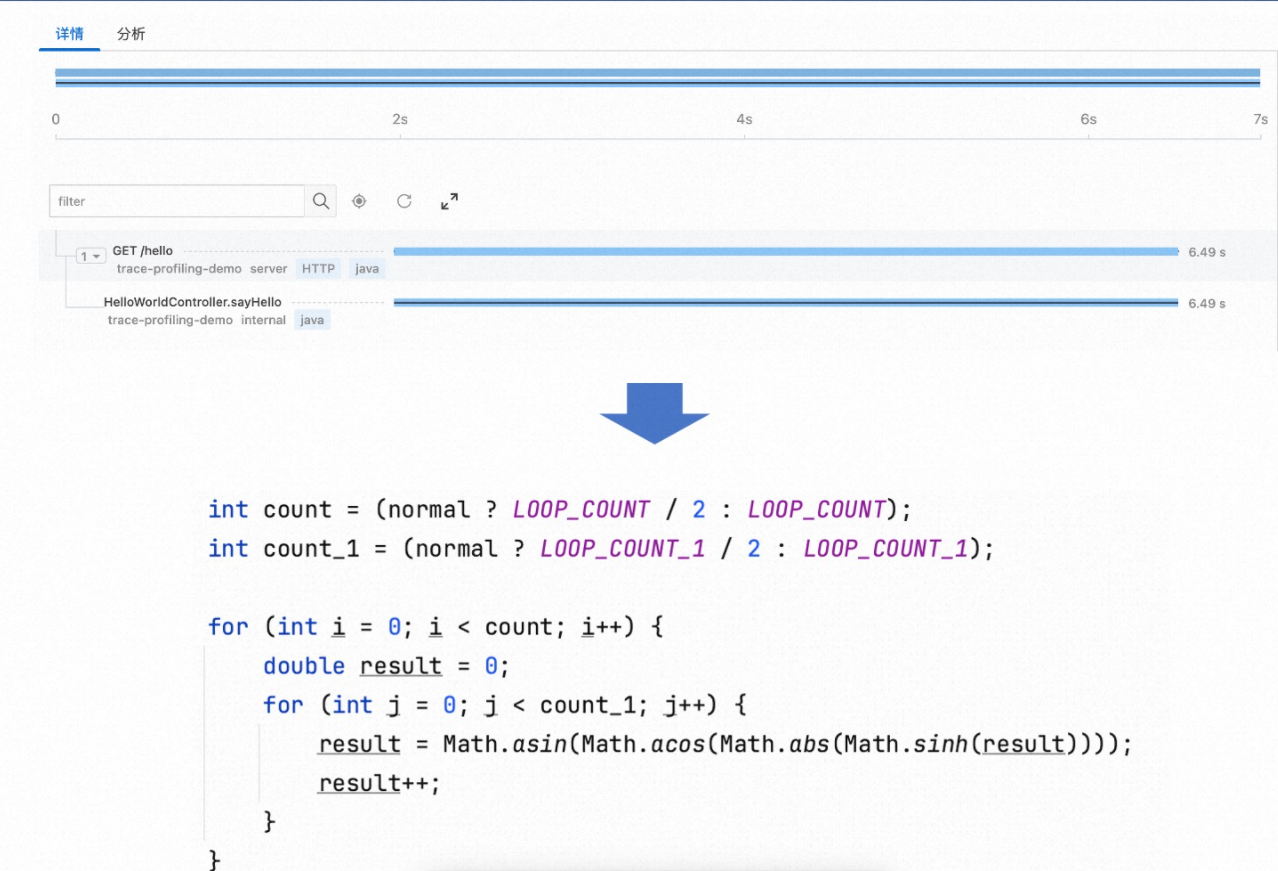
Trace埋点稀疏,CPU执行过长,导致无法定位问题根因
为了减少Agent对应用程序性能的影响,Trace数据不会对每一行代码进行埋点,这种选择性跟踪策略可能导致一些没有埋点的耗时代码区域在性能分析中形成盲点,如果这些区域出现性能问题,便难以通过Trace数据被检测到。 例如一个关键业务逻辑没有被跟踪,它的性能问题可能就无法通过Trace数据被发现。
安装 Profiling 数据接收端
安装CRD 模板工具
操作方式 | 描述 |
集群外安装 | 集群外部安装要求登录账户存在 |
集群内安装 | 容器内安装基于已安装组件 |
集群外安装
登录集群,下载模板工具。
中国地区
curl https://logtail-release-cn-hangzhou.oss-cn-hangzhou.aliyuncs.com/kubernetes/crd-tool.tar.gz -o /tmp/crd-tool.tar.gz海外地区
curl https://logtail-release-ap-southeast-1.oss-ap-southeast-1.aliyuncs.com/kubernetes/crd-tool.tar.gz -o /tmp/crd-tool.tar.gz
安装模板工具,安装成功后会在当前文件夹生成
sls-crd-tool工具。tar -xvf /tmp/crd-tool.tar.gz -C /tmp &&chmod 755 /tmp/crd-tool/install.sh && sh -x /tmp/crd-tool/install.sh执行
./sls-crd-tool list命令验证工具是否安装成功,当存在返回值时,说明工具安装成功。
容器内安装
登录集群,进入
alibaba-log-controller容器。kubectl get pods -n kube-system -o wide |grep alibaba-log-controller | awk -F ' ' '{print $1}' kubectl exec -it {pod} -n kube-system bash cd ~下载模板工具。
如集群内可以下载公网资源,操作方法如下:
中国地区
curl https://logtail-release-cn-hangzhou.oss-cn-hangzhou.aliyuncs.com/kubernetes/crd-tool.tar.gz -o /tmp/crd-tool.tar.gz海外地区
curl https://logtail-release-ap-southeast-1.oss-ap-southeast-1.aliyuncs.com/kubernetes/crd-tool.tar.gz -o /tmp/crd-tool.tar.gz
如集群内无法下载公网资源,可以集群外下载,使用
kubectl cp <source> <destination>或者ACK上传等功能将模板工具传输至上述容器。
安装模板工具,安装成功后会在当前文件夹生成
sls-crd-tool工具。tar -xvf /tmp/crd-tool.tar.gz -C /tmp &&chmod 755 /tmp/crd-tool/install.sh && sh -x /tmp/crd-tool/install.sh执行
./sls-crd-tool list命令验证工具是否安装成功,当存在返回值时,说明工具安装成功。
安装Profiling数据接收服务
执行
./sls-crd-tool -l en list命令。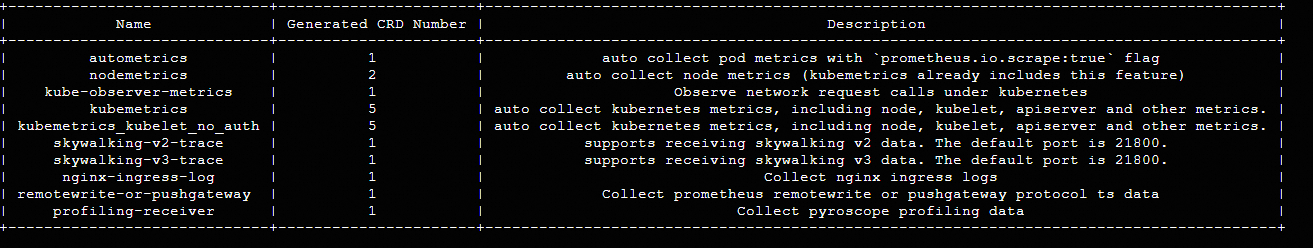
执行
./sls-crd-tool -i get --project ${project} --instance ${instance} profiling-receiver。${project} :全栈可观测实例归属的 Project
${instance}: 全站可观测实例 ID
执行
./sls-crd-tool apply -f template-profiling-receiver.yaml。
应用端
安装Profiling Extension
创建 profiling_config.yaml 配置文件(该配置仅采集 10 条 Trace)
enabled: true
maxProfilingCount: 10
profilingIntervalMillis: 5000
agentConfigs:
   agent.upload.server: "http://
logtail-statefulset.kube-system:4040"
   agent.timeout: 10
   agent.ingest.max.tries: 2
   agent.log.level: off
   agent.log.file: ""
   period: 20
   cpu.engine: async_profiler
   wallclock.engine: async_profiler
   alloc.engine: async_profiler
以下是相关配置参数说明
配置项
说明
是否必填
默认值
enabled
是否开启Profiling
是
false
maxProfilingCount
最大Profiling并行任务数
否
10
profilingIntervalMillis
Profiling任务间隔
否
5000
agentConfigs
Profiling Agent配置
否
agent.upload.server
Profiling数据上报地址
否
agent.timeout
Profiling数据上报超时时间 ,单位:s(秒)
否
10
agent.ingest.max.tries
Profiling数据上传重试次数
否
2
agent.log.level
Profiling Agent日志级别
否
off
agent.log.file
Profiling Agent日志文件路径
否
period
Profiling数据上传周期,单位:s(秒)
否
20
cpu.engine
CPU采集引擎,目前支持
auto/async_profiler/jfr/off否
off
wallclock.engine
WallClock采集引擎,目前支持
auto/async_profiler/off否
off
alloc.engine
Alloc采集引擎,目前支持
auto/async_profiler/jfr/off否
off
profilingRules
Profiling规则配置
否
profilingRules.name
Profiling规则名称
是
profilingRules.type
Profiling规则类型,目前支持
ROOT_SPAN, AGENT_RESOURCE, SPAN_NAME是
profilingRules.attributes
Profiling规则属性,根据不同的规则类型,属性值也不同
否
启动应用程序
java -javaagent:/path/to/opentelemetry-javaagent-all.jar \
     -Dotel.service.name=test-demo \
     -Dotel.javaagent.extensions=/path/to/otel-extension.jar \
     -Dotel.profiling.config_endpoint=file:/path/to/profiling_config.yaml \
     -Dotel.service.name=trace-profiling-demo \
     -jar myapp.jar
查看数据
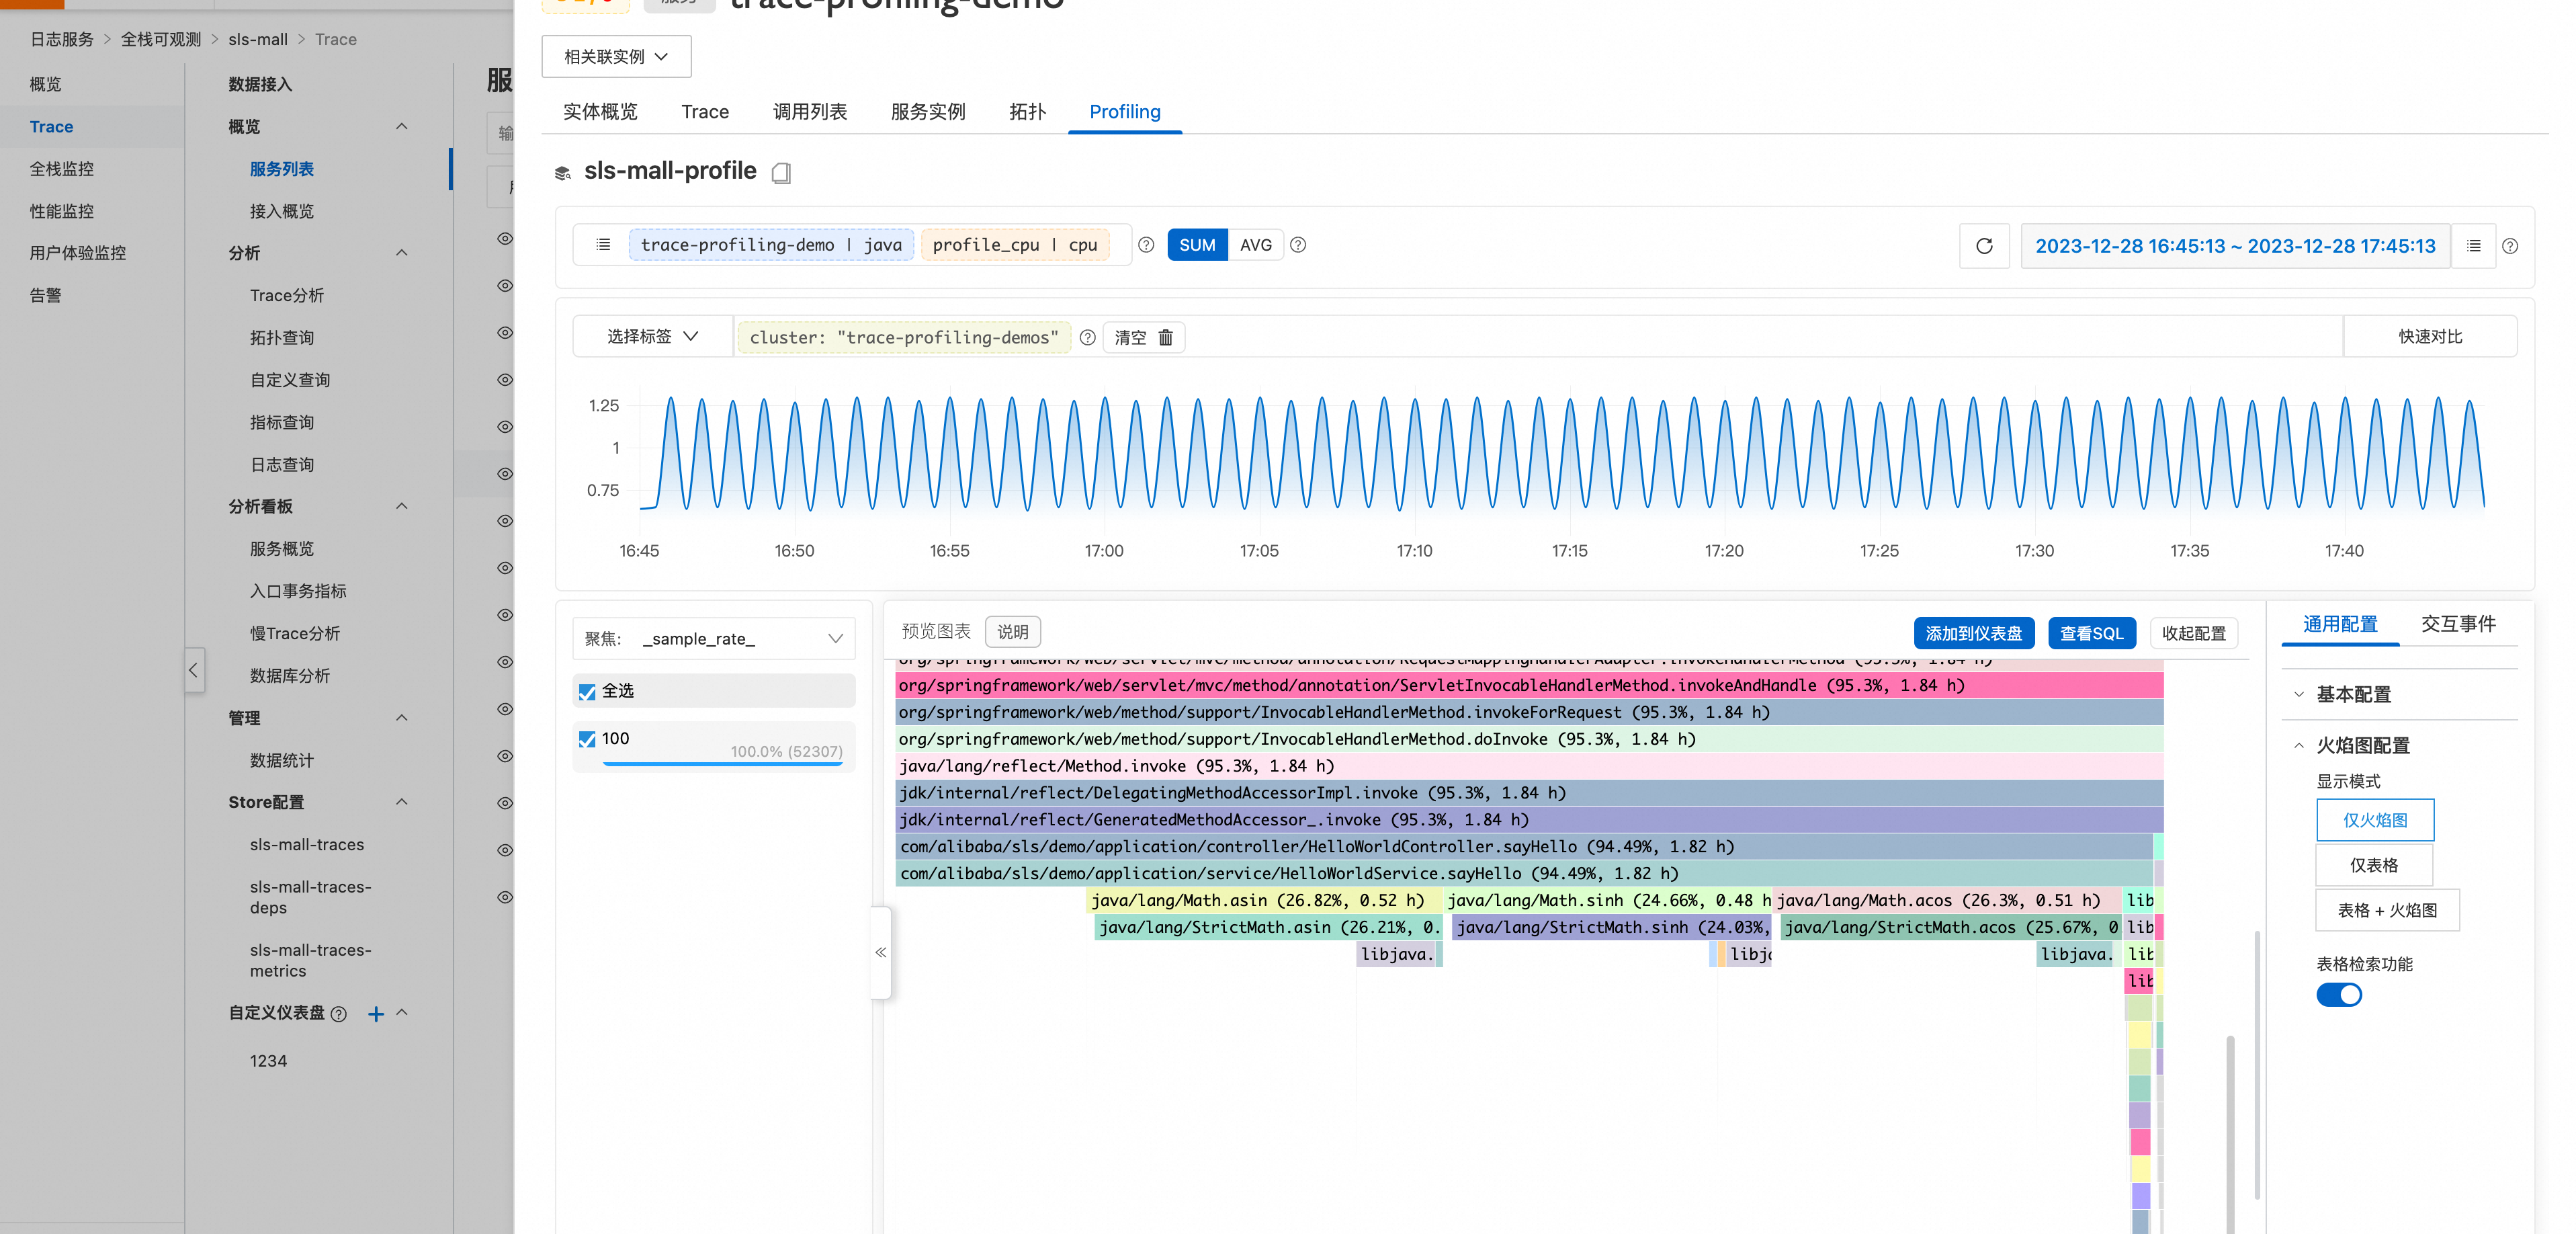
进入到全站可观测实例,就可以点击相关接入服务,即可查看相关的Profiling数据。
配置示例
配置所有Root Span进行Profiling。
enabled: true
maxProfilingCount: 10
profilingIntervalMillis: 5000
agentConfigs:
  agent.upload.server: "http://localhost:4040"
  agent.timeout: 10
  agent.ingest.max.tries: 2
  agent.log.level: off
  agent.log.file: ""
  period: 20
  cpu.engine: async_profiler
  wallclock.engine: async_profiler
  alloc.engine: async_profiler
profilingRules:
  - name: "profiling root span"
type: ROOT_SPAN配置所有service.name为payment的Root Span进行Profiling。
enabled: true
maxProfilingCount: 10
profilingIntervalMillis: 5000
agentConfigs:
  agent.upload.server: "http://localhost:4040"
  agent.timeout: 10
  agent.ingest.max.tries: 2
  agent.log.level: off
  agent.log.file: ""
  period: 20
  cpu.engine: async_profiler
  wallclock.engine: async_profiler
  alloc.engine: async_profiler
profilingRules:
  - name: "profiling root span"
    type: ROOT_SPAN
  - name: "profiling all spans with some resouce attribute"
    type: AGENT_RESOURCE
    attributes:
service.name: "payment" #例如,这里指定了service.name为payment的Span将会被采集配置所有Span service.name为payment,并且Span Name以`Get`开头的Span进行Profiling。
enabled: true
maxProfilingCount: 10
profilingIntervalMillis: 5000
agentConfigs:
   agent.upload.server: "http://localhost:4040"
   agent.timeout: 10
   agent.ingest.max.tries: 2
   agent.log.level: off
   agent.log.file: ""
   period: 20
   cpu.engine: async_profiler
   wallclock.engine: async_profiler
   alloc.engine: async_profiler
profilingRules:
   - name: "profiling all spans with some resouce attribute"
     type: AGENT_RESOURCE
     attributes:
        service.name: "payment" #例如,这里指定了service.name为payment的Span将会被采集
   - name: "profiling with span name"
     type: SPAN_NAME
     attributes:
        pattern: "Get*" # 支持正则表达式