kube-apiserver: Metrics and dashboard
Monitor kube-apiserver health in ACK clusters. The component provides the Kubernetes RESTful API, which lets external clients and other in-cluster components interact with the cluster. Use the metrics list, dashboard guidance, and anomaly analysis in this topic to diagnose issues.
Usage notes
Dashboard access
See View control plane component dashboards.
Metrics
Metrics are one way that a component exposes its status and parameters. The following table lists the kube-apiserver metrics.
|
Metric |
Type |
Description |
|
apiserver_request_duration_seconds_bucket |
Histogram |
The latency distribution of client requests to the API Server. Dimensions:
Bucket thresholds for the API Server histogram: |
|
apiserver_request_total |
Counter |
Total API Server requests, broken down by Verb, Group, Version, Resource, Scope, Component, HTTP contentType, HTTP code (response status code), and Client. |
|
apiserver_request_no_resourceversion_list_total |
Counter |
LIST requests to the API Server without the |
|
apiserver_current_inflight_requests |
Gauge |
Requests the API Server is currently processing. These fall into two types:
|
|
apiserver_dropped_requests_total |
Counter |
Requests the API Server drops during throttling, returning a |
|
etcd_request_duration_seconds_bucket |
Histogram |
Request latency distribution from the API Server to etcd. Broken down by operation and object type. Bucket thresholds: |
|
apiserver_storage_db_size_in_use_quota_bytes |
Gauge |
The storage quota configured for the etcd database. Write requests are rejected when this limit is reached. Unit: bytes. |
|
apiserver_storage_db_size_in_use_bytes |
Gauge |
The amount of data storage that etcd currently uses. Unit: bytes. |
|
apiserver_flowcontrol_request_concurrency_limit |
Gauge |
The theoretical maximum number of requests that a priority queue can process concurrently under API Priority and Fairness (APF) throttling. Shows how the API Server uses traffic control policies to allocate capacity across priority queues so that high-priority requests are processed without delay. Deprecated in Kubernetes 1.30 and removed in 1.31. For clusters running Kubernetes 1.31 or later, use the apiserver_flowcontrol_nominal_limit_seats metric instead. |
|
apiserver_flowcontrol_current_executing_requests |
Gauge |
Requests currently executing in a priority queue, representing actual concurrent load. Monitor alongside the concurrency limit to determine whether the API Server is approaching saturation. |
|
apiserver_flowcontrol_current_inqueue_requests |
Gauge |
Requests waiting in a priority queue. A growing backlog indicates traffic pressure on the API Server and possible queue overload. |
|
apiserver_flowcontrol_nominal_limit_seats |
Gauge |
The nominal maximum concurrent seats in the API Server under APF, showing how traffic control policies allocate capacity across priority queues. Unit: seats. |
|
apiserver_flowcontrol_current_limit_seats |
Gauge |
The current APF concurrency limit in seats for a priority queue—the maximum concurrent seats allowed after dynamic adjustments. This value reflects the actual concurrency capacity of the queue and can change dynamically because of system load or other factors. Unlike |
|
apiserver_flowcontrol_current_executing_seats |
Gauge |
Seats consumed by currently executing requests in a priority queue, reflecting actual load. If To optimize the configuration, raise the maxMutatingRequestsInflight and maxRequestsInflight values for the API Server. See Customize the parameters of control plane components in ACK Pro clusters. |
|
apiserver_flowcontrol_current_inqueue_seats |
Gauge |
Seats occupied by requests waiting in a priority queue, representing the pending backlog. |
|
apiserver_flowcontrol_request_execution_seconds_bucket |
Histogram |
The execution time of a request, from start to completion. The bucket thresholds are {0, 0.005, 0.02, 0.05, 0.1, 0.2, 0.5, 1, 2, 5, 10, 15, 30}. Unit: seconds. |
|
apiserver_flowcontrol_request_wait_duration_seconds_bucket |
Histogram |
The time a request waits in a queue before execution starts. The bucket thresholds are {0, 0.005, 0.02, 0.05, 0.1, 0.2, 0.5, 1, 2, 5, 10, 15, 30}. Unit: seconds. |
|
apiserver_flowcontrol_dispatched_requests_total |
Counter |
Total requests successfully dispatched by the API Server under APF. |
|
apiserver_flowcontrol_rejected_requests_total |
Counter |
Requests rejected for exceeding the concurrency limit or queue capacity. |
|
apiserver_admission_controller_admission_duration_seconds_bucket |
Histogram |
Processing latency of an admission controller. Labels: controller name, operation (such as CREATE, UPDATE, CONNECT), API resource, operation type, and rejection status (true or false). The operation type is validate, which checks whether the request is valid, or admit, which decides whether to allow a valid request. Bucket thresholds: |
|
apiserver_admission_webhook_admission_duration_seconds_bucket |
Histogram |
Processing latency of an admission webhook. Labels: webhook name, operation (such as CREATE, UPDATE, CONNECT), API resource, operation type (admit or validating), and rejection status (true or false). Bucket thresholds: |
|
apiserver_admission_webhook_admission_duration_seconds_count |
Counter |
Requests processed by an admission webhook. Labels: webhook name, operation (such as CREATE, UPDATE, CONNECT), API resource, operation type (admit or validating), and rejection status (true or false). |
|
cpu_utilization_core |
Gauge |
The number of CPU cores in use. Unit: core. |
|
memory_utilization_byte |
Gauge |
The amount of memory in use. Unit: byte. |
|
resource_utilization_level |
Gauge |
Resource utilization level.
|
|
up |
Gauge |
Indicates whether the service is available.
|
The following resource utilization metrics are no longer in use. Remove any alerts or monitoring rules that rely on these metrics:
cpu_utilization_ratio: CPU utilization.
memory_utilization_ratio: Memory utilization.
Dashboard
The dashboard is built from component metrics and related PromQL queries.
Dashboard panels in the most common order of use:
-
Key metrics: Get a quick overview of key cluster metrics.
-
Overview: Analyze the API Server response latency, the number of in-flight requests, and any throttling events.
-
Resource analysis: Review the resource utilization levels of managed components.
-
QPS and latency: Perform an in-depth, multi-dimensional analysis of queries per second (QPS) and response time (RT).
-
APF throttling: Use APF metrics to analyze the request traffic distribution of the API Server, its throttling status, and system performance bottlenecks.
-
Admission controllers and webhooks: Analyze the QPS and RT of admission controllers and webhooks.
-
Client analysis: Perform a multi-dimensional analysis of QPS by client.
Filters
Use the filters above the dashboard to configure the Verb, Resource, and Quantile for API Server requests, as well as the sampling Interval of the PromQL that the panels use.
A quantile of 0.9 (P90) shows the value at or below which 90% of histogram samples fall, filtering out long-tail outliers. A quantile of 0.99 (P99) includes long-tail samples.

Use the following filters to select the time range and refresh interval.

Key metrics
Dashboard view

Metric details
|
Name |
PromQL |
Description |
|
API QPS |
sum(irate(apiserver_request_total[$interval])) |
Total QPS for the API Server. |
|
Read request success rate |
sum(irate(apiserver_request_total{code=~"20.*",verb=~"GET|LIST"}[$interval]))/sum(irate(apiserver_request_total{verb=~"GET|LIST"}[$interval])) |
Read request success rate for the API Server. |
|
Write request success rate |
sum(irate(apiserver_request_total{code=~"20.*",verb!~"GET|LIST|WATCH|CONNECT"}[$interval]))/sum(irate(apiserver_request_total{verb!~"GET|LIST|WATCH|CONNECT"}[$interval])) |
Write request success rate for the API Server. |
|
Number of read requests processed |
sum(apiserver_current_inflight_requests{requestKind="readOnly"}) |
Read requests currently in flight. |
|
Number of write requests processed |
sum(apiserver_current_inflight_requests{requestKind="mutating"}) |
Write requests currently in flight. |
|
Request limit rate |
sum(irate(apiserver_dropped_requests_total[$interval])) |
Percentage of total requests dropped by the API server throttling policy. |
Overview
Dashboard view
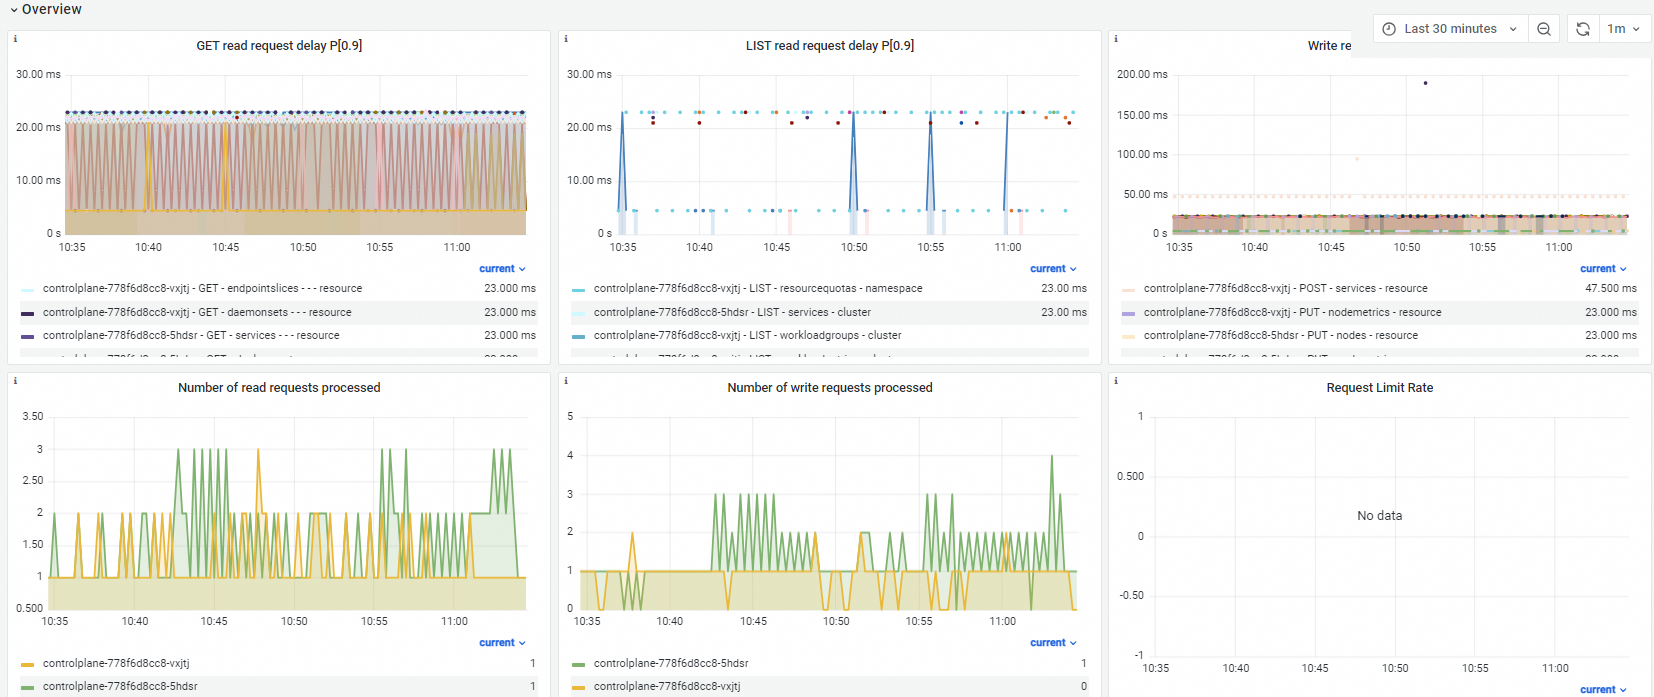
Metric details
|
Name |
PromQL |
Description |
|
GET read request latency |
histogram_quantile($quantile, sum(irate(apiserver_request_duration_seconds_bucket{verb="GET",resource!="",subresource!~"log|proxy"}[$interval])) by (pod, verb, resource, subresource, scope, le)) |
GET request response time, broken down by API Server pod, resource, and scope. |
|
LIST read request latency |
histogram_quantile($quantile, sum(irate(apiserver_request_duration_seconds_bucket{verb="LIST"}[$interval])) by (pod_name, verb, resource, scope, le)) |
LIST request response time, broken down by API Server pod, resource, and scope. |
|
Write request latency |
histogram_quantile($quantile, sum(irate(apiserver_request_duration_seconds_bucket{verb!~"GET|WATCH|LIST|CONNECT"}[$interval])) by (cluster, pod_name, verb, resource, scope, le)) |
Mutating request response time, broken down by API Server pod, verb (excluding GET, WATCH, LIST, CONNECT), resource, and scope. |
|
Number of read requests processed |
apiserver_current_inflight_requests{request_kind="readOnly"} |
Read requests the API Server is currently processing. |
|
Number of write requests processed |
apiserver_current_inflight_requests{request_kind="mutating"} |
Write requests the API Server is currently processing. |
|
Request limit rate |
sum(irate(apiserver_dropped_requests_total{request_kind="readOnly"}[$interval])) by (name) sum(irate(apiserver_dropped_requests_total{request_kind="mutating"}[$interval])) by (name)
|
Request limit rate for the API Server. |
Resource analysis
Dashboard view
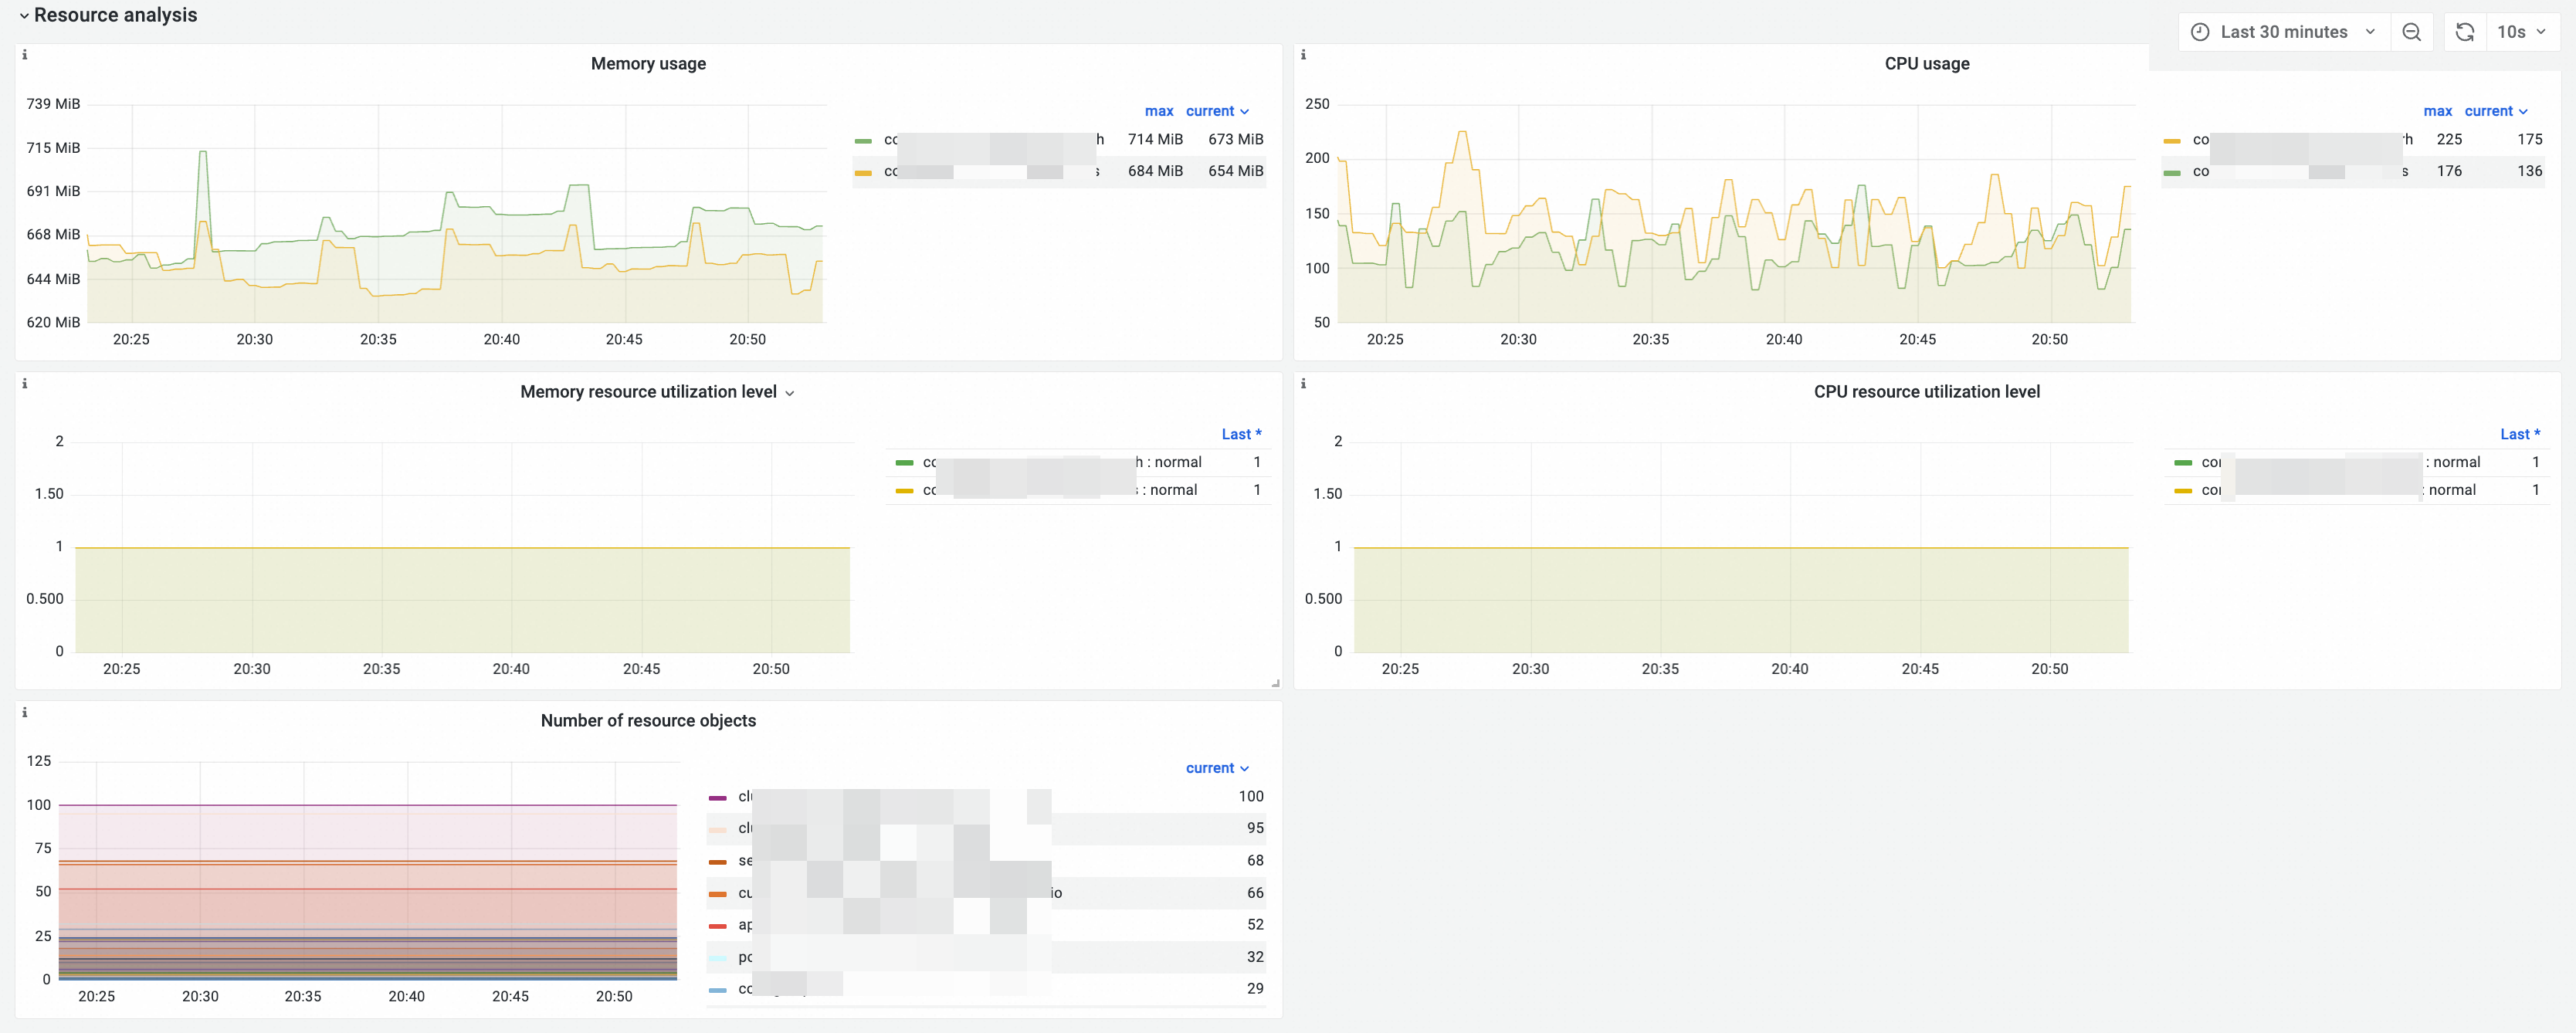
Metric details
|
Name |
PromQL |
Description |
|
Memory usage |
memory_utilization_byte{container="kube-apiserver"} |
Memory usage of the API Server. Unit: bytes. |
|
CPU usage |
cpu_utilization_core{container="kube-apiserver"}*1000 |
CPU usage of the API Server. Unit: millicores. |
|
Resource object count |
|
|
|
Memory utilization level |
|
|
|
CPU utilization level |
|
QPS and latency
Dashboard view

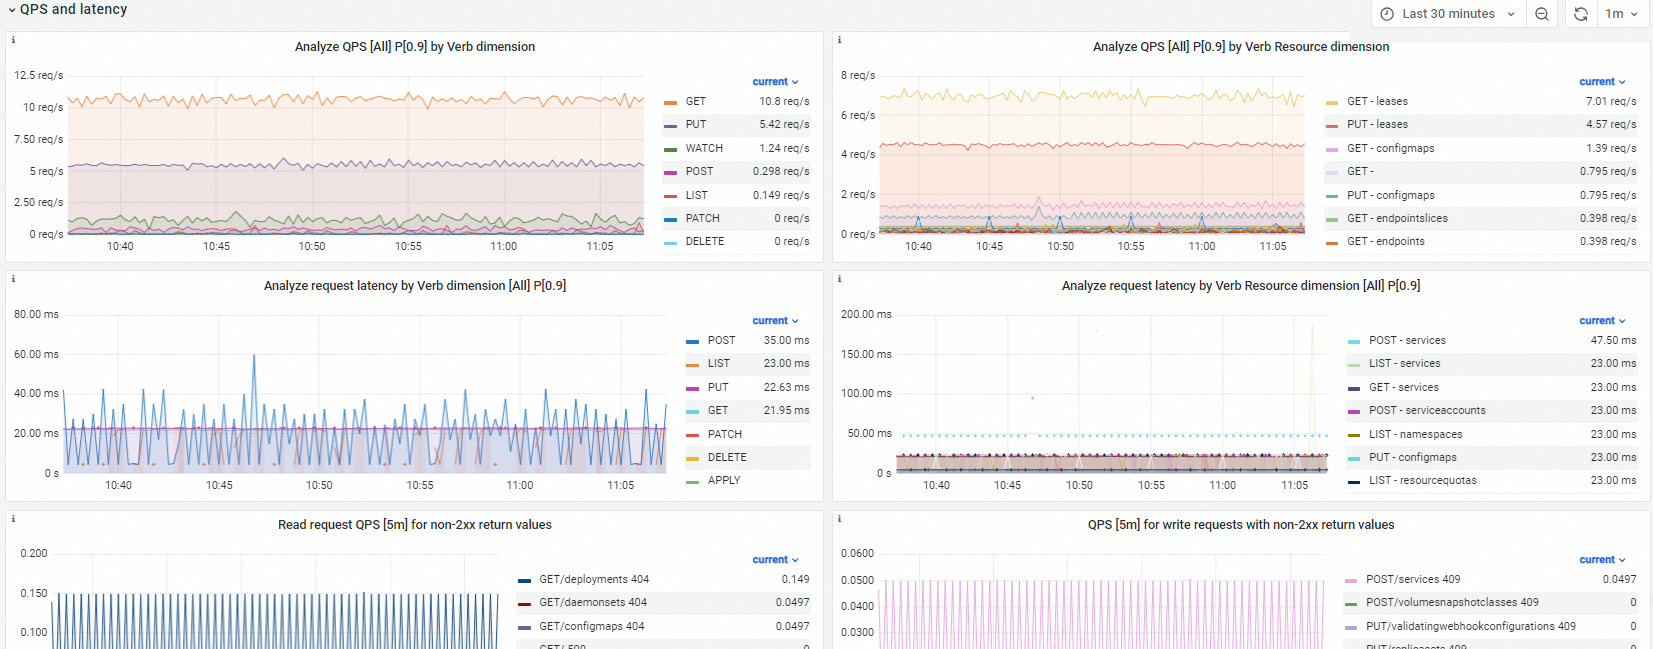
Metric details
|
Name |
PromQL |
Description |
|
QPS analysis by verb |
sum(irate(apiserver_request_total{verb=~"$verb"}[$interval]))by(verb) |
The request QPS, broken down by verb. |
|
QPS analysis by verb and resource |
sum(irate(apiserver_request_total{verb=~"$verb",resource=~"$resource"}[$interval]))by(verb,resource) |
The request QPS, broken down by verb and resource. |
|
Request latency analysis by verb |
histogram_quantile($quantile, sum(irate(apiserver_request_duration_seconds_bucket{verb=~"$verb", verb!~"WATCH|CONNECT",resource!=""}[$interval])) by (le,verb)) |
The request latency, broken down by verb. |
|
Request latency analysis by verb and resource |
histogram_quantile($quantile, sum(irate(apiserver_request_duration_seconds_bucket{verb=~"$verb", verb!~"WATCH|CONNECT", resource=~"$resource",resource!=""}[$interval])) by (le,verb,resource)) |
The request latency, broken down by verb and resource. |
|
QPS of read requests with non-2xx responses |
sum(irate(apiserver_request_total{verb=~"GET|LIST",resource=~"$resource",code!~"2.*"}[$interval])) by (verb,resource,code) |
The QPS of read requests that returned a non-2xx status code, such as 4xx or 5xx. |
|
QPS of write requests with non-2xx responses |
sum(irate(apiserver_request_total{verb!~"GET|LIST|WATCH",verb=~"$verb",resource=~"$resource",code!~"2.*"}[$interval])) by (verb,resource,code) |
The QPS of write requests that returned a non-2xx status code, such as 4xx or 5xx. |
|
API Server to etcd request latency |
histogram_quantile($quantile, sum(irate(etcd_request_duration_seconds_bucket[$interval])) by (le,operation,type,instance)) |
The latency of requests from the API Server to etcd. |
APF throttling
Monitoring of APF throttling metrics is in canary release.
-
APF-related metrics are available only for ACK clusters running Kubernetes 1.20 or later. To upgrade your cluster, see Manually upgrade an ACK cluster.
-
the APF metrics dashboard also requires upgrading the following add-ons:
-
Container cluster monitoring add-on: 0.06 or later.
-
ack-arms-prometheus add-on: v1.1.31 or later.
-
Managed probe add-on: v1.1.31 or later.
To upgrade these add-ons, see Upgrade monitoring components.
-
Dashboard view
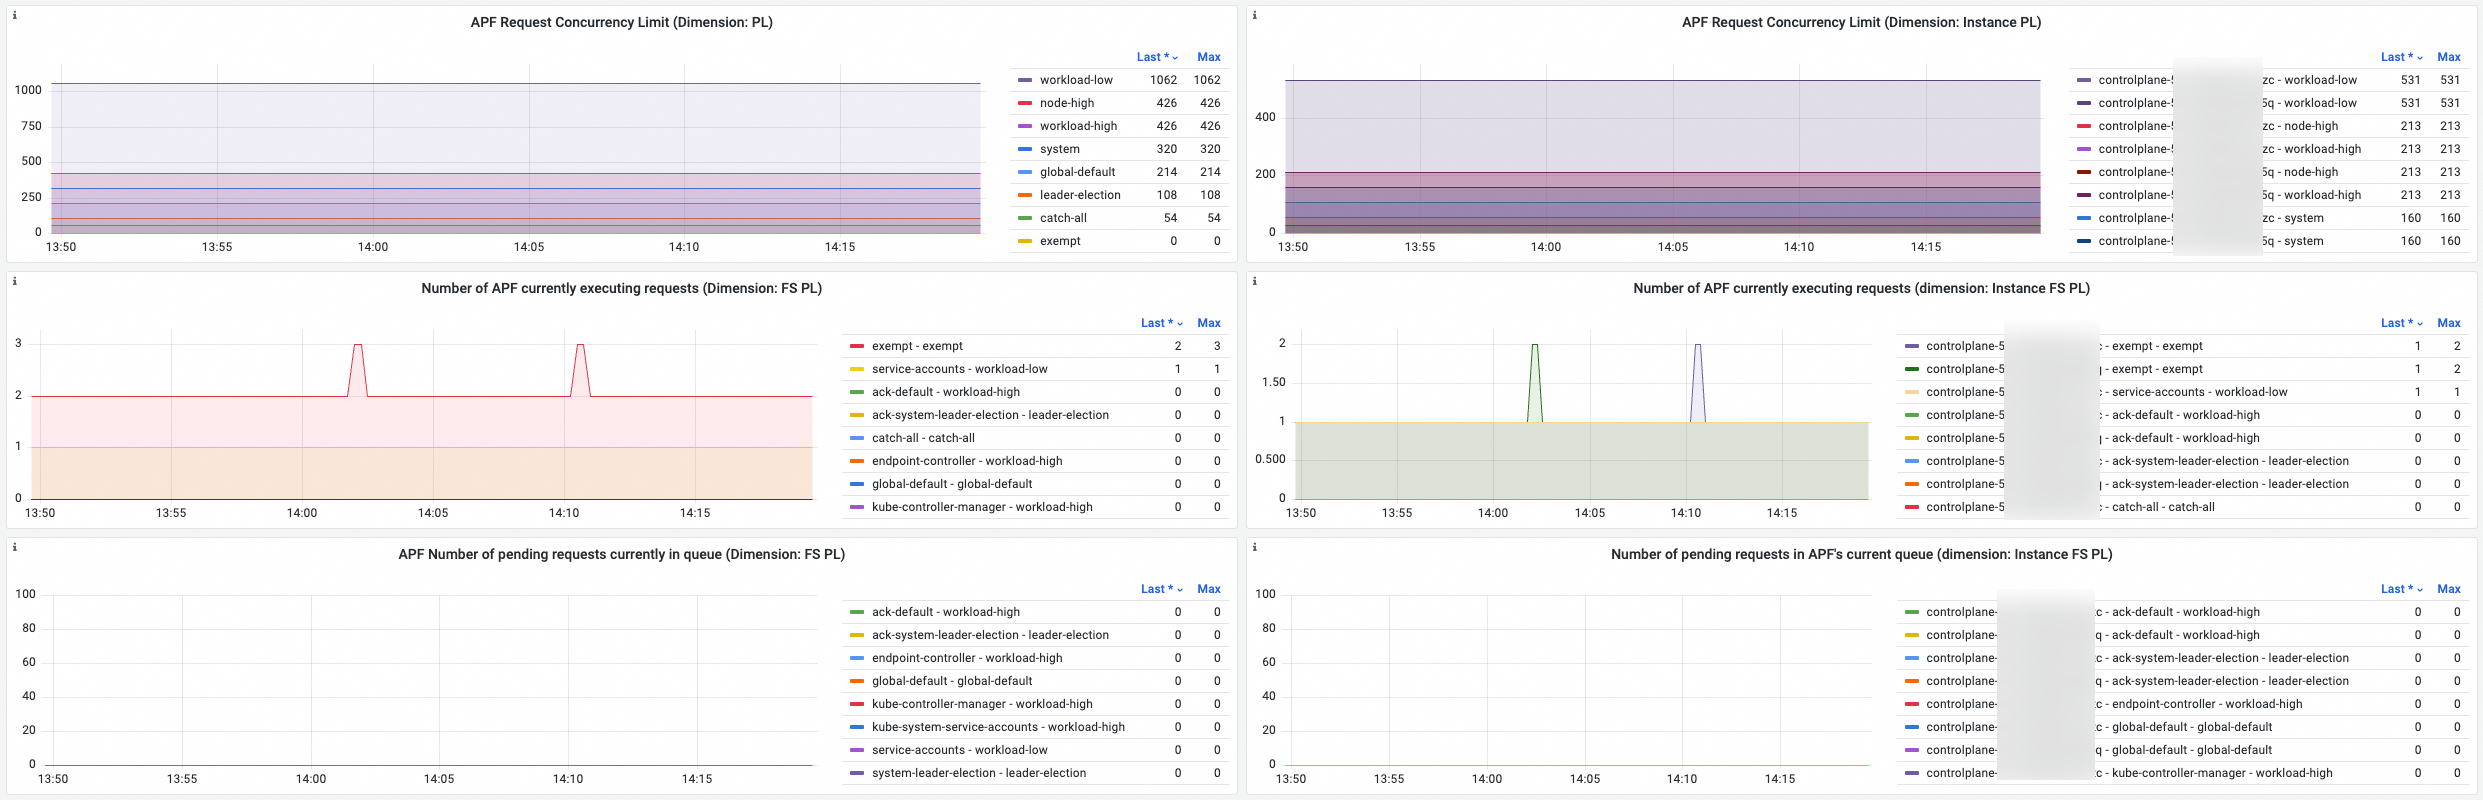

Metric details
Some metrics in the following table are broken down by PL, Instance, and FS.
-
PL: Priority Level dimension, which breaks down metrics by priority level.
-
Instance: API server instance.
-
FS: Flow Schema dimension, which breaks down metrics by request classification.
For APF and dimension details, see the Kubernetes API Priority and Fairness documentation.
|
Name |
PromQL |
Description |
|
APF request concurrency limit (by PL) |
sum by(priority_level) (apiserver_flowcontrol_request_concurrency_limit) |
APF request concurrency limit, broken down by PL or Instance + PL. It represents the theoretical maximum number of concurrent requests per priority queue.
|
|
APF request concurrency limit (by Instance + PL) |
sum by(instance,priority_level) (apiserver_flowcontrol_request_concurrency_limit) |
|
|
Number of current APF executing requests (by FS + PL) |
sum by(flow_schema,priority_level) (apiserver_flowcontrol_current_executing_requests) |
Requests currently executing under APF, broken down by FS + PL or Instance + FS + PL. |
|
Number of current APF executing requests (by Instance + FS + PL) |
sum by(instance,flow_schema,priority_level)(apiserver_flowcontrol_current_executing_requests) |
|
|
Number of current APF in-queue requests (by FS + PL) |
sum by(flow_schema,priority_level) (apiserver_flowcontrol_current_inqueue_requests) |
Requests waiting in queue, broken down by FS + PL or Instance + FS + PL. |
|
Number of current APF in-queue requests (by Instance + FS + PL) |
sum by(instance,flow_schema,priority_level) (apiserver_flowcontrol_current_inqueue_requests) |
|
|
APF nominal limit seats |
sum by(instance,priority_level) (apiserver_flowcontrol_nominal_limit_seats) |
APF seat metrics by Instance + PL:
|
|
APF current limit seats |
sum by(instance,priority_level) (apiserver_flowcontrol_current_limit_seats) |
|
|
APF current executing seats |
sum by(instance,priority_level) (apiserver_flowcontrol_current_executing_seats) |
|
|
APF current in-queue seats |
sum by(instance,priority_level) (apiserver_flowcontrol_current_inqueue_seats) |
|
|
APF request execution time |
histogram_quantile($quantile, sum(irate(apiserver_flowcontrol_request_execution_seconds_bucket[$interval])) by (le,instance, flow_schema,priority_level)) |
Time from request execution start to completion. |
|
APF request wait time |
histogram_quantile($quantile, sum(irate(apiserver_flowcontrol_request_wait_duration_seconds_bucket[$interval])) by (le,instance, flow_schema,priority_level)) |
Time a request waits in queue before execution. |
|
QPS of successfully dispatched APF requests |
sum(irate(apiserver_flowcontrol_dispatched_requests_total[$interval]))by(instance,flow_schema,priority_level) |
QPS of successfully dispatched requests. |
|
QPS of rejected APF requests |
sum(irate(apiserver_flowcontrol_rejected_requests_total[$interval]))by(instance,flow_schema,priority_level) |
QPS of requests rejected for exceeding concurrency limit or queue capacity. |
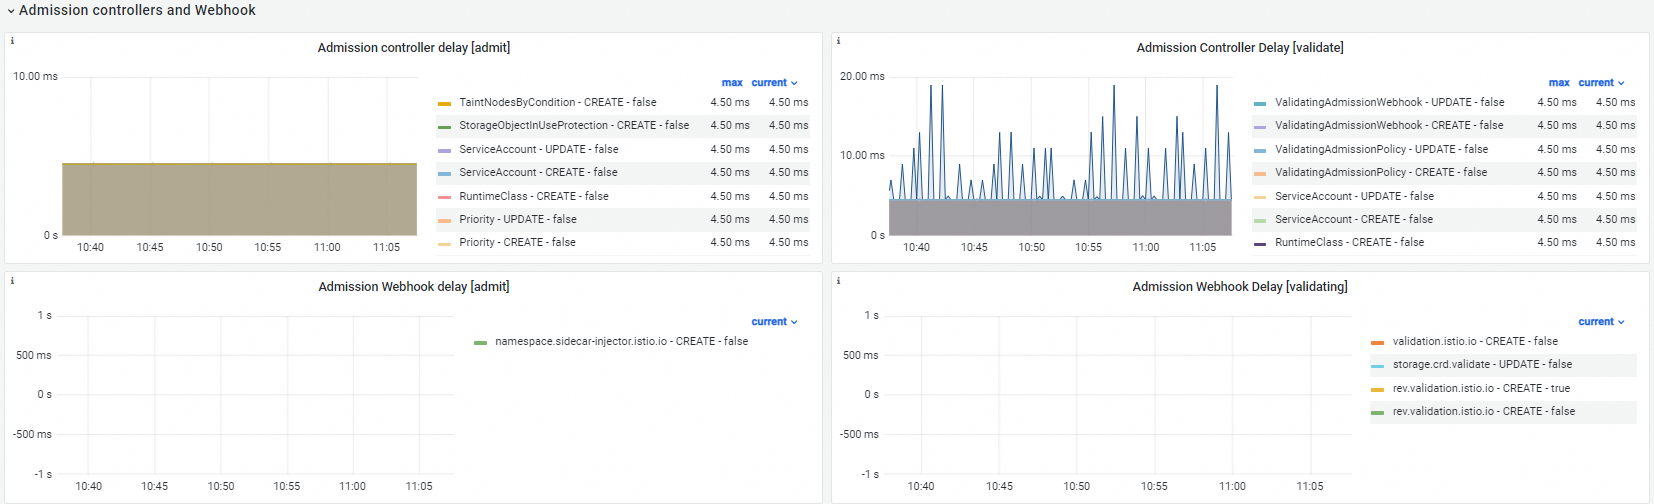
Admission controllers and webhooks
Dashboard view
Metric details
|
Name |
PromQL |
Description |
|
Admission controller latency [admit] |
histogram_quantile($quantile, sum by(operation, name, le, type, rejected) (irate(apiserver_admission_controller_admission_duration_seconds_bucket{type="admit"}[$interval])) ) |
The name, operation, rejection status, and execution time of Histogram buckets: |
|
Admission controller latency [validate] |
histogram_quantile($quantile, sum by(operation, name, le, type, rejected) (irate(apiserver_admission_controller_admission_duration_seconds_bucket{type="validate"}[$interval])) ) |
The name, operation, rejection status, and execution time of Histogram buckets: |
|
Admission webhook latency [admit] |
histogram_quantile($quantile, sum by(operation, name, le, type, rejected) (irate(apiserver_admission_webhook_admission_duration_seconds_bucket{type="admit"}[$interval])) ) |
The name, operation, rejection status, and execution time of Histogram buckets: |
|
Admission webhook latency [validating] |
histogram_quantile($quantile, sum by(operation, name, le, type, rejected) (irate(apiserver_admission_webhook_admission_duration_seconds_bucket{type="validating"}[$interval])) ) |
The name, operation, rejection status, and execution time of Histogram buckets: |
|
Admission webhook request QPS |
sum(irate(apiserver_admission_webhook_admission_duration_seconds_count[$interval]))by(name,operation,type,rejected) |
The request QPS of admission webhooks. |
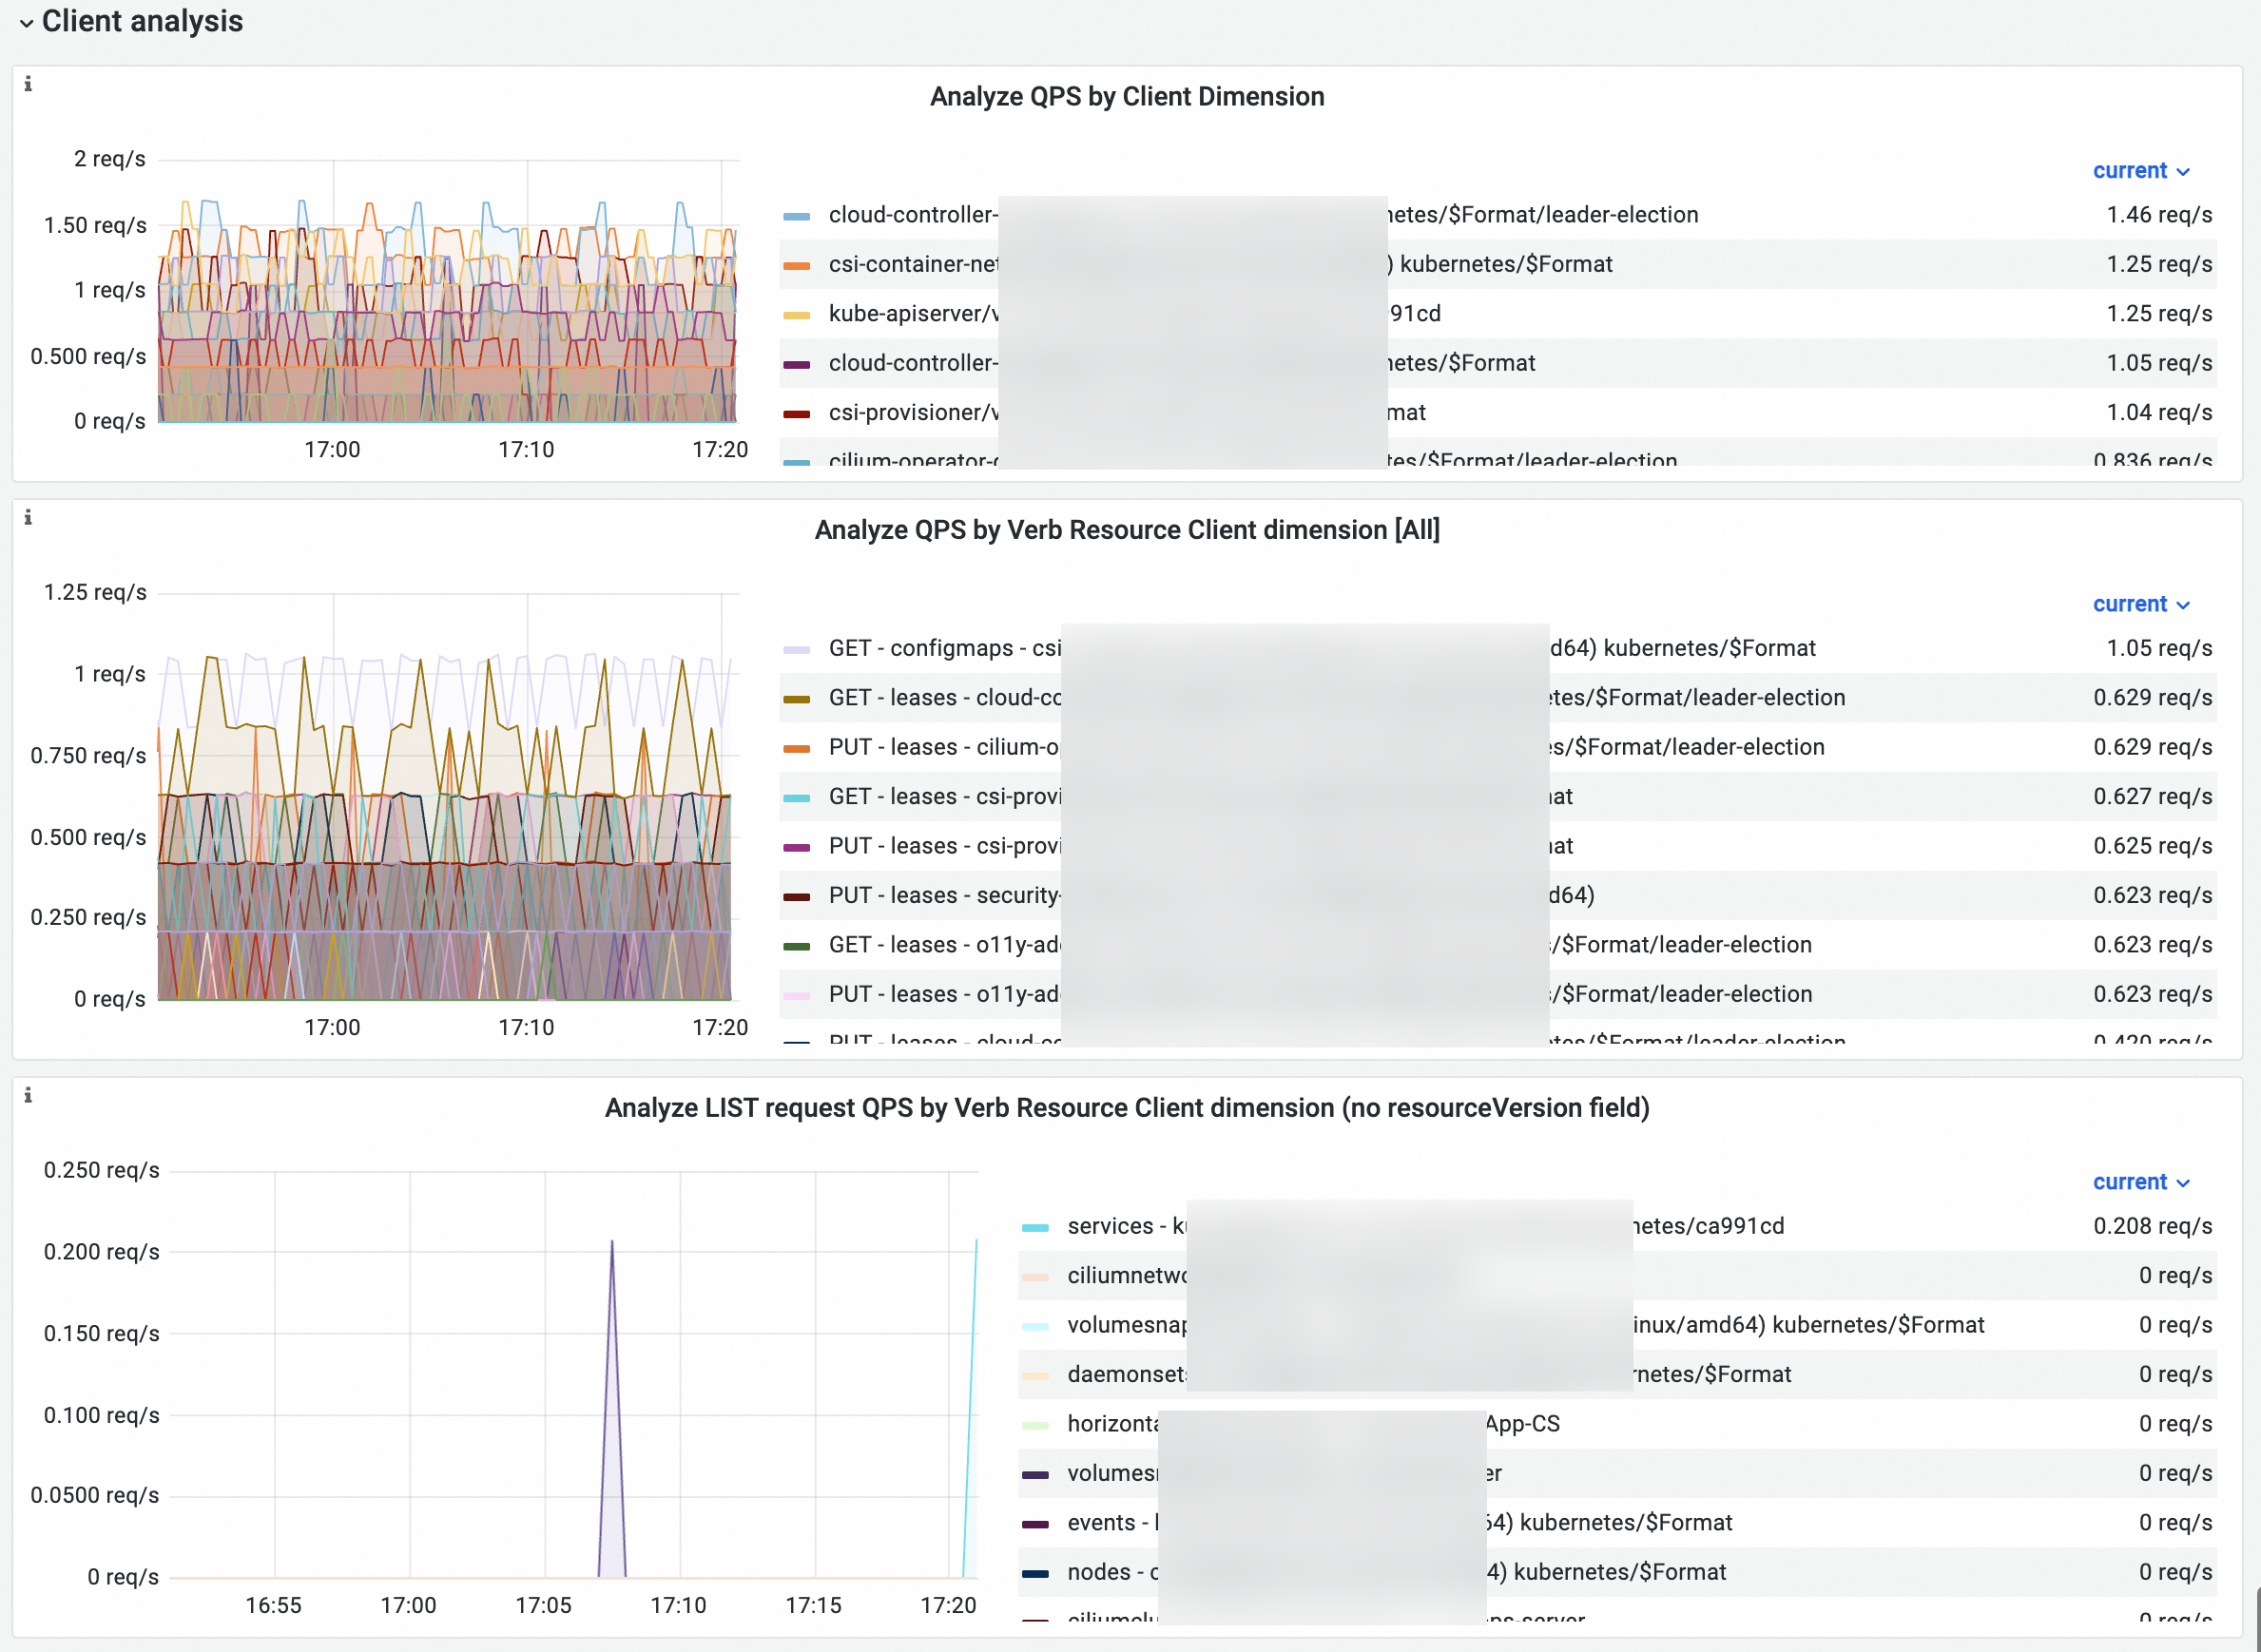
Client analysis
Dashboard view
Metric details
|
Name |
PromQL |
Description |
|
QPS analysis by client |
sum(irate(apiserver_request_total{client!=""}[$interval])) by (client) |
QPS by client, showing which clients access the API Server. |
|
QPS analysis by verb, resource, and client |
sum(irate(apiserver_request_total{client!="",verb=~"$verb", resource=~"$resource"}[$interval]))by(verb,resource,client) |
The QPS of API server requests, broken down by verb, resource, and client. |
|
QPS of LIST requests without resourceVersion |
sum(irate(apiserver_request_no_resourceversion_list_total[$interval]))by(resource,client) |
|
Common metric anomalies
Use the following sections to determine whether metric anomalies are expected.
Read/write request success rate
Description
|
Normal |
Abnormal |
Description |
|
The Read request success rate and Write request success rate should be close to 100%. |
The Read request success rate and Write request success rate remain at a low percentage, for example, less than 90%. |
Many requests return non-2xx status codes. |
Recommended solution
Check the QPS of read requests with non-2xx responses and QPS of write requests with non-2xx responses panels to identify request types and resources causing non-2xx responses. For example, GET/deployment 404 means GET Deployment requests return 404, lowering the Read request success rate. Determine whether this behavior is expected, and then take measures to optimize the requests.
GET/LIST read and write request latency
Description
|
Normal |
Abnormal |
Description |
|
The GET read request latency, LIST read request latency, and Write request latency correlate with cluster size and number of resources accessed. No fixed threshold applies—latency is acceptable if it does not affect your applications. For example, the larger the volume of a resource that clients access, the longer LIST requests take. Typically, GET read request latency and Write request latency under 1s, and LIST read request latency under 5s are normal. |
|
If request latency is high, check whether factors such as a large number of cluster resources or slow webhook calls are contributing. |
Recommended solution
-
Review the dashboard to identify request types and resources with high latency. Check the GET read request latency, LIST read request latency, and Write request latency metrics, and then take corrective action.
The
apiserver_request_duration_seconds_bucketmetric caps at 60s—requests exceeding 60s are recorded as 60s. Persistent-connection requests, such asPOST pod/execor log reads, typically exceed this threshold and can be ignored when troubleshooting.
-
Check admission webhook latency to determine whether slow webhooks are causing high API server request latency.
Read/write requests processed and request limit rate
Description
|
Normal |
Abnormal |
Description |
|
Typically, Number of read requests processed and Number of write requests processed are under 100, and Request limit rate is 0. |
|
If the request queue has a backlog, rule out factors such as a sudden request surge or slow webhooks. If queue capacity is exceeded, the API server throttles requests, causing the Request limit rate to rise above 0 and affecting cluster stability. |
Recommended solution
-
Review the QPS and latency dashboard and the Client analysis dashboard to identify the top requests by volume, and assess whether they are expected. If requests come from your applications, determine whether you can reduce their volume.
-
Check admission webhook latency to determine whether slow webhooks are causing slow API server request processing.
Admission webhook latency
Description
|
Normal |
Abnormal |
Description |
|
The Admission webhook latency should be less than 0.5s. |
The Admission webhook latency persistently exceeds 0.5s. |
Slow webhook responses affect API server response latency. |
Recommended solution
Review webhook logs to determine whether the behavior is expected. Uninstall webhooks that are no longer needed.
References
-
Metrics, dashboards, and anomaly troubleshooting for other control plane components:
-
To query Prometheus monitoring data with the console or an API, see Query Prometheus Monitoring Data by Using PromQL.
-
To create alert rules with custom PromQL in Managed Service for Prometheus, see Create a Prometheus Alerting Rule.