The kube-scheduler component is the default scheduler in a Kubernetes cluster, responsible for assigning Pods to suitable nodes. This topic describes the monitoring metrics for the kube-scheduler component, provides guidance on using its dashboard, and explains how to resolve common metric anomalies.
Before you begin
Access the dashboard
See View Monitoring Dashboards for Control Plane Components.
List of metrics
Metrics expose the status and parameters of a component. The following table lists the metrics for the kube-scheduler component.
Metric | Type | Description |
scheduler_scheduler_cache_size | Gauge | The number of nodes, Pods, and AssumedPods (Pods assumed to be scheduled) in the scheduler cache. |
scheduler_pending_pods | Gauge | The number of pending Pods. Pods are categorized by queue type:
|
scheduler_pod_scheduling_attempts_bucket | Histogram | The number of attempts required to schedule a Pod. The bucket thresholds are |
memory_utilization_byte | Gauge | The memory usage, in bytes. |
cpu_utilization_core | Gauge | The CPU usage, in cores. |
resource_utilization_level | Gauge | Resource utilization level.
|
rest_client_requests_total | Counter | The number of HTTP requests, categorized by status code, method, and host. |
rest_client_request_duration_seconds_bucket | Histogram | The HTTP request latency, categorized by verb and URL. |
The following resource utilization metrics are no longer in use. Remove any alerts or monitoring rules that rely on these metrics:
cpu_utilization_ratio: CPU utilization.
memory_utilization_ratio: Memory utilization.
Dashboard
The dashboard visualizes component metrics by using PromQL queries. The following sections describe the data visualizations and their corresponding metrics.
Overview
Visualization
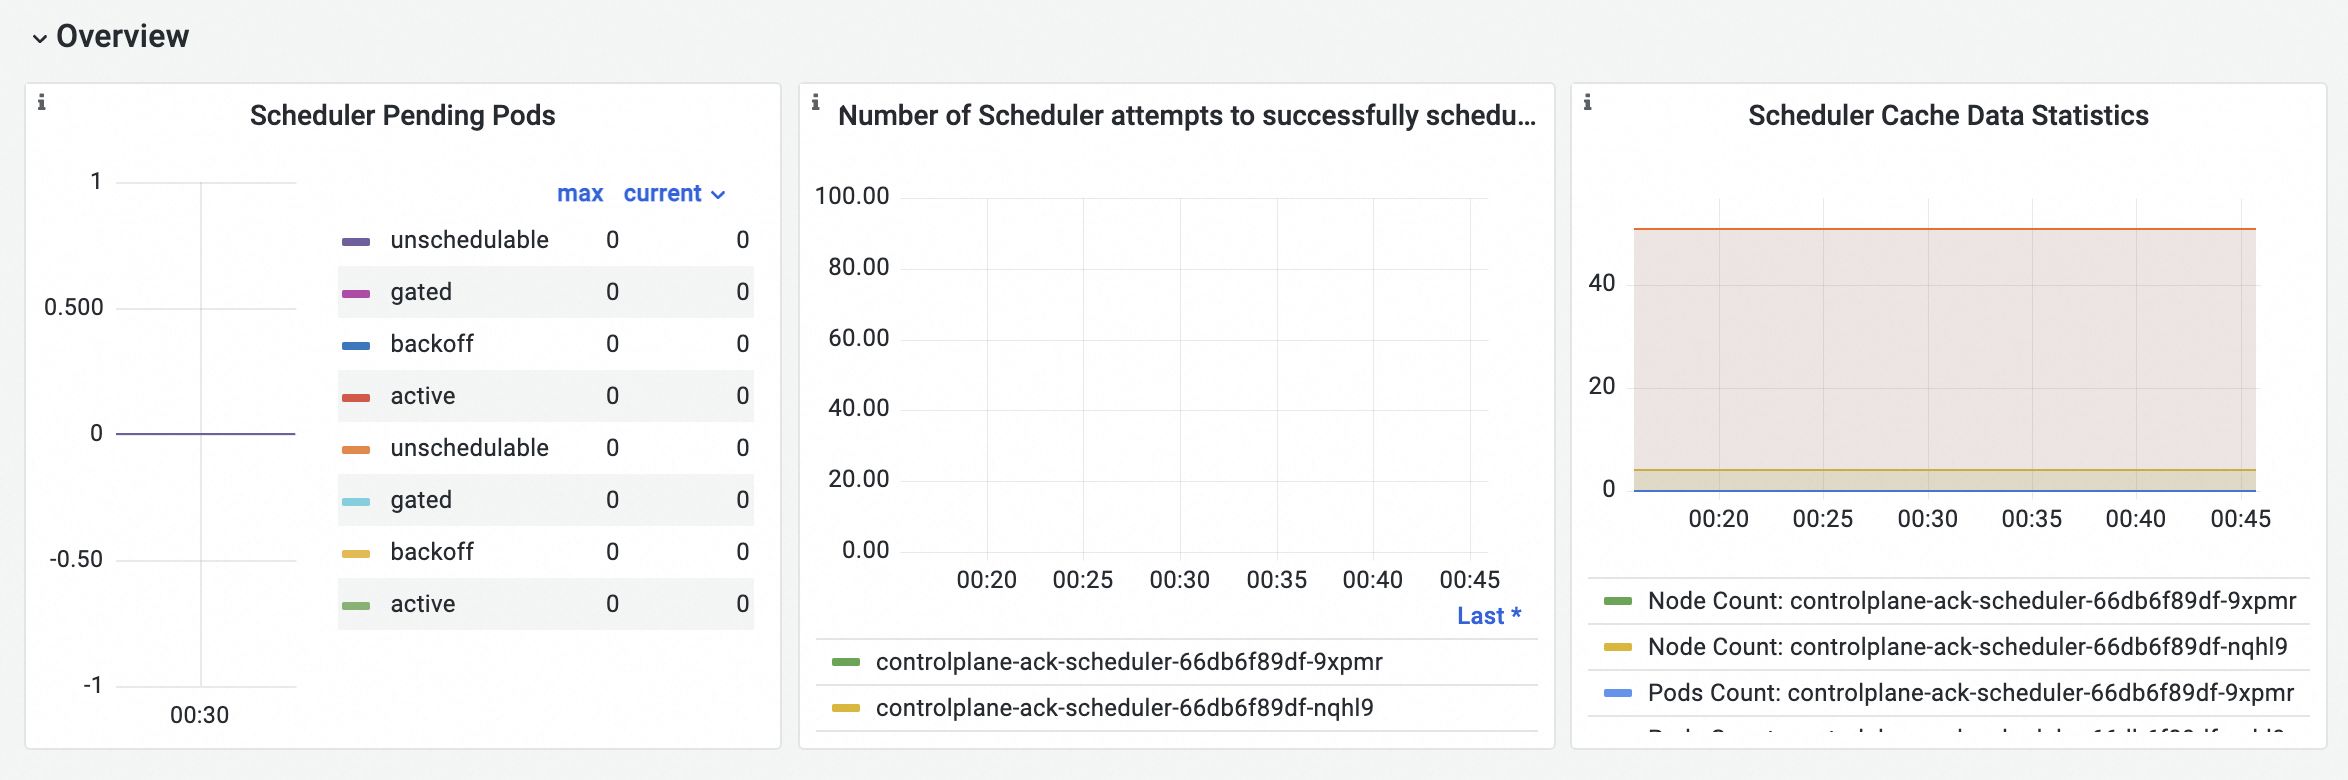
Metric details
Metric | PromQL | Description |
Scheduler pending Pods | scheduler_pending_pods{job="ack-scheduler"} | The number of pending Pods. Pods are categorized by queue type:
|
Scheduler Pod scheduling attempts | histogram_quantile($quantile, sum(rate(scheduler_pod_scheduling_attempts_bucket{job="ack-scheduler"}[$interval])) by (pod, le)) | The number of attempts required to schedule a Pod. The bucket thresholds are |
Scheduler cache statistics |
| The number of nodes, Pods, and AssumedPods in the scheduler cache. |
Resources
Visualization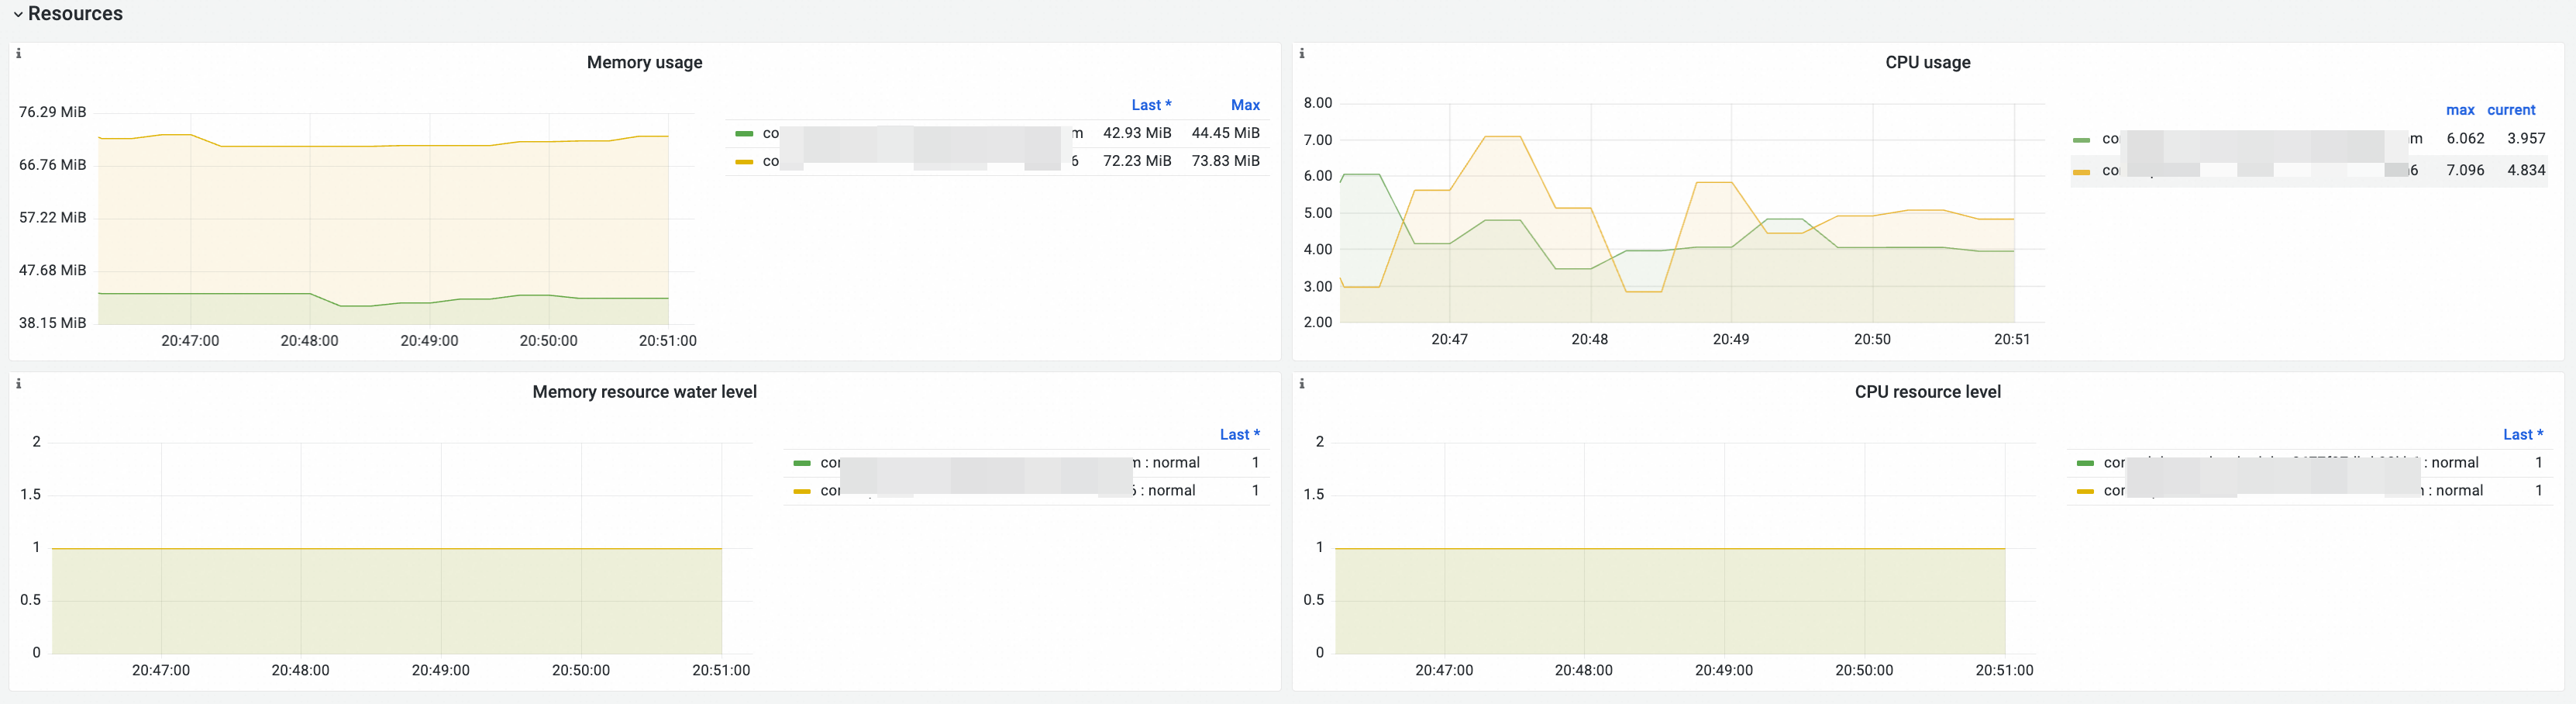
Metric details
Metric | PromQL | Description |
Memory usage | memory_utilization_byte{container="kube-scheduler"} | The memory usage, in bytes. |
CPU Usage | cpu_utilization_core{container="kube-scheduler"}*1000 | The CPU usage, in millicores. |
Memory resource utilization level |
|
|
CPU resource utilization level |
|
Kube API
Visualization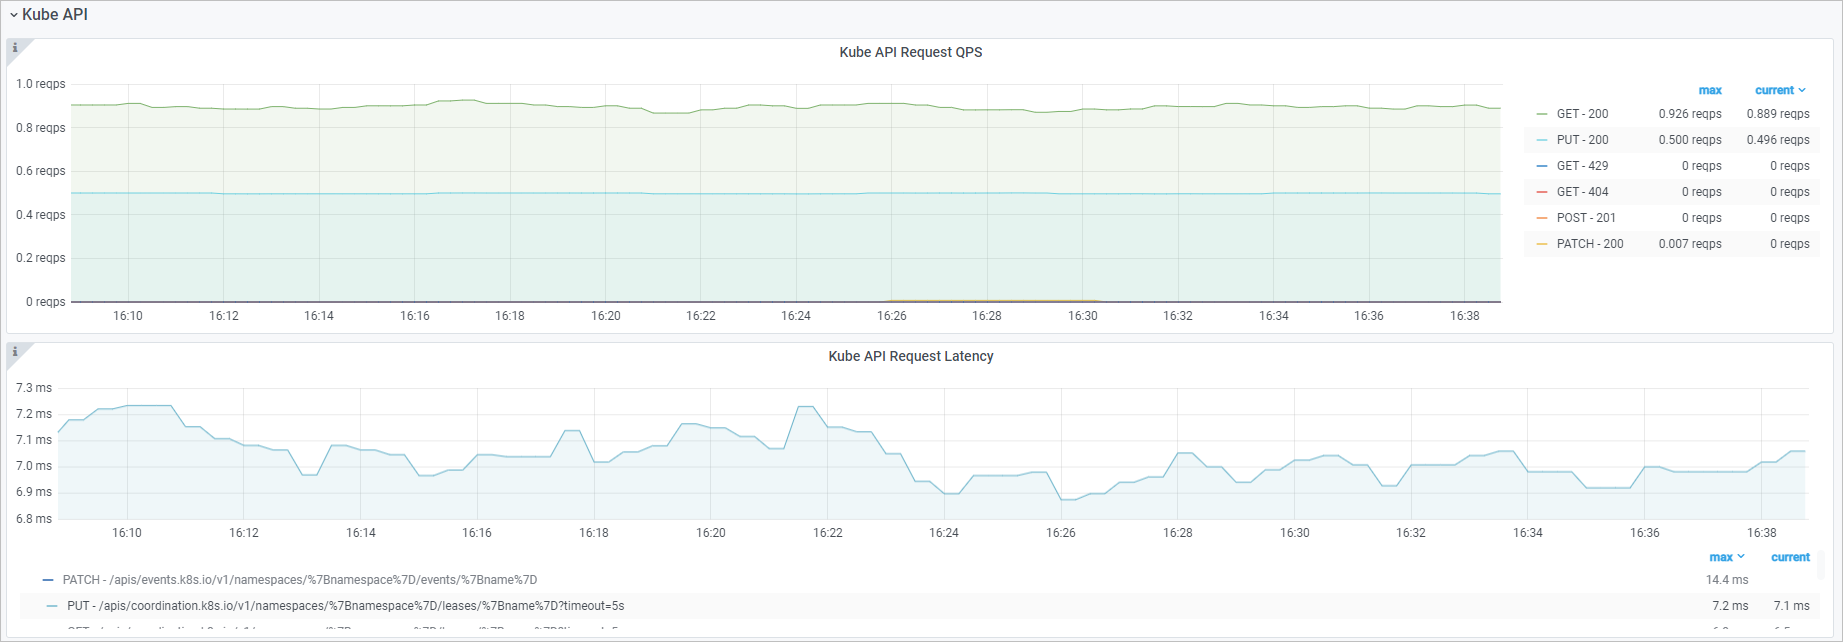
Metric details
Metric | PromQL | Description |
Kube API request QPS |
| The rate of HTTP requests from kube-scheduler to the kube-apiserver component, categorized by method and status code. |
Kube API request latency | histogram_quantile($quantile, sum(rate(rest_client_request_duration_seconds_bucket{job="ack-scheduler"}[$interval])) by (verb,url,le)) | The latency of HTTP requests from kube-scheduler to the kube-apiserver component, categorized by verb and request URL. |
Common metric anomalies
If you observe metric anomalies, use the following descriptions to check if the behavior is expected.
Number of live scheduler Pods
Normal condition | Abnormal condition | Description | Recommendation |
The number of live scheduler Pods is greater than or equal to 1. | The number of live scheduler Pods is 0. | No schedulers are available in the cluster. |
|
Number of pending Pods
Normal condition | Abnormal condition | Description | Recommendation |
The Pod scheduling rate is stable and the number of pending Pods remains low. |
| The resource requests for Pods in the cluster are inappropriate, or the node resources are insufficient. |
|
Pod scheduling attempts
Normal condition | Abnormal condition | Description | Recommendation |
A Pod is scheduled to a node after a few attempts. | A Pod still cannot be scheduled after multiple attempts. | The resource requests for Pods in the cluster are inappropriate, or the node resources are insufficient. |
|
Related topics
To learn about the metrics, dashboards, and common anomalies for other control plane components, see the following topics: Monitoring Metrics for the kube-apiserver Component, Monitoring Metrics for the etcd Component, Monitoring Metrics for the kube-controller-manager Component, and Monitoring Metrics for the cloud-controller-manager Component.