This topic describes how to configure device connectivity monitoring using PING.
Prerequisites
Procedure
Step 1: Create a metric. For more information, see Metric management.
Log on to the Cloud Managed Network console.
In the left navigation pane, choose Network Monitoring > Metric Management.
Click the Create Metric button and select Create Single-Device Metric.
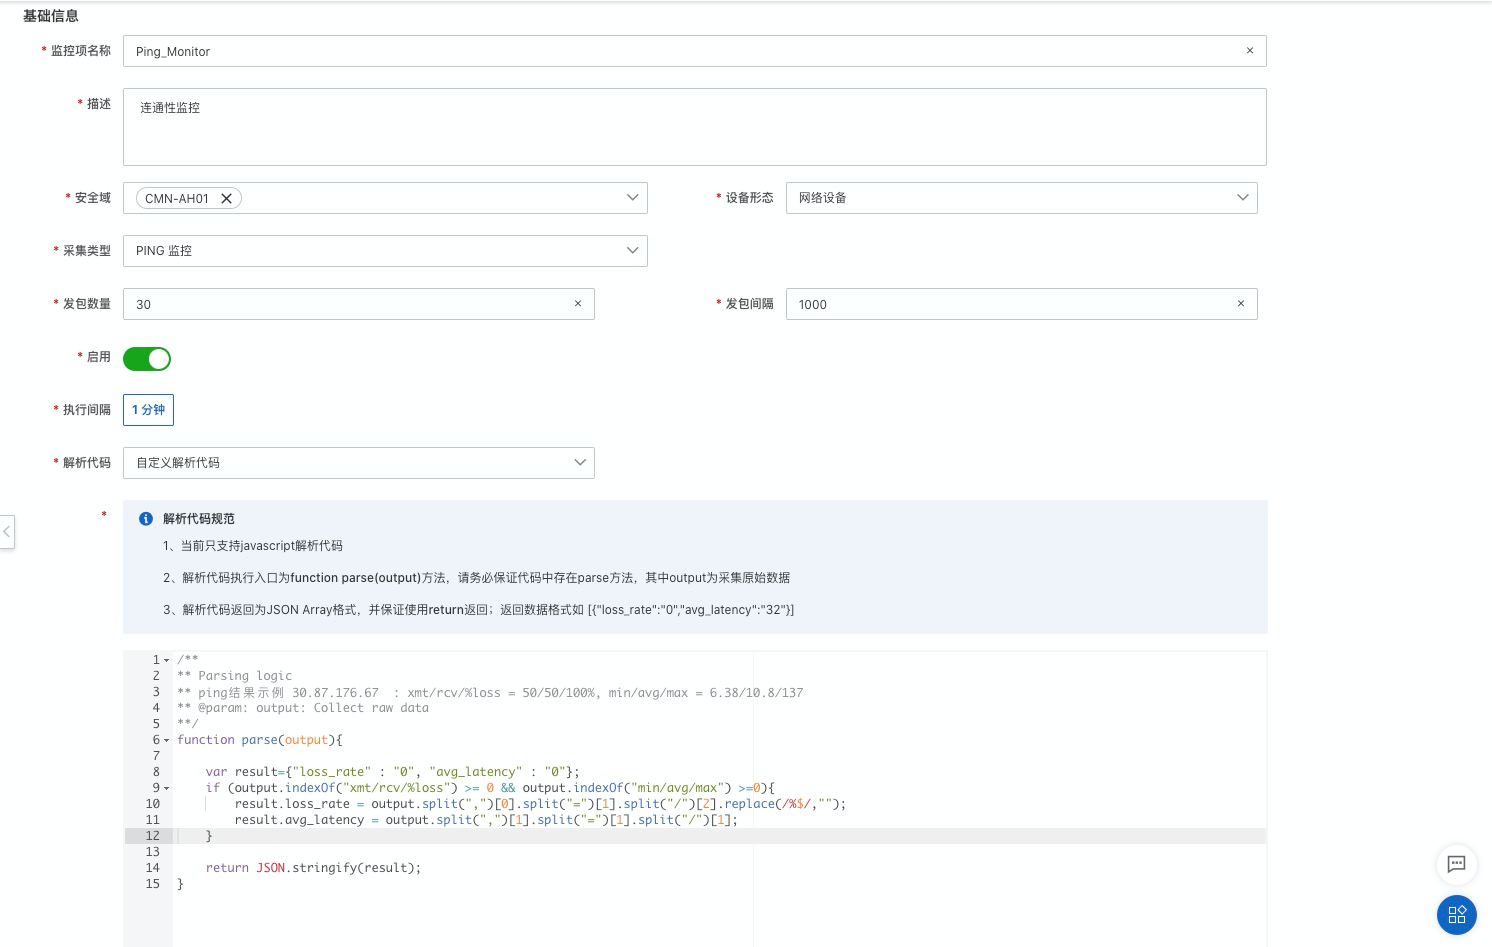
On the Create Metric page, enter the basic information for the metric, such as the metric name, description, and collection method.
Define a globally unique name for the metric, such as Ping_Monitor.
Enter a description for the metric that details its purpose to simplify future maintenance. For example, "Monitor network device connectivity and collect the latency and packet loss rate of the management IP address."
Select the security domain for the metric, such as CMN-01. Probes from the selected security domain initiate detection for devices within the same domain.
Select the device type. For example, if you select Network Device, the metric applies only to network devices within the specified security domain. You can also select IoT Device or Server.
Enter the number of packets to send and the packet interval in milliseconds (ms). The default is to send 30 packets at an interval of 1000 ms. This means that every minute, 30 PING packets are sent at an interval of 1 second each, and the PING operation lasts for 30 seconds.
Turn on the Enable switch. Data collection begins only after the metric is enabled.
From the template, select the parsing code for PING monitoring.
Optional: Add an alerting rule. For more information, see Metric management.
Click Submit to save the metric.
Step 2: Deploy the metric. For more information, see Deploy a metric.
In the left navigation pane, choose Network Monitoring > Deploy Metric.
From the drop-down list, select the Ping_Monitor metric that you created in Step 1. You can perform a fuzzy search by metric name.
The system automatically displays a list of manufacturers and models. Select the check boxes for the models to which the metric applies. For example, to monitor H3C devices with the models WX5004 and S5120, select the check boxes for both models.
Click Submit to save the deployment configuration. The system then sends the configuration to the probes to start data collection.
After you deploy the metric, the system automatically sends the configuration to the corresponding probes to start data collection. This process may take several minutes. After the configuration is applied, you can view the collected data and alerts in the Alert Status view.
Step 3: View the alert status. For more information, see Alert Status view.
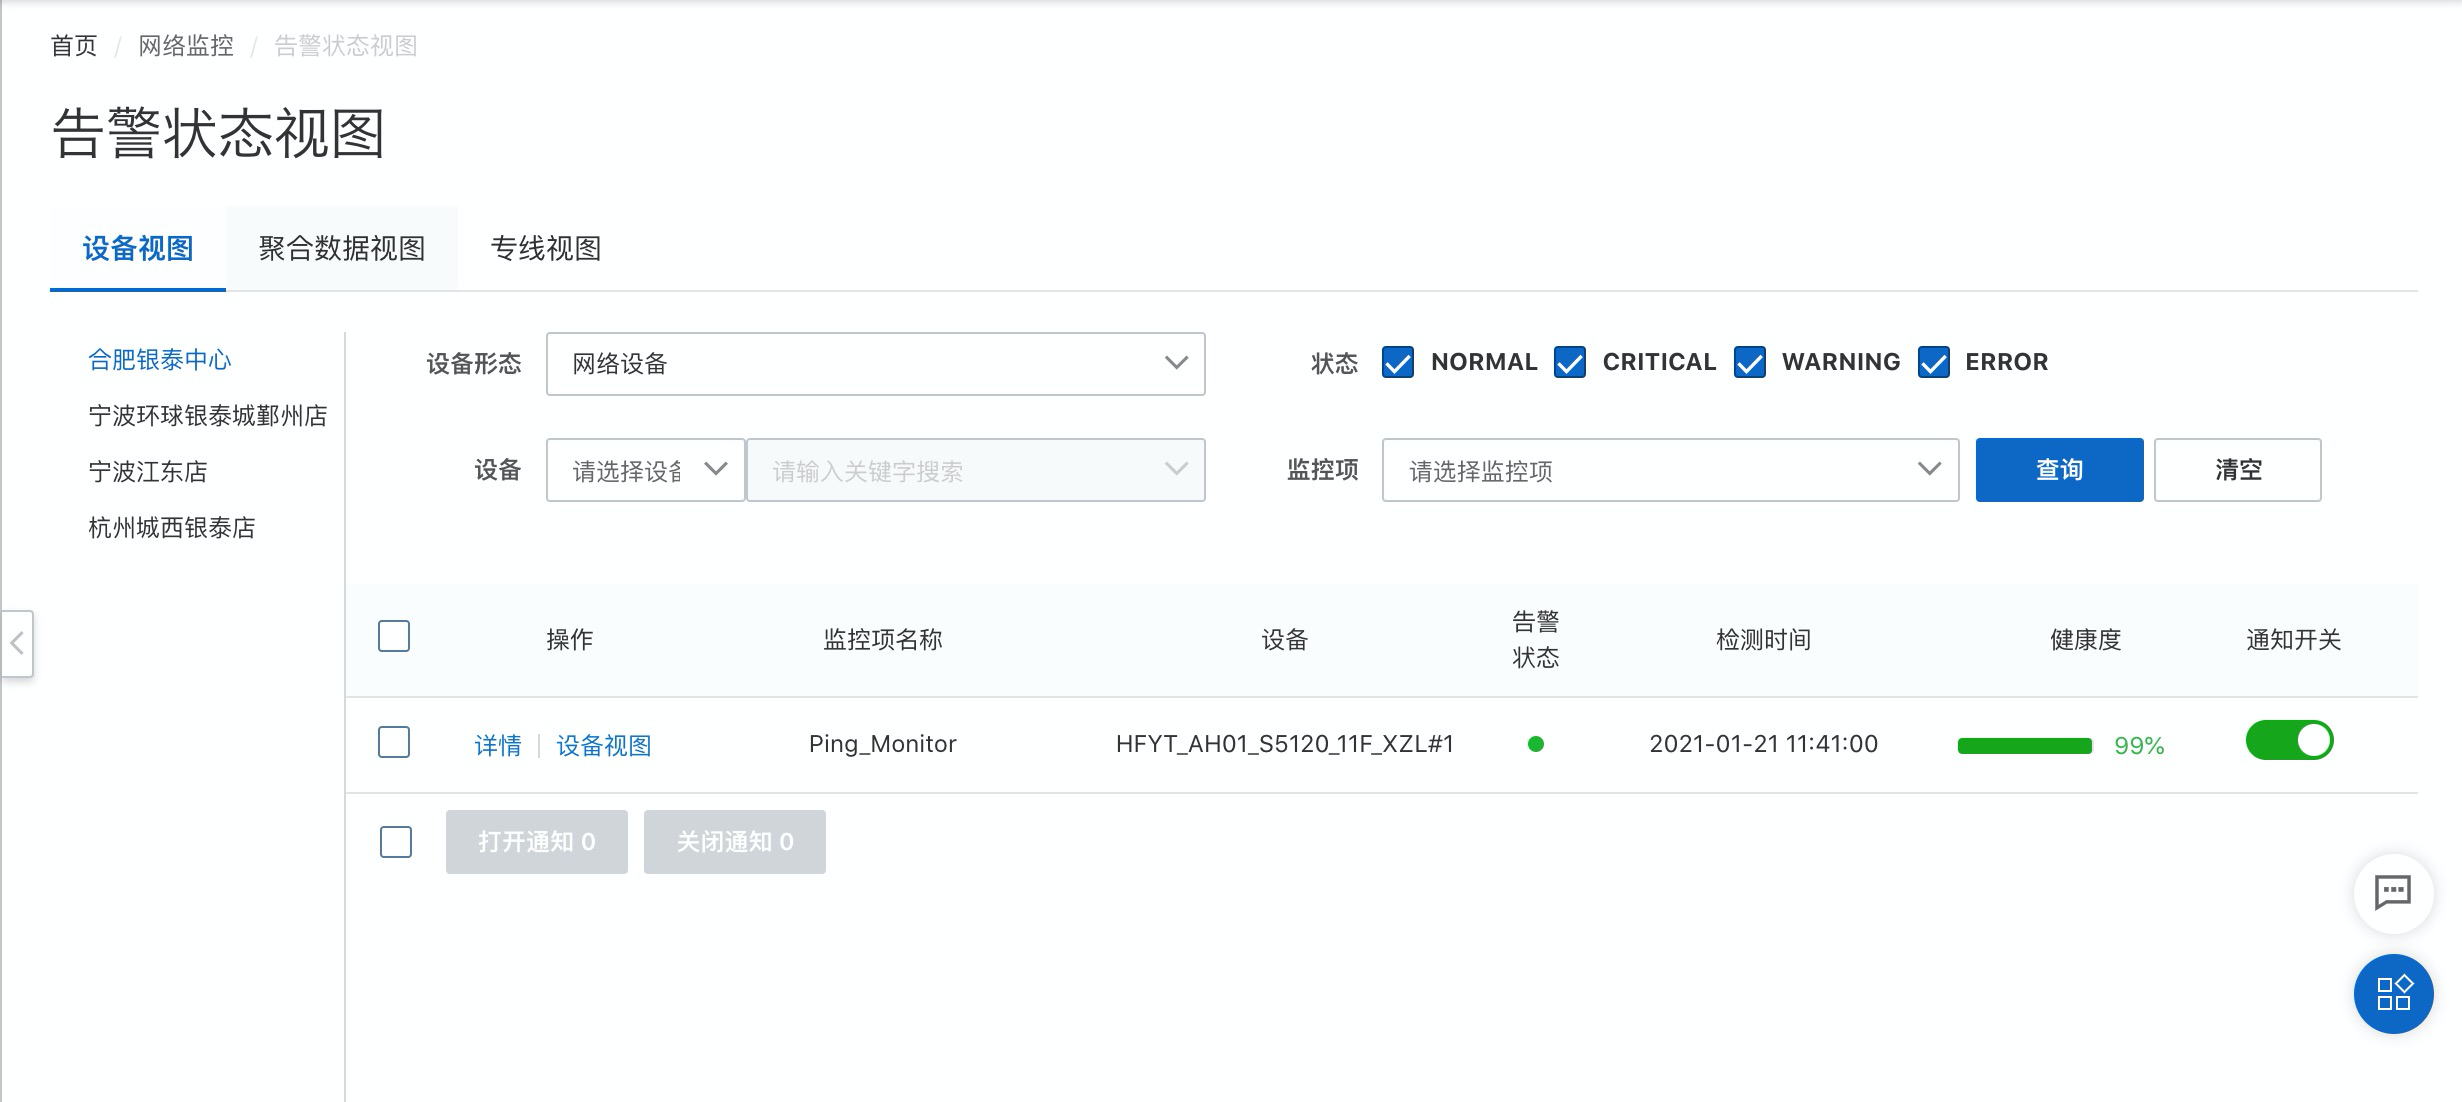
In the left navigation pane, choose Network Monitoring > Alert Status View.
In the left-side pane, select a physical space. The status of all metrics and devices in that physical space is displayed. To view the status of a specific device or metric, enter your search criteria in the search box and click Query.
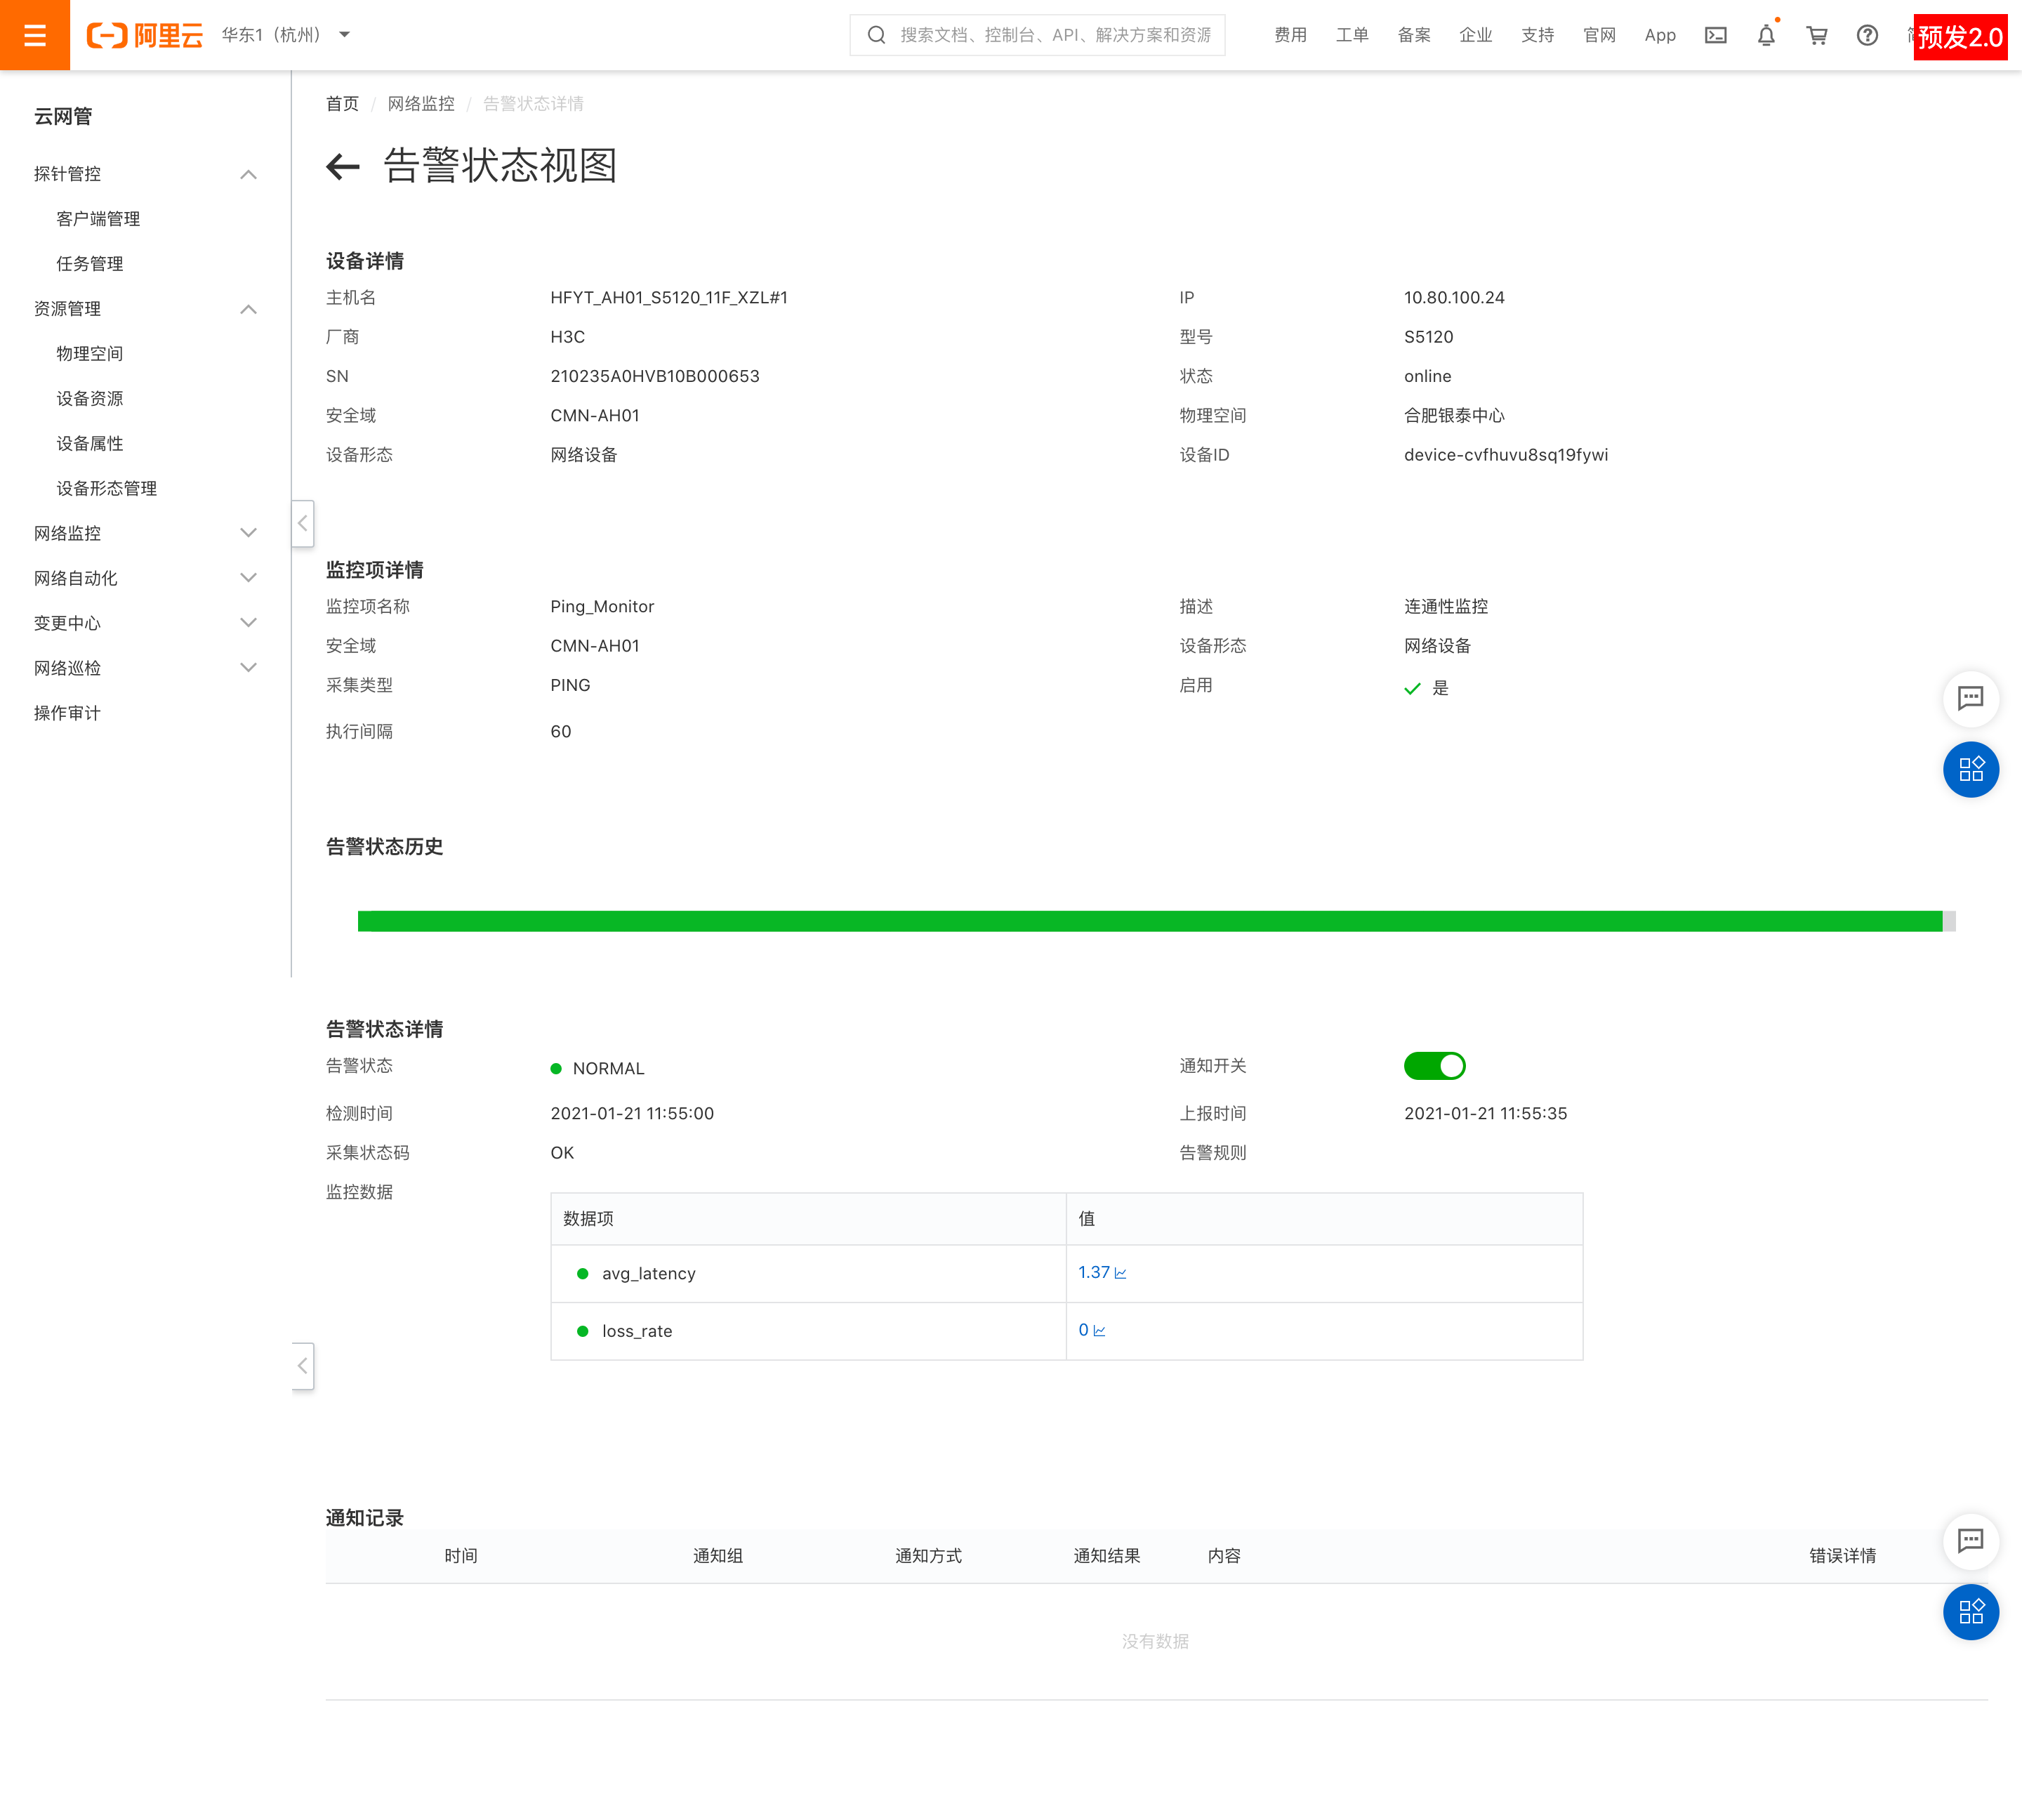
Click Details to view more information.
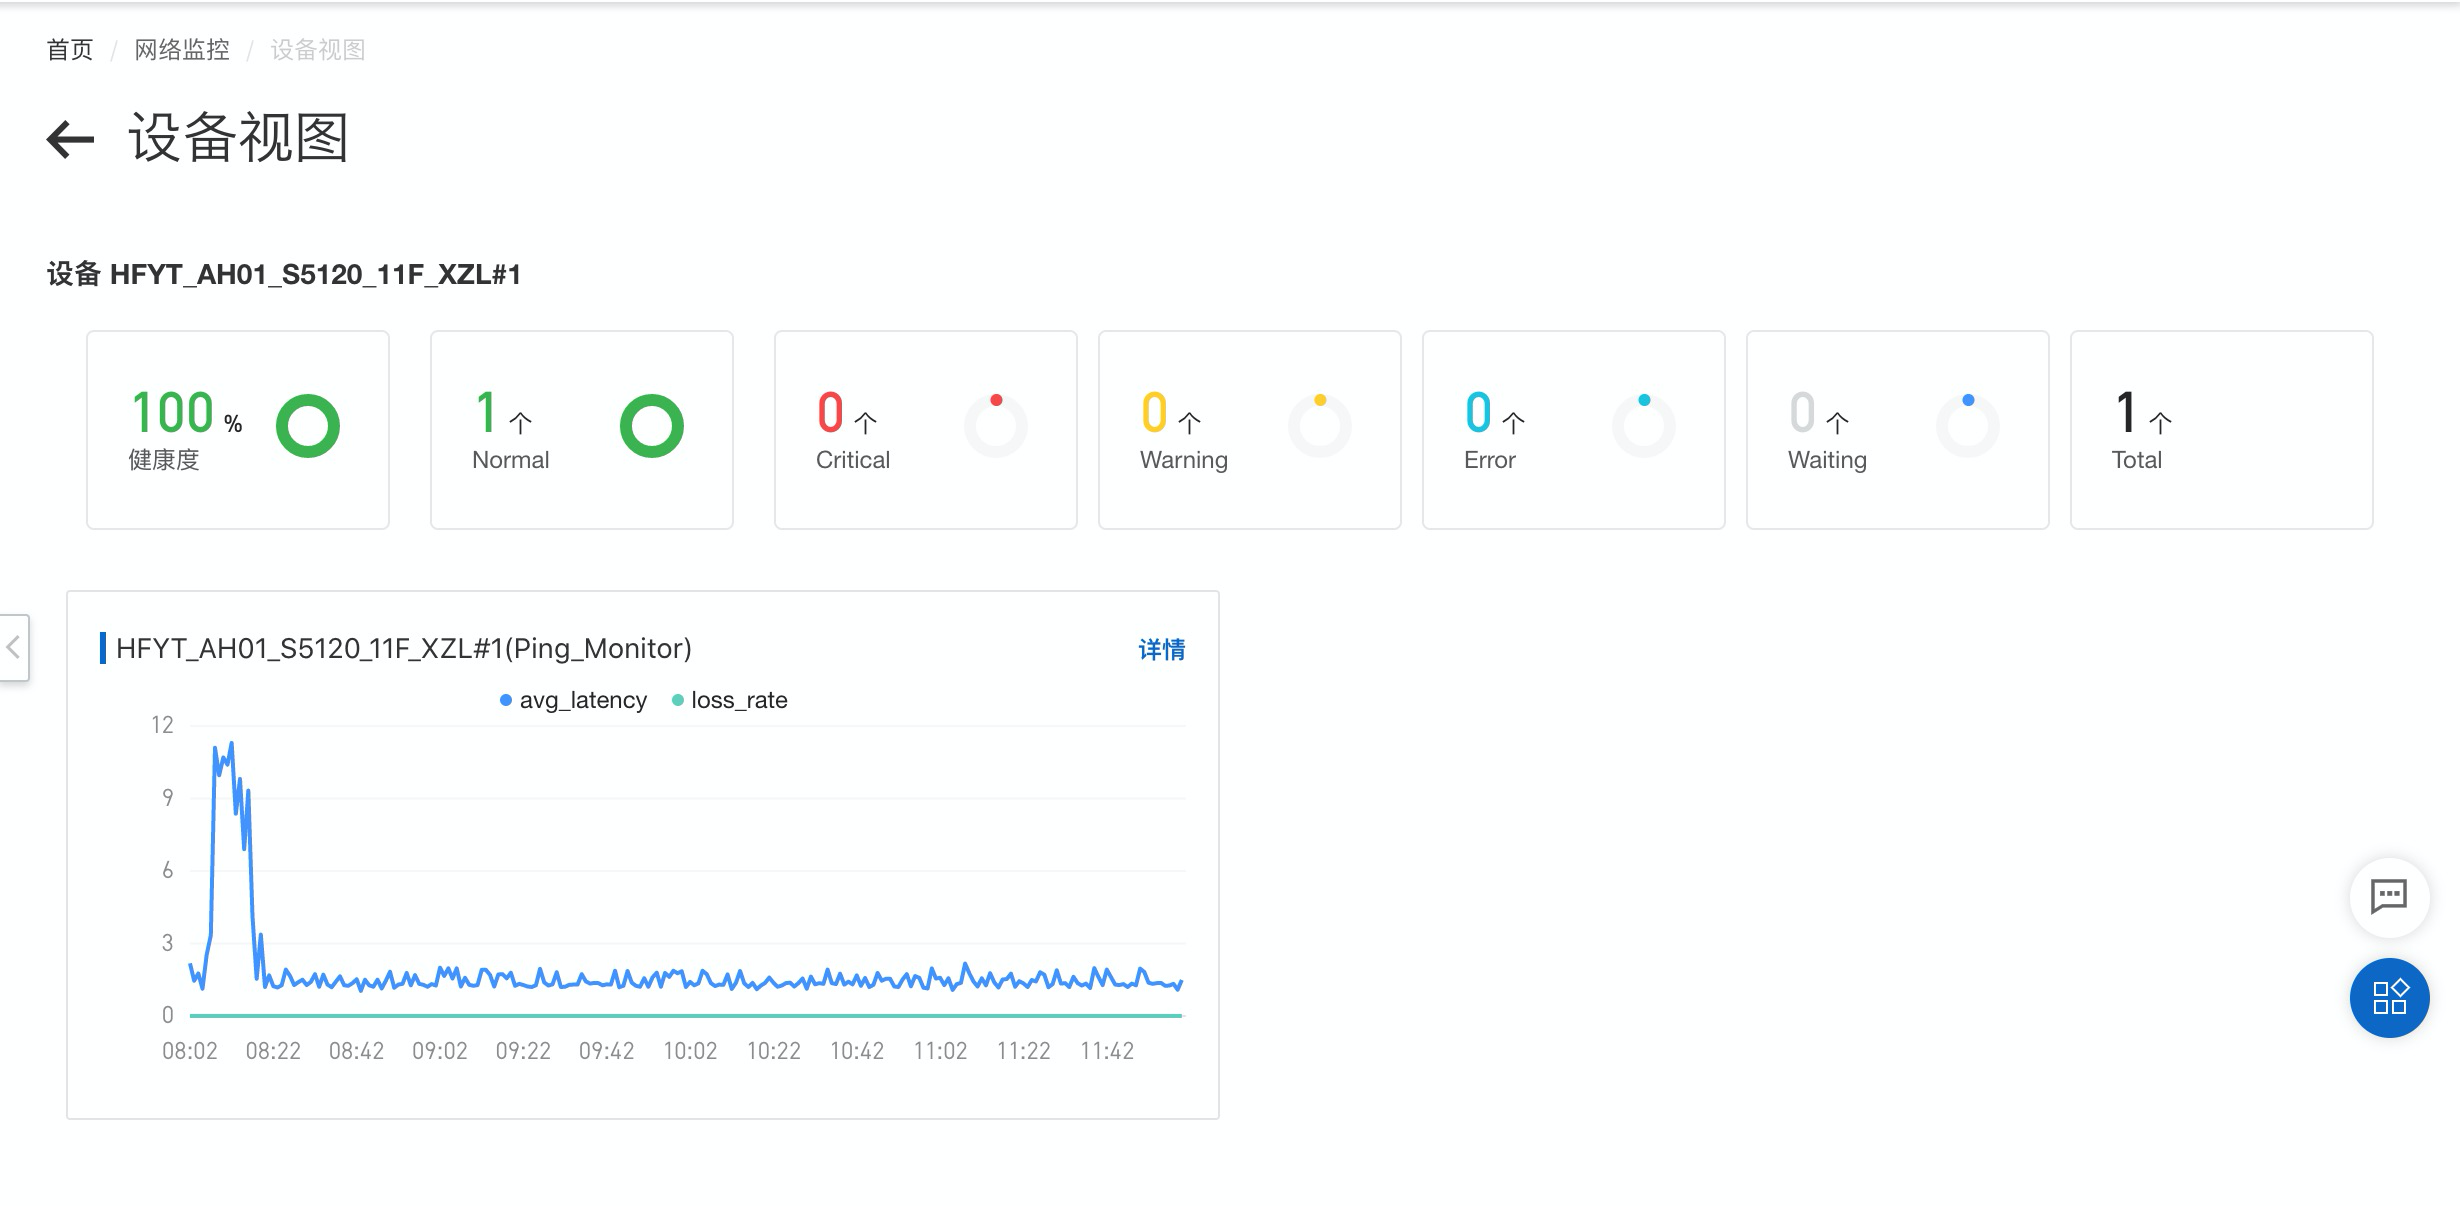
Click Device View to open the device view. This view displays all monitoring data and historical trends for the device.