Administration effect
The Administration effect module enables you to analyze the impact of administrative actions, assess the current state of administration, and drive optimization efforts. This topic outlines the process for accessing overall administration effect indicators, trend analysis, and project administration details.
Administration effect page introduction
Navigate to the Dataphin home page, select Administration > Resource Administration from the top menu bar.
In the left-side navigation pane, choose Administration Overview > Administration Effect to access the Administration Effect page.
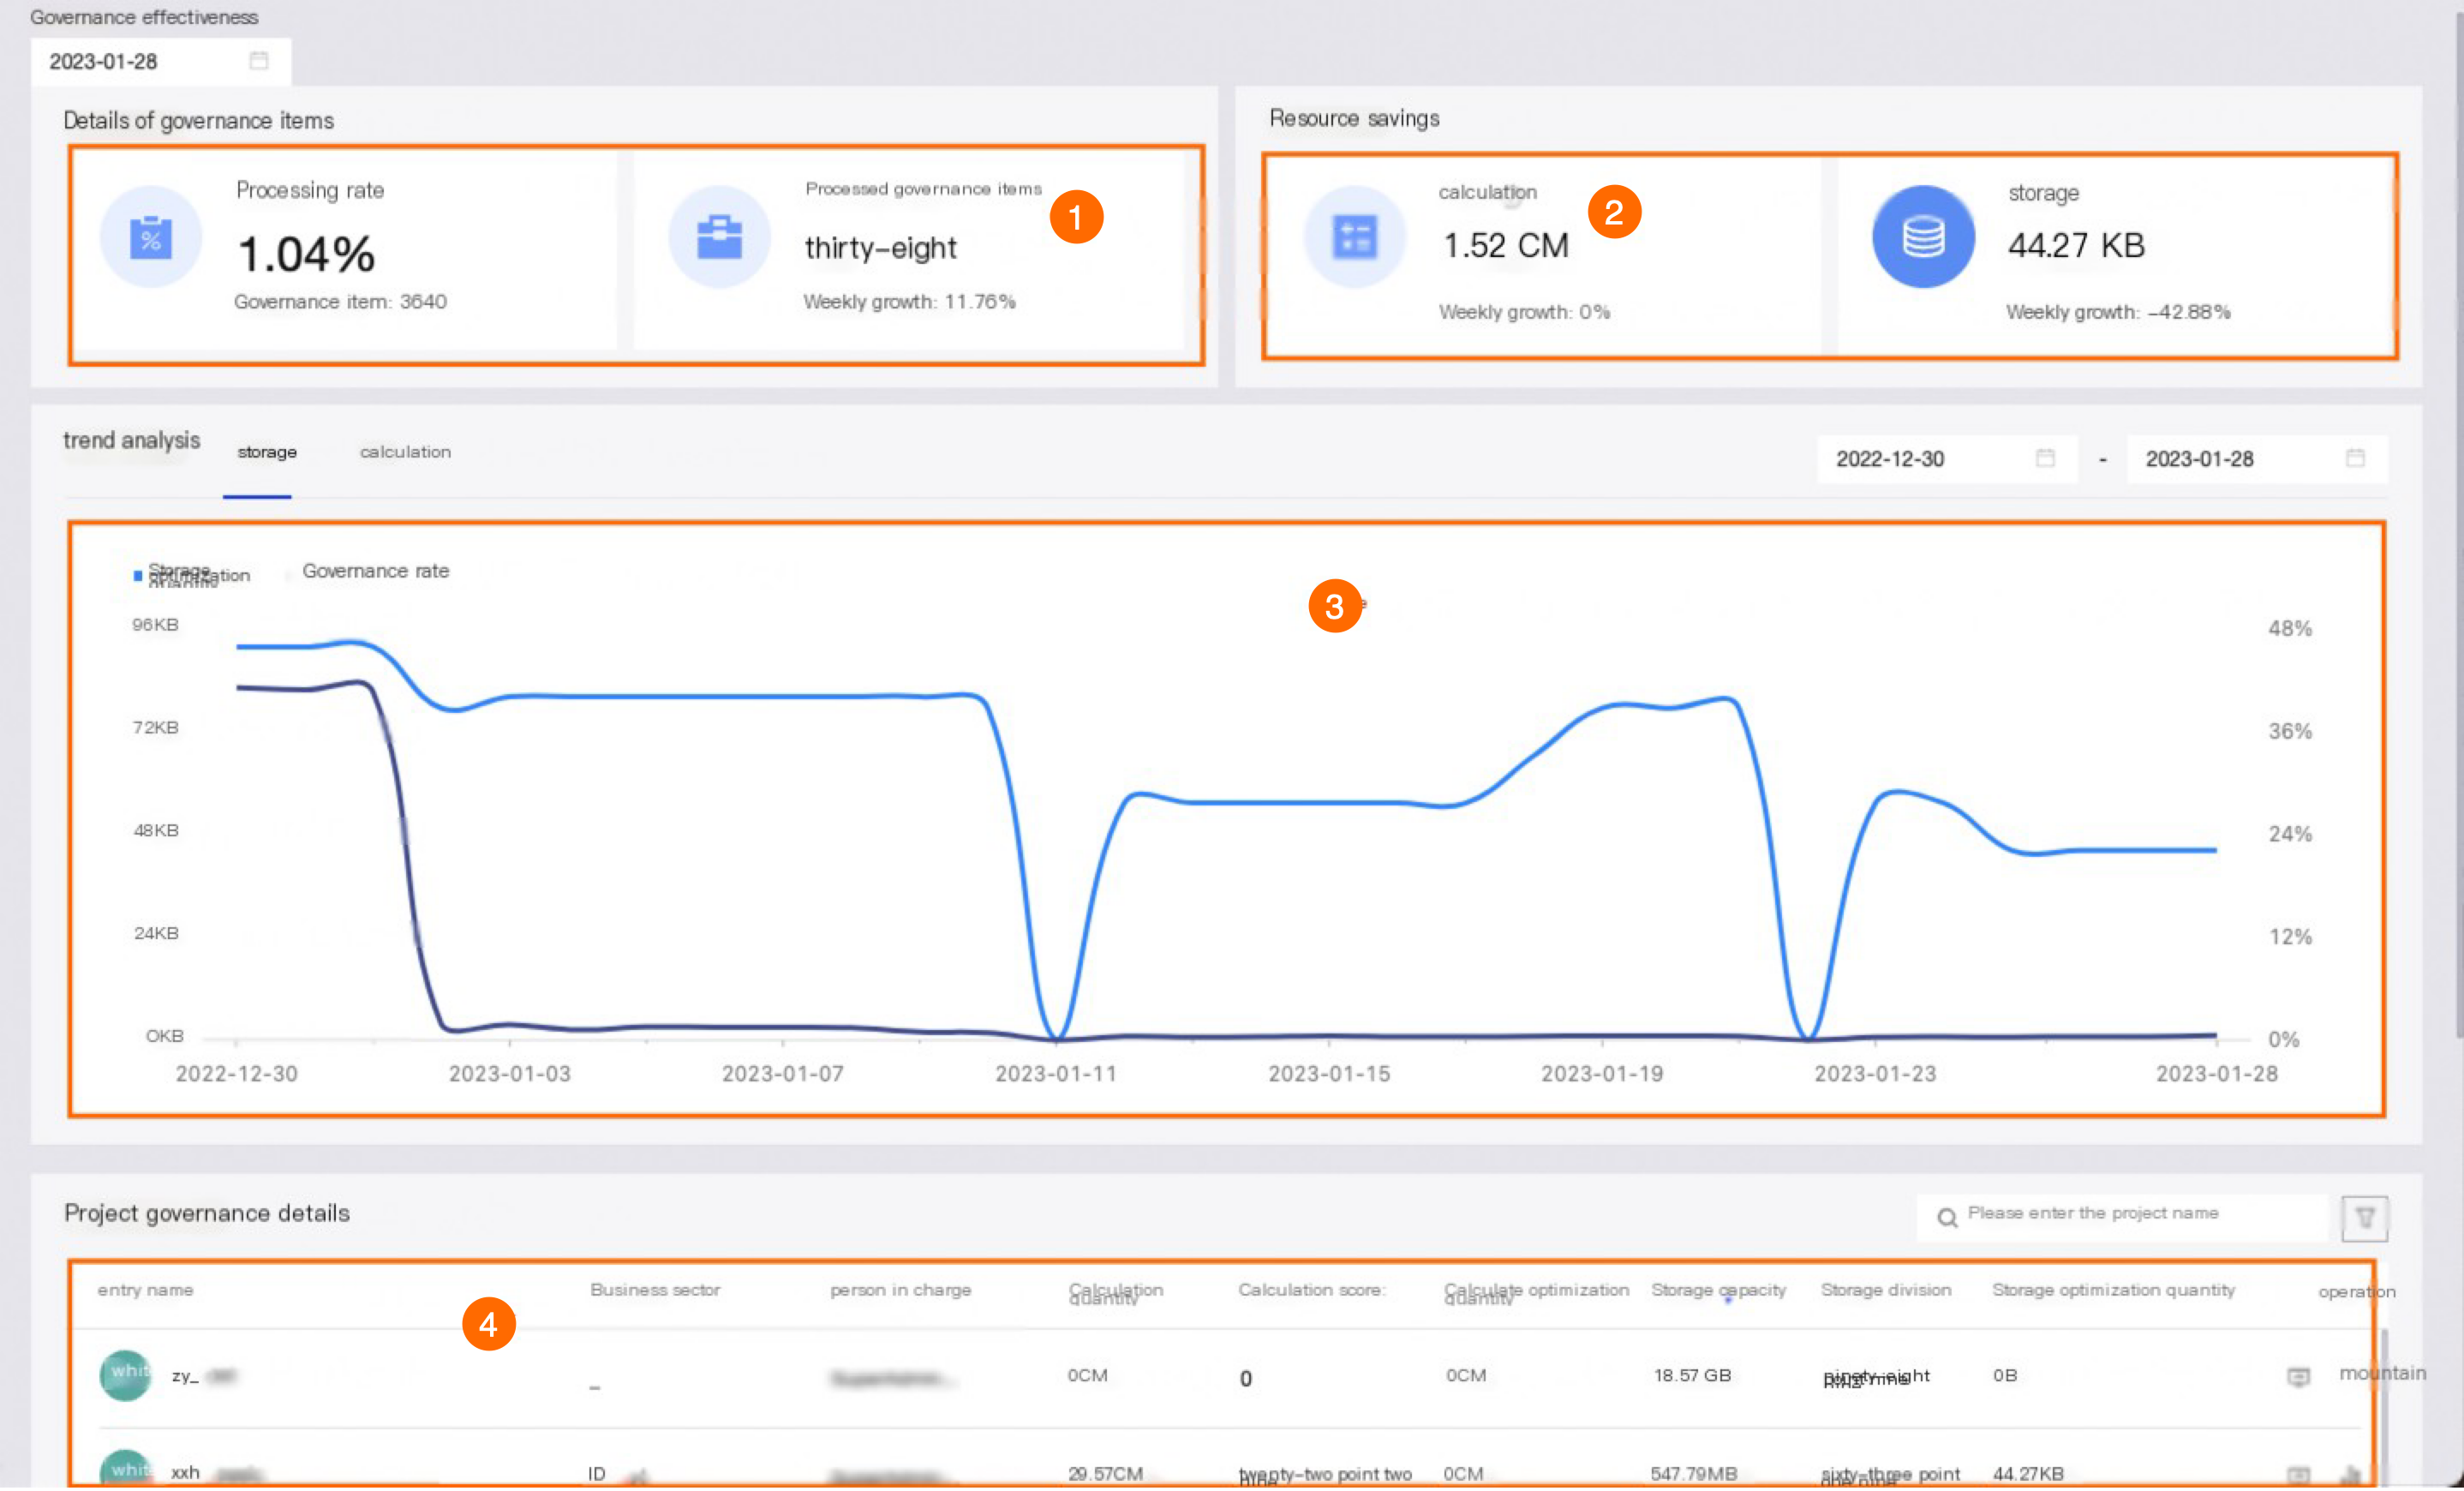
At the top left corner of the Administration Effect page, select the desired date to display business data. The Administration Effect page features sections for Administration Item Details (Figure ①), Resource Savings (Figure ②), Trend Analysis (Figure ③), and Project Administration Details (Figure ④).
Overall effect indicators
Overall effect indicators comprise Administration Item Details and Resource Savings. The Administration Item Details include Processing Rate and Processed Administration Items, while Resource Savings are broken down into Compute and Storage savings. The following details provide further explanation:
Processing Rate: Represents the proportion of administration items processed in the past week relative to the total number of administration items.
Processed Administration Items: The count of administration items processed over the last seven days.
Compute: The volume of compute resources conserved by managing administration items within the compute realm.
Storage: The volume of storage resources conserved by managing administration items within the storage realm.
Trend analysis
Trend analysis provides a global perspective on the data trends for Storage and Compute over a selected period. This includes trends for Storage Optimization Amount and Administration Rate, as well as Compute Optimization Amount and Administration Rate.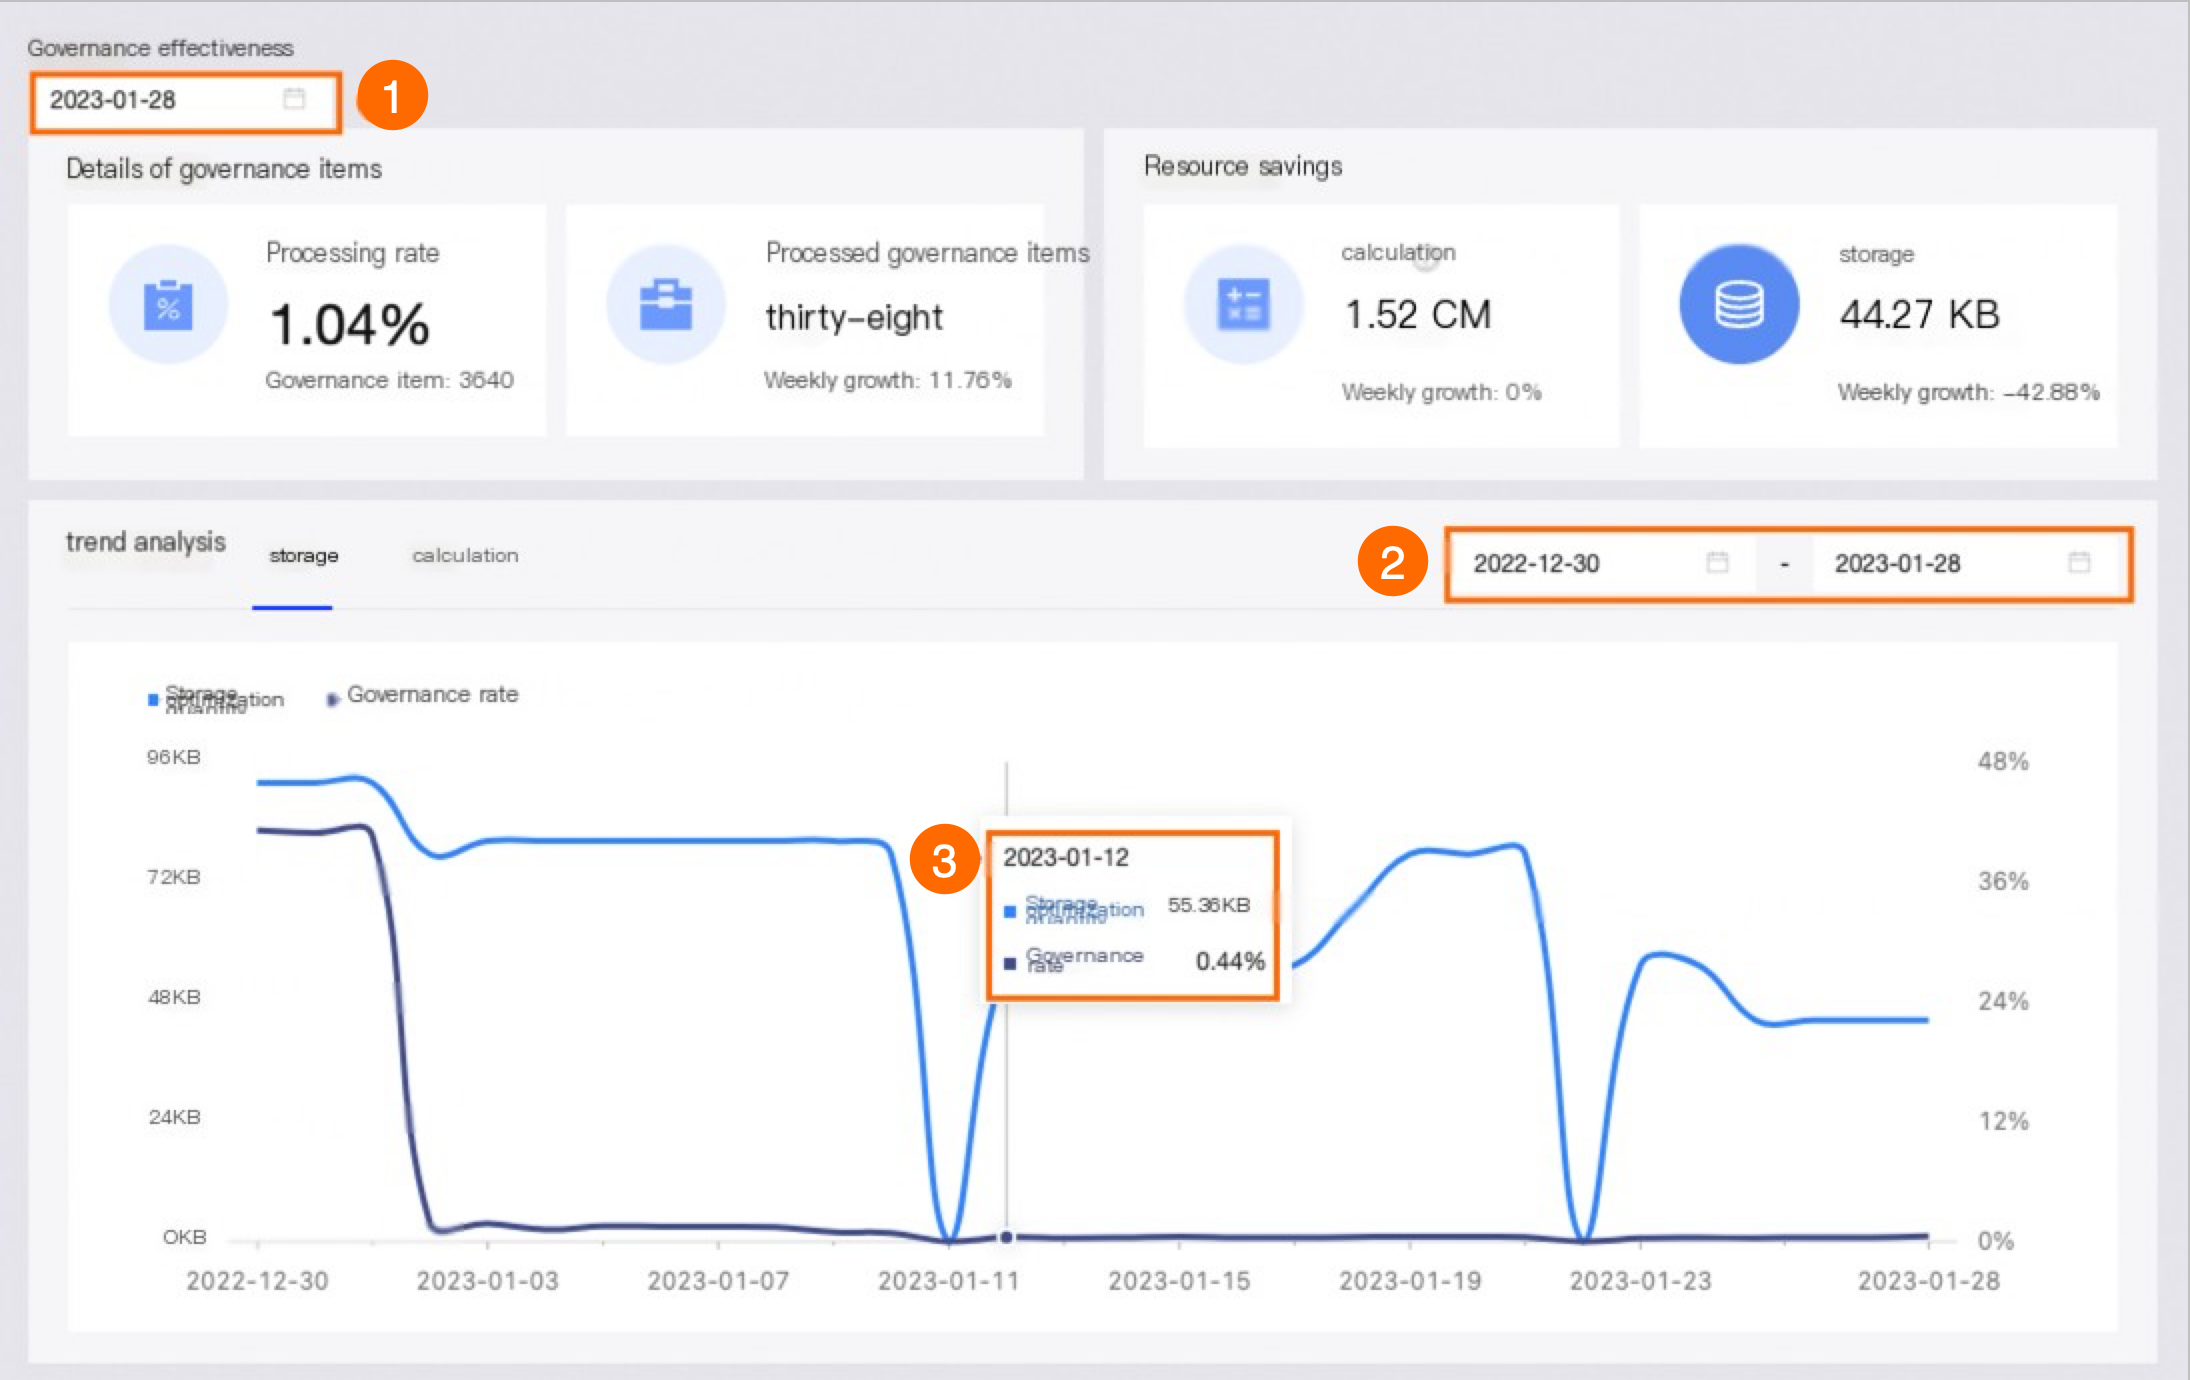
By default, trend analysis displays global data trends for the past 30 days, based on the date selected in Figure ①.
Select Trend Analysis followed by Storage to view the default data trends of Storage Optimization Amount and Administration Rate for the last 30 days.
Hovering over a specific date reveals the Storage Optimization Amount for the preceding seven days and the Administration Rate for that date. For instance, as depicted in Figure ③, the Storage Optimization Amount for the seven days leading up to January 12, 2023, is 55.36KB, and the Administration Rate on January 12, 2023, is 0.44%.
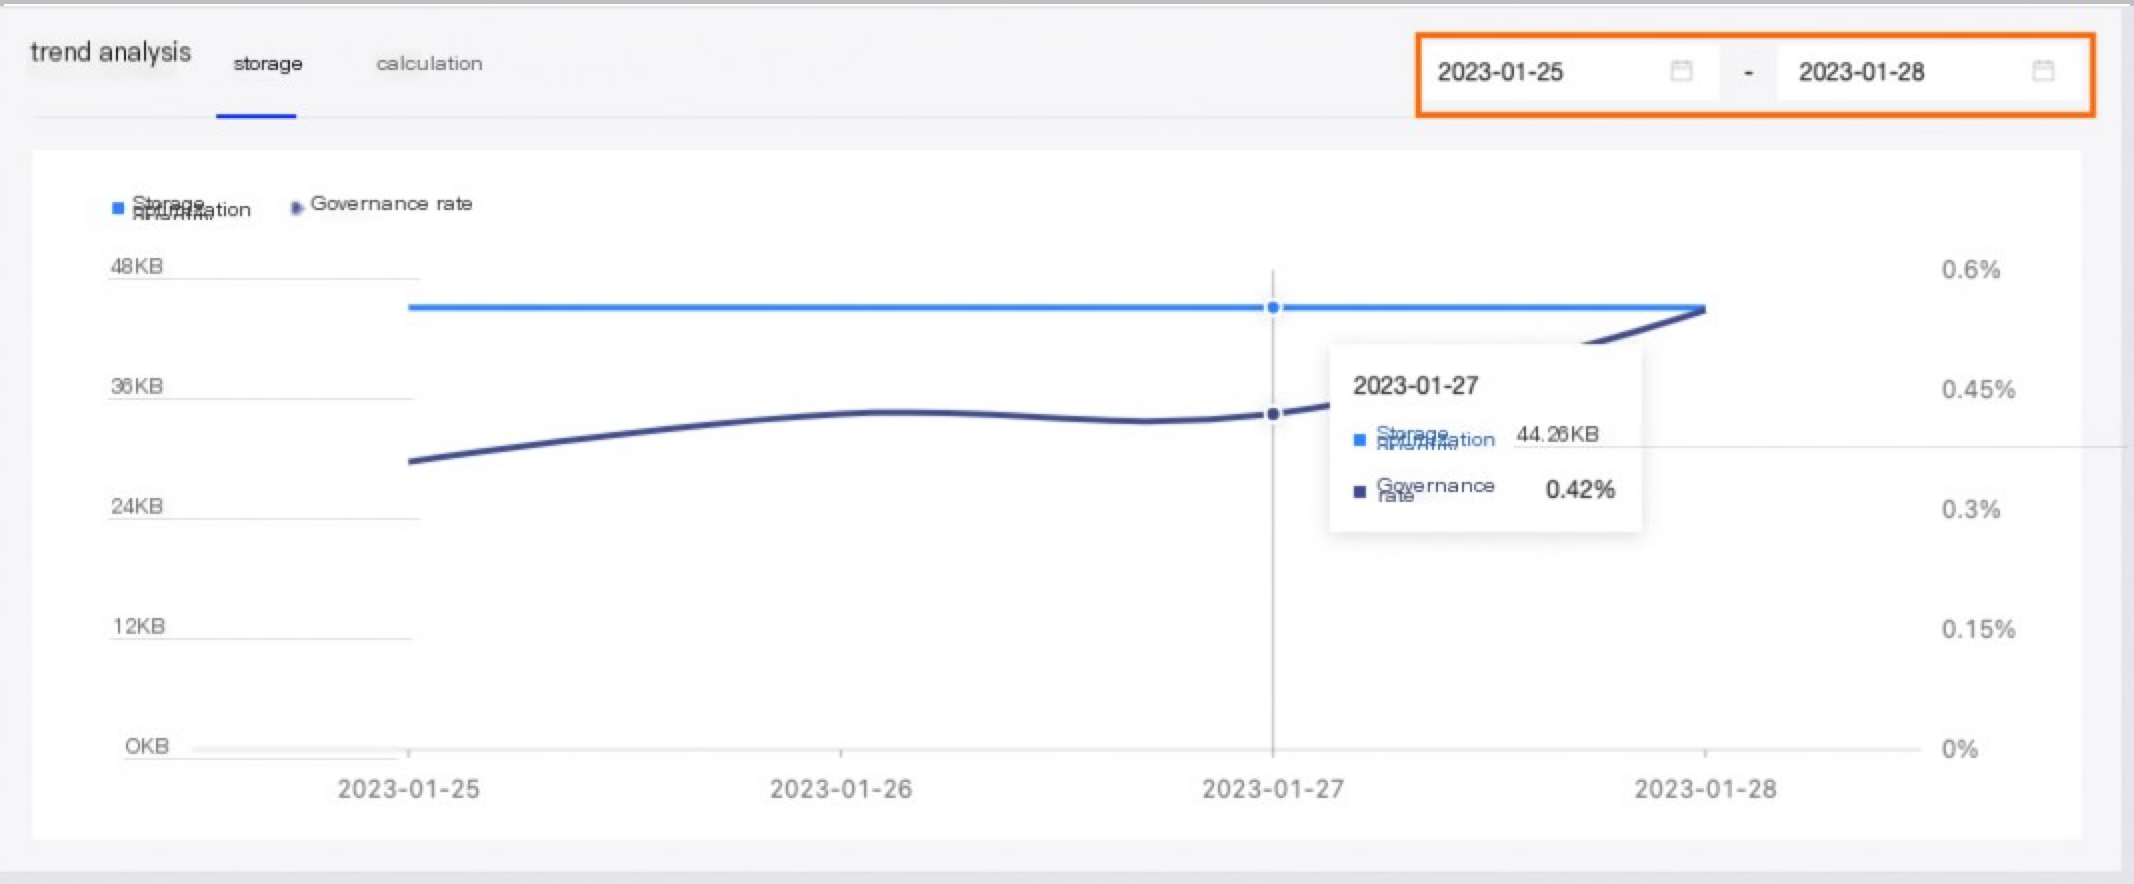
To align with business requirements, you can choose a specific date range in Figure ② to examine the data trends for Storage Optimization Amount and Administration Rate during that timeframe. For instance, the graph below illustrates the trends for Storage Optimization Amount and Administration Rate from January 25, 2023, to January 28, 2023. Hovering over the graph reveals that the Administration Rate was 0.42% on January 27, 2023, and the Storage Optimization Amount for the preceding 7 days, as of January 27, 2023, amounted to 44.26KB.
Select the Trend Analysis tab for Compute to view the default data trends of Compute Optimization Amount and Administration Rate for the past 30 days.
NoteThe data presentation and significance are consistent with those on the Storage page.
Project administration details
The Project Administration Details module, by default, displays information such as Project Name, Business Segment, Owner, Compute Amount, Compute Score, Compute Optimization Amount, Storage Size, Storage Score, and Storage Optimization Amount for all projects, categorized by project and business segment dimensions.
To quickly filter projects, enter keywords related to the project name in the search box. Alternatively, select the ![]() icon to filter projects by Environment, Business Segment, and Owner, and view specific project administration details.
icon to filter projects by Environment, Business Segment, and Owner, and view specific project administration details.
Parameter | Description |
Project Name | The designated name of the project. |
Business Segment | The Business Segment associated with the project. |
Owner | The Owner of the project. |
Storage Size | The total storage resources utilized by all tables within the project. |
Storage Score | The score reflecting the health of storage resources at the project level. |
Compute Amount | The compute resources expended on executing MaxCompute tasks, including both developer-written SQL tasks and those automatically generated by the intelligent compute engine, within the project. |
Compute Score | The score indicating the health of compute resources at the project level. |
Storage Optimization Amount | The quantity of storage resources conserved as a result of effective administration of storage items at the project level. |
Compute Optimization Amount | The quantity of compute resources conserved through the effective administration of compute items at the project level. |
Actions | The Actions section provides options to view data trends and health score rankings:
|