View exception statistics
Exception statistics show abnormal tasks at the global or project level from two perspectives: running errors and prolonged execution times. Use these statistics to monitor task health and make informed decisions on budgeting, resource scaling, and specification upgrades.
Statistics explanation
The exception statistics feature aggregates data from production environment instances.
Exception statistics entry
-
On the Dataphin home page, single click the top menu bar's Development. By default, you will be directed to the data Development page.
-
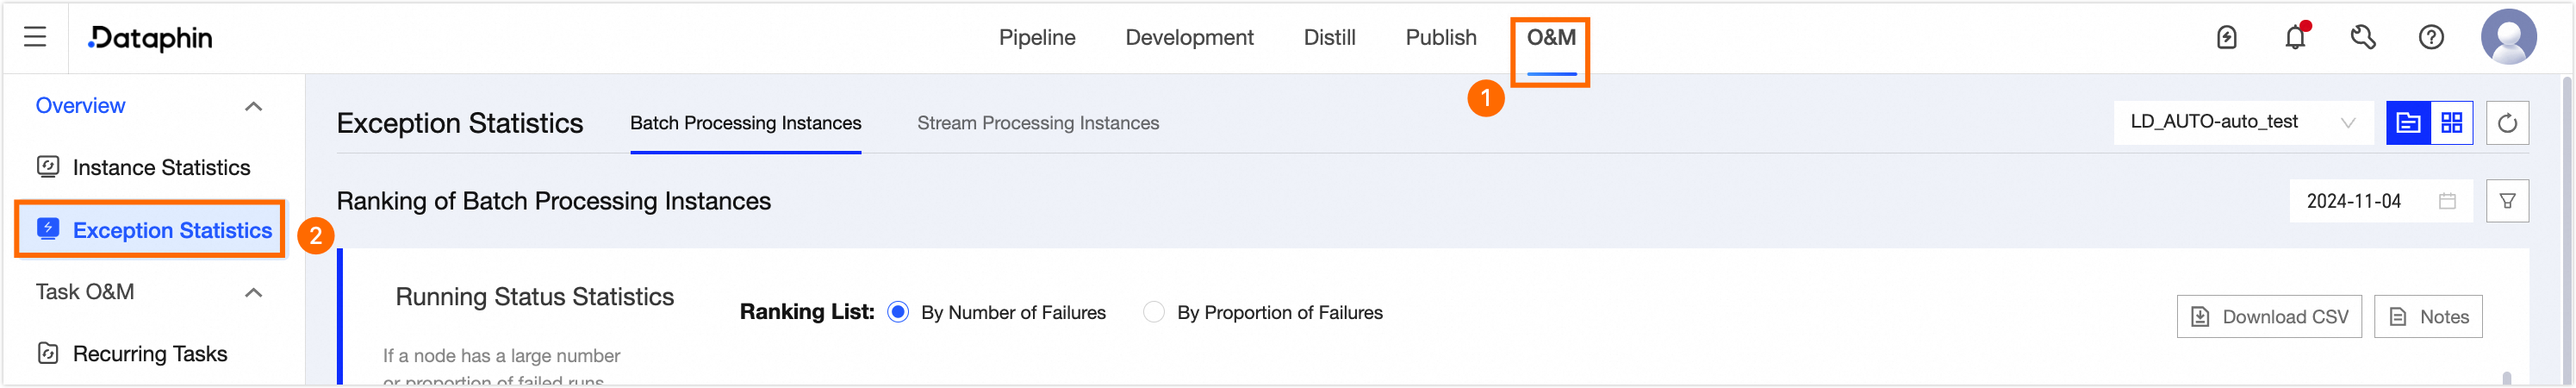
To access the Exception Statistics page, follow these steps:
Single click Operation -> Exception statistics.
Exception statistics page introduction
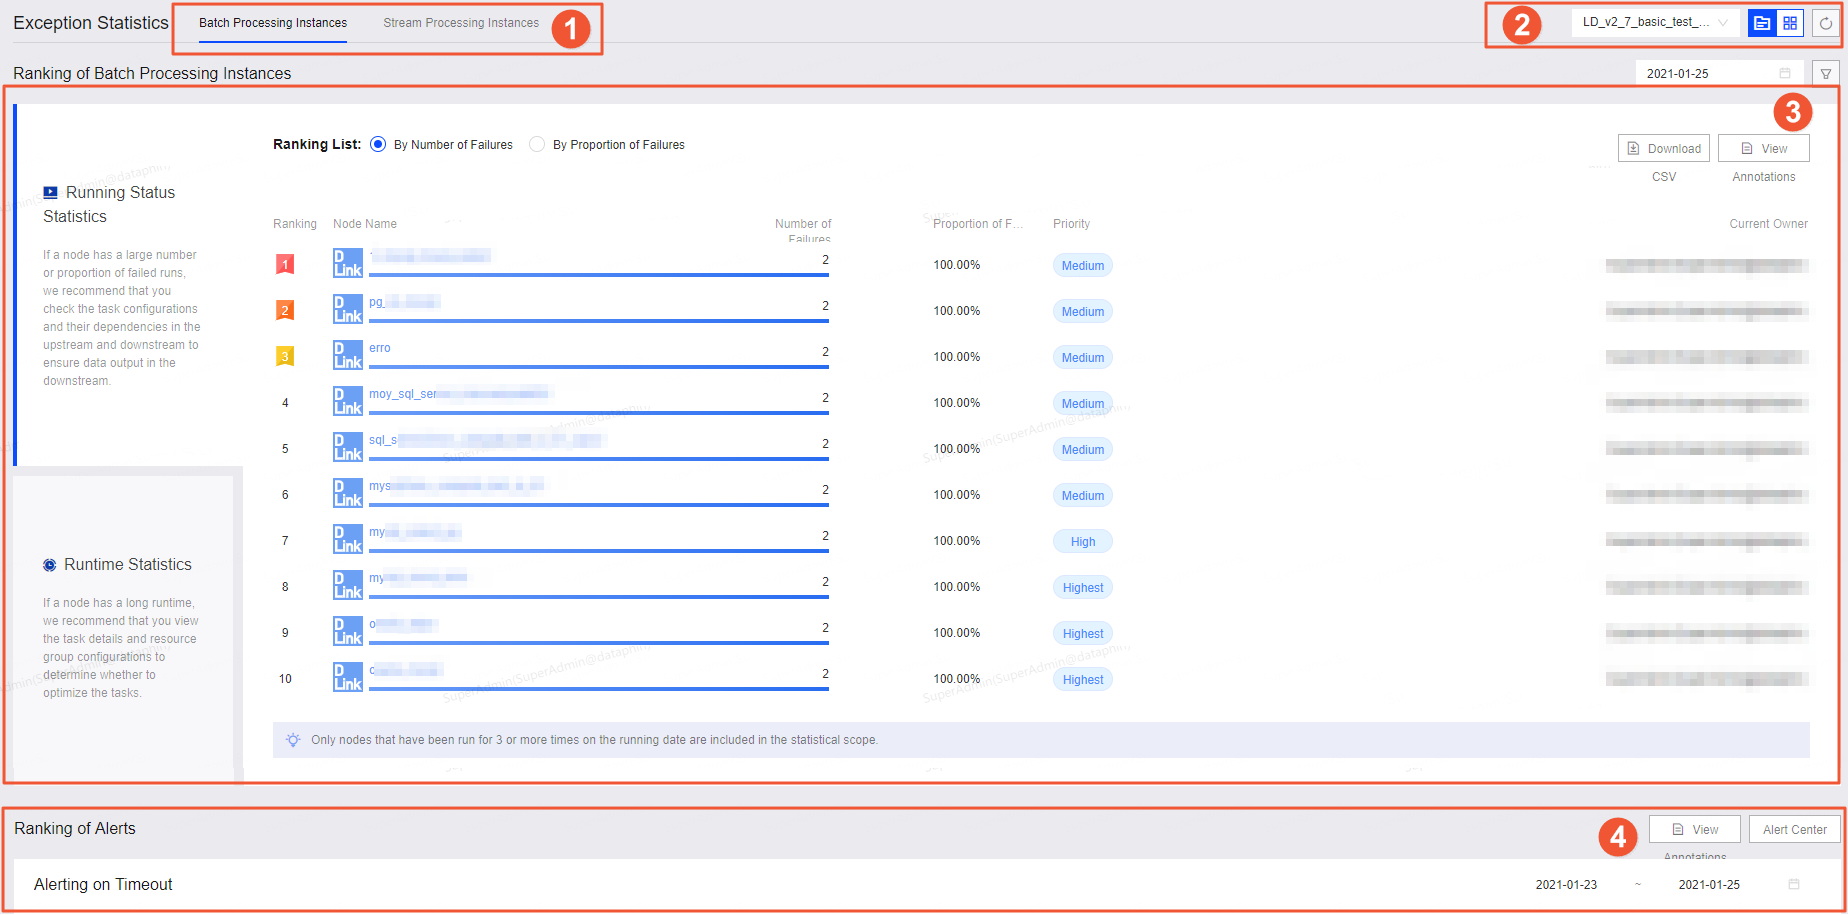
The exception statistics page displays abnormal data for offline and real-time instances.
|
Number |
Description |
|
①Instance tabs |
Toggle between Offline Instances and Real-time Instances tabs to view the rankings of abnormal operations for both types of instances. |
|
②Global perspective and project perspective |
View exception statistics from both global and project perspectives. The default is the project perspective, which shows operations within a specific project. You can select different projects to view their statistics. To switch to a global overview at the tenant level, click the
|
|
③Exception data ranking |
View the rankings of abnormal data for both offline and real-time instances:
|
|
④Alert ranking |
Examine the alert rankings for both offline and real-time instances:
|
If you do not have permission to view global scope data, you need to request the corresponding feature permission. For more information, see configuration and change owner feature permissions.
Offline instance exception statistics
Offline instance exception statistics include operation status and runtime duration rankings, and operation timeout alerts.
-
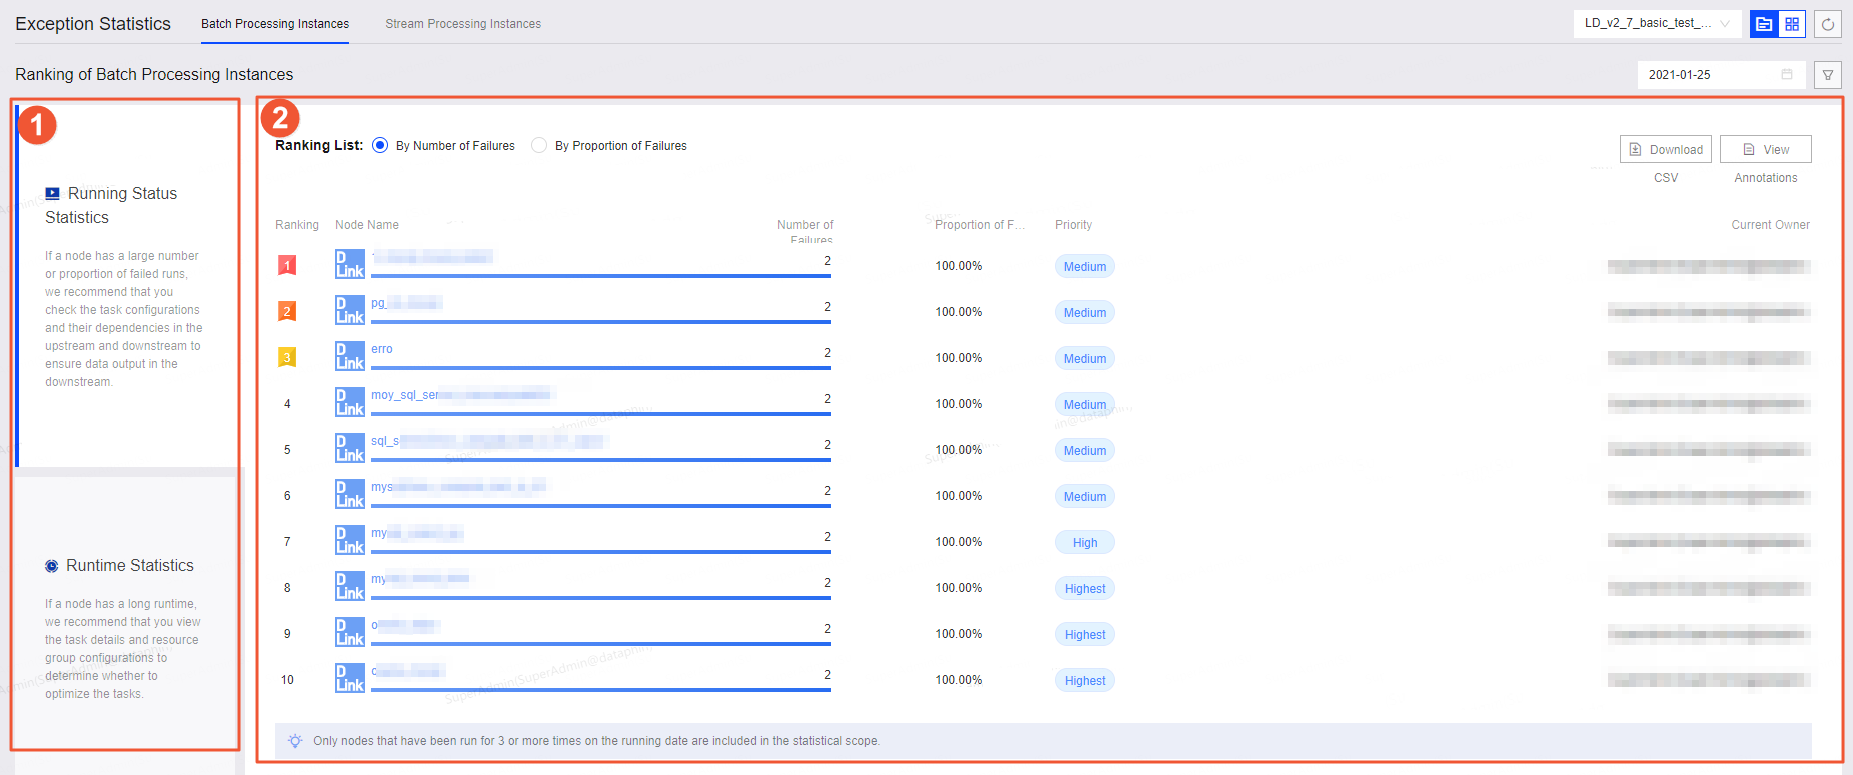
Offline instance ranking
Number
Description
①Operation status and runtime duration statistics
Select operation status and runtime duration data for analysis:
-
Operation status statistics show failure counts and failure rates. Examine tasks with high failure counts or rates to investigate their dependencies and potential impact on output data.
Review tasks with high failure counts or rates, along with their upstream and downstream dependencies, to prevent impact on output data.
-
Runtime duration statistics show the average execution time of tasks. Investigate tasks with extended runtimes to determine whether task details or resource group configurations need optimization.
If a task node has an unusually long runtime, review the task details and resource group configuration to determine if optimization is needed.
②Offline instance exception ranking
Review rankings based on failure counts and ratios to address abnormal tasks promptly.
Click View Comments for metric explanations, such as failure counts and ratios.
Click Download CSV to obtain detailed statistics for in-depth analysis of exception causes.
-
-
Alert ranking
The Alert Ranking section displays operation timeout alerts. For tasks with frequent alerts, check whether the monitoring configurations are appropriate and consider optimizing the tasks. Additional actions include:
-
Click Alert Center for detailed alert information.
-
Click the Actions column's
 icon to access the task module and review production tasks.
 -
Click the Actions column's
 icon to view monitoring configurations.
-
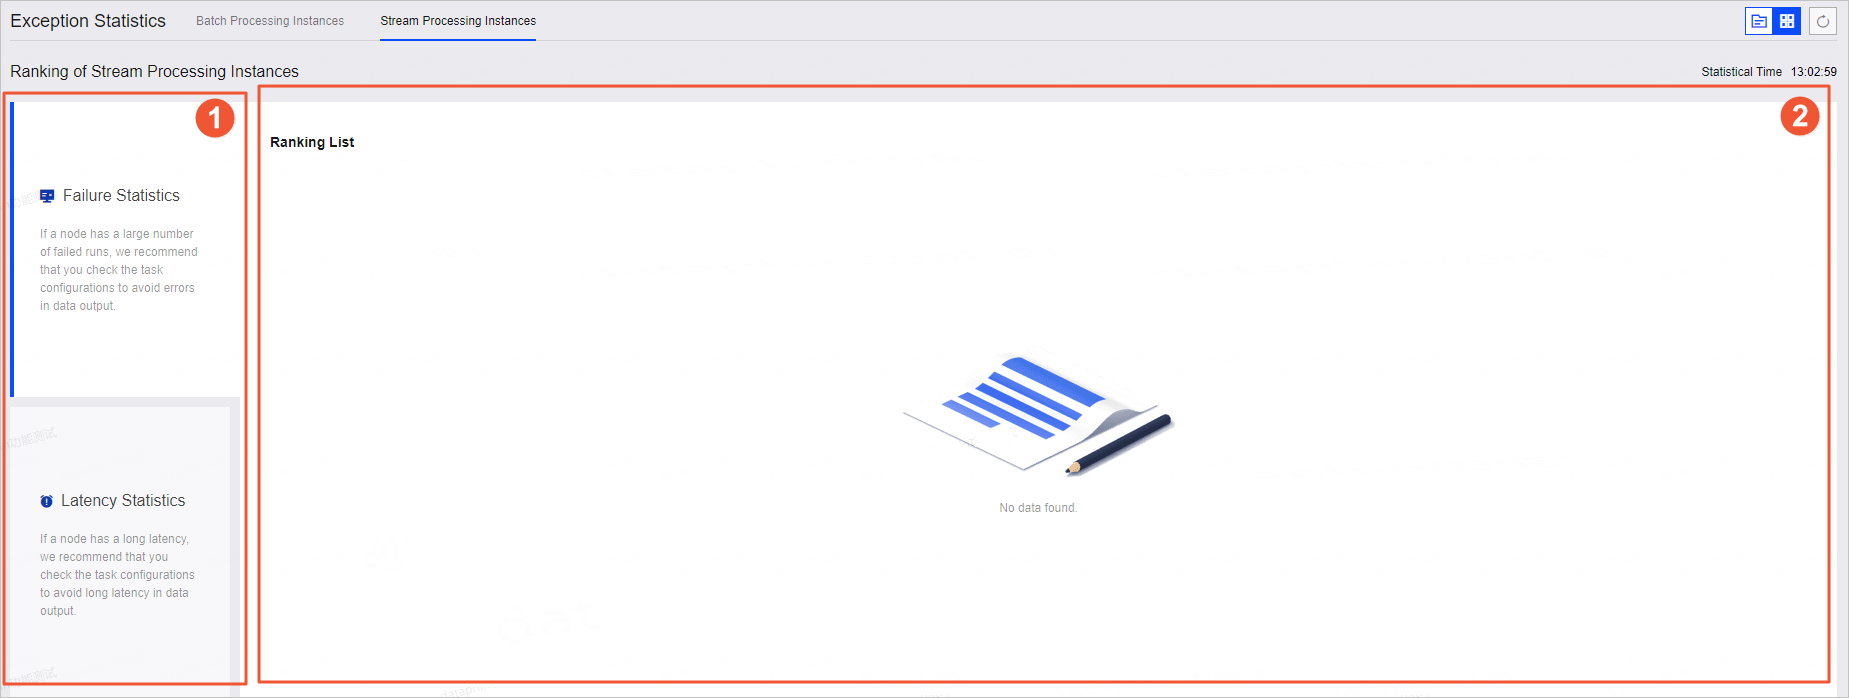
Real-time instance exception statistics
Real-time instance exception statistics include failure count and delay duration rankings, and alerts for high business delays and TPS anomalies.
-
Real-time instance ranking
Number
Description
①Status count and delay duration statistics
Select failure count and delay duration data for analysis:
-
Failure count statistics highlight tasks with high failure rates. Review the task configuration for these nodes to ensure normal data output.
Review the task configuration for nodes with high failure rates to ensure normal data output.
-
Delay duration statistics identify tasks with significant delays. Review the task configurations for these nodes to prevent delayed data output.
For task nodes with significant delays, review the relevant task configurations to prevent delayed data output.
②Instance exception ranking
Review rankings based on failure counts, ratios, and average durations to address abnormal tasks promptly.
Click View Comments for explanations of metrics such as failure counts and delay durations.
Click Download CSV to download comprehensive statistics for a thorough analysis of data exception causes.
-
-
Alert ranking
In the Real-time Instance tab's Alert Ranking section, view rankings for high business delay, TPS deviations, excessive failure frequency, and data retention issues. For tasks that frequently appear in these rankings, check whether the monitoring configurations are appropriate and consider optimizing the task configurations. Further actions include:
-
Click Alert Center for detailed alert information.
-
Click the Actions column's
icon to navigate to the task module and inspect production tasks. -
Click the Actions column's
icon to access the monitoring alert module and review monitoring configurations.
-