View instance statistics
Instance statistics show the running details, trends, and rankings of offline and real-time instances, including failed instance counts and failure alerts. You can monitor instance operations from both a project and global perspective.
Statistics explanation
-
The instance statistics feature aggregates data from instances in the production environment.
-
For logical table task instances, the statistics represent the number of actual materialized instances corresponding to the logical table, which may differ from the numbers shown in the detail and aggregate table lists.
Instance statistics entry
-
On the Dataphin home page, single click the Development tab in the top menu bar. By default, you will be directed to the data Development page.
-
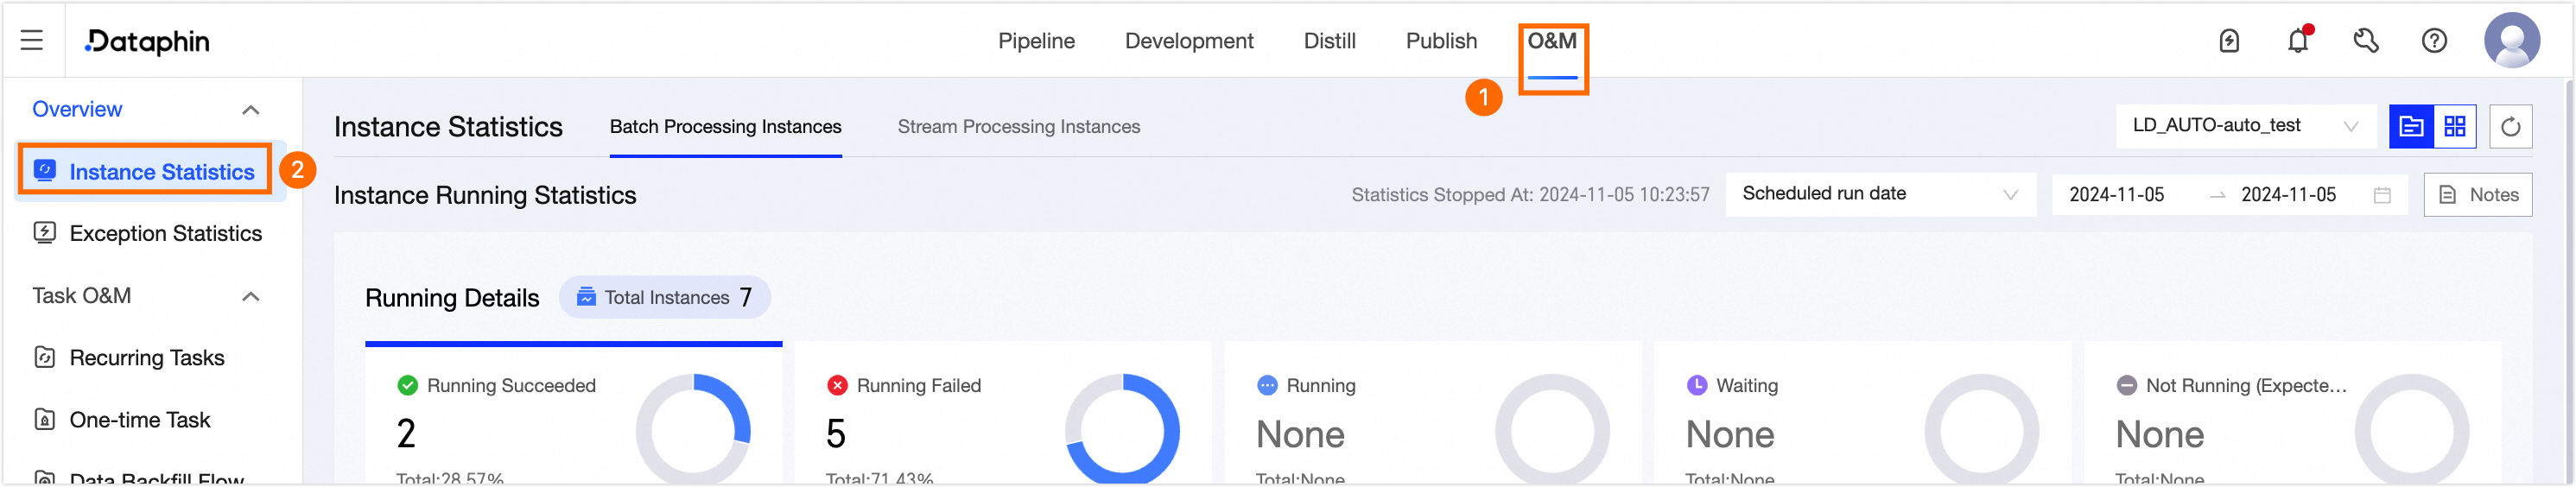
To access the Instance Statistics page, follow these steps:
Single click O&M -> Instance Statistics.
Instance statistics page introduction
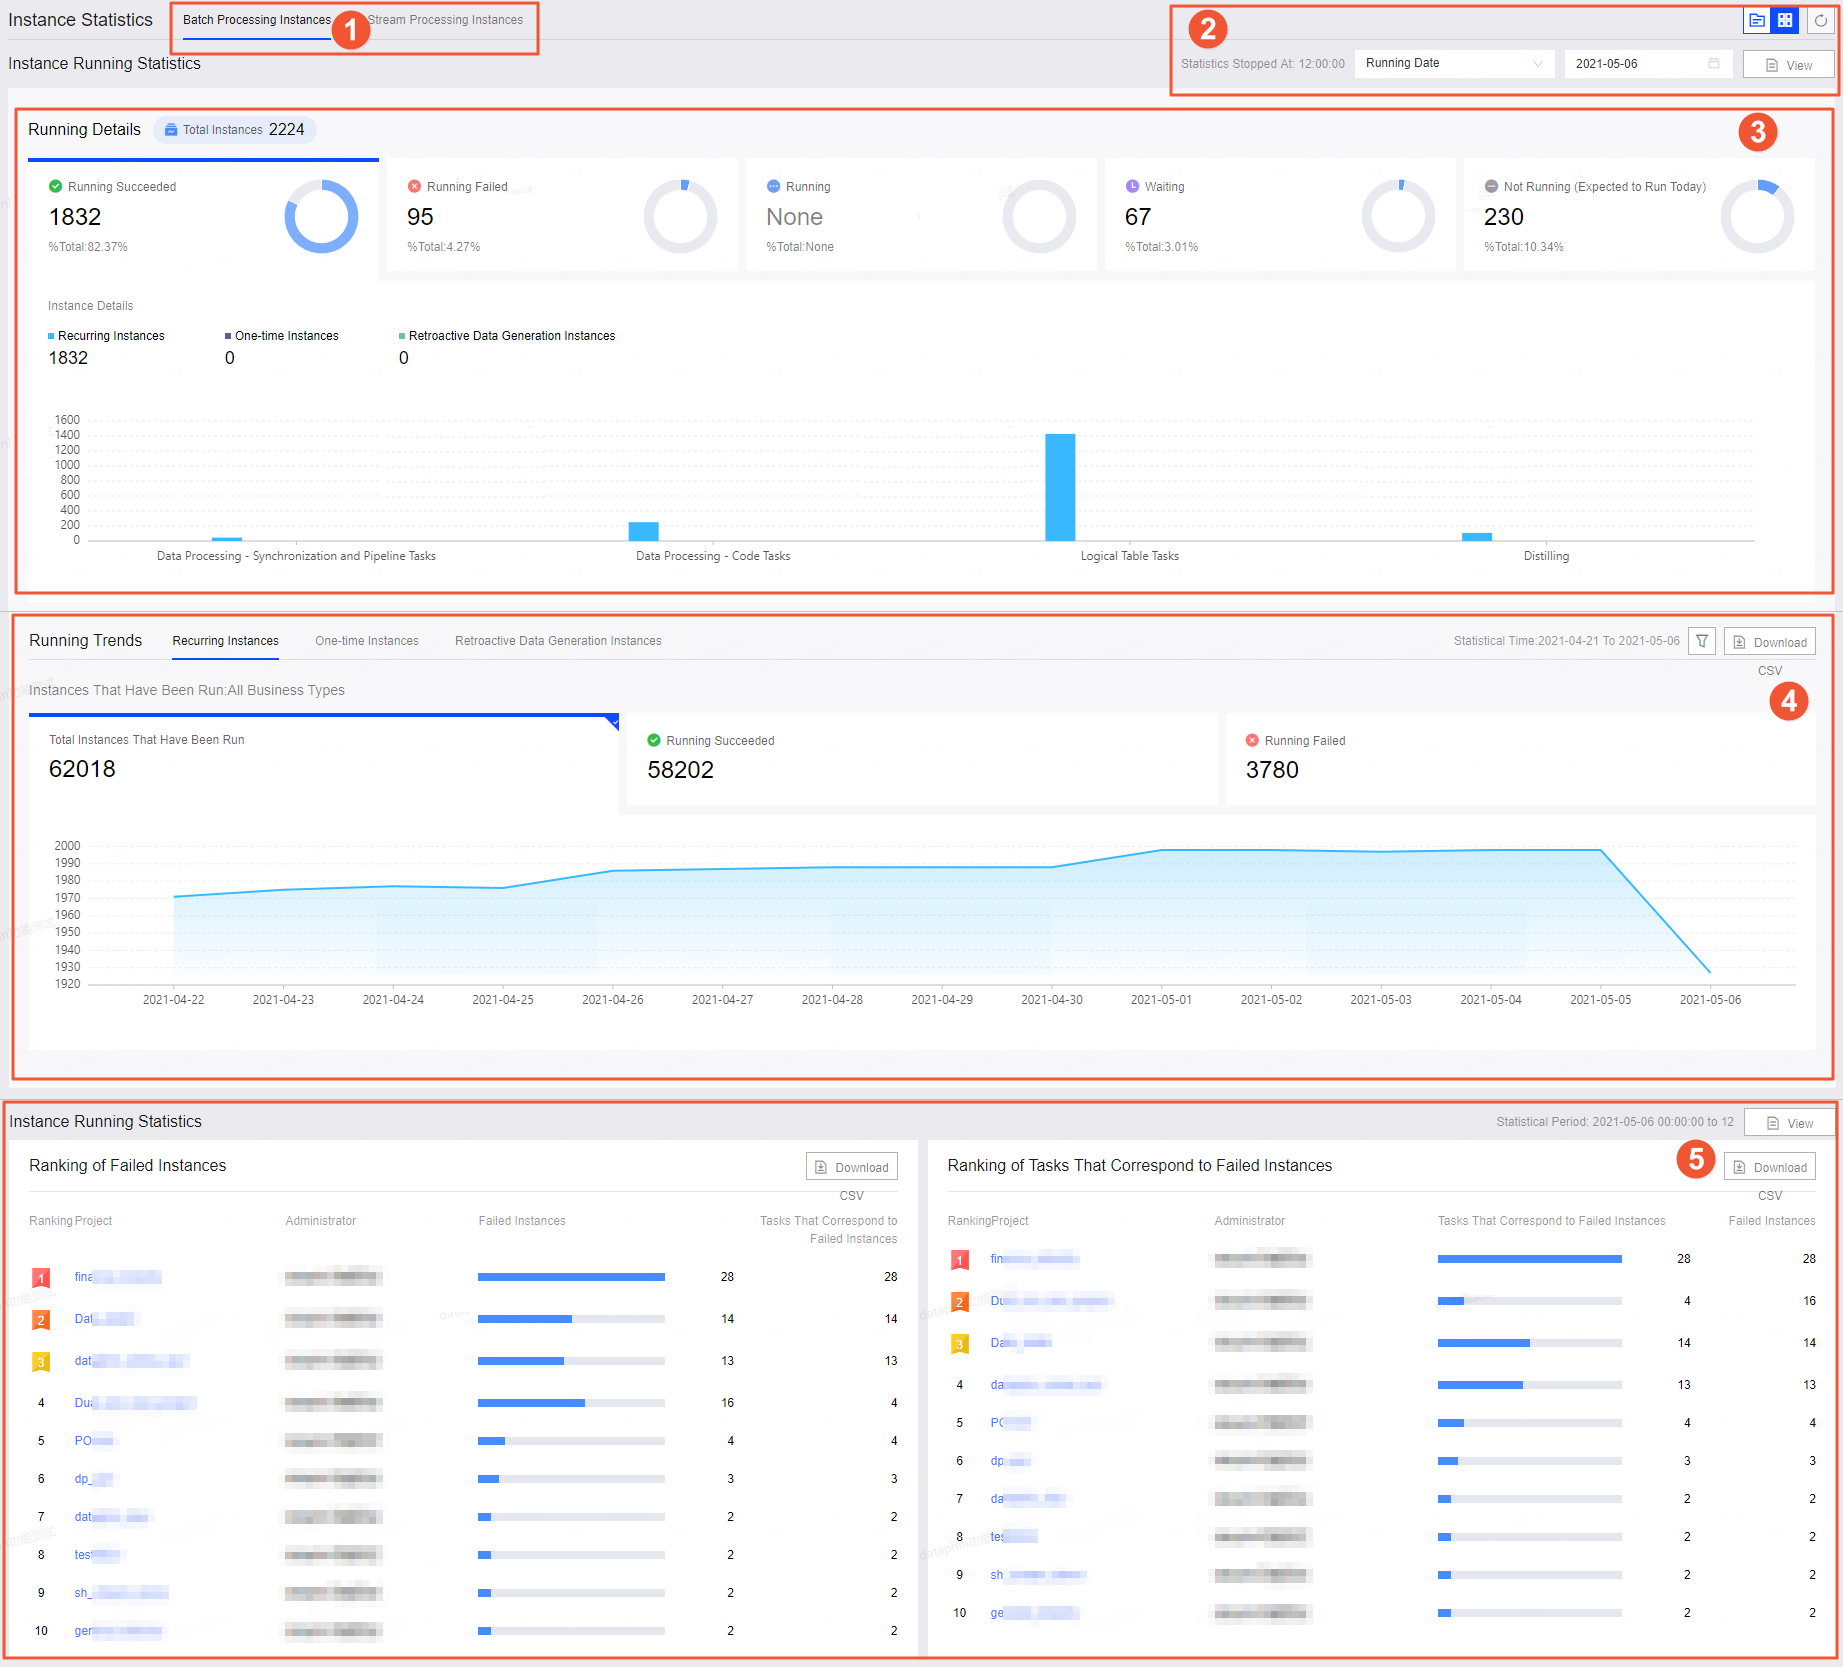
The instance statistics page consists of Running Details, Running Trends, and Rankings.
|
Number |
Description |
|
①Instance tabs |
The dashboard displays operational metrics for offline and real-time instances. Click the Offline Instances or Real-time Instances tabs to view corresponding data. |
|
②Global and project perspectives |
Click View Comments to see explanations of each metric. |
|
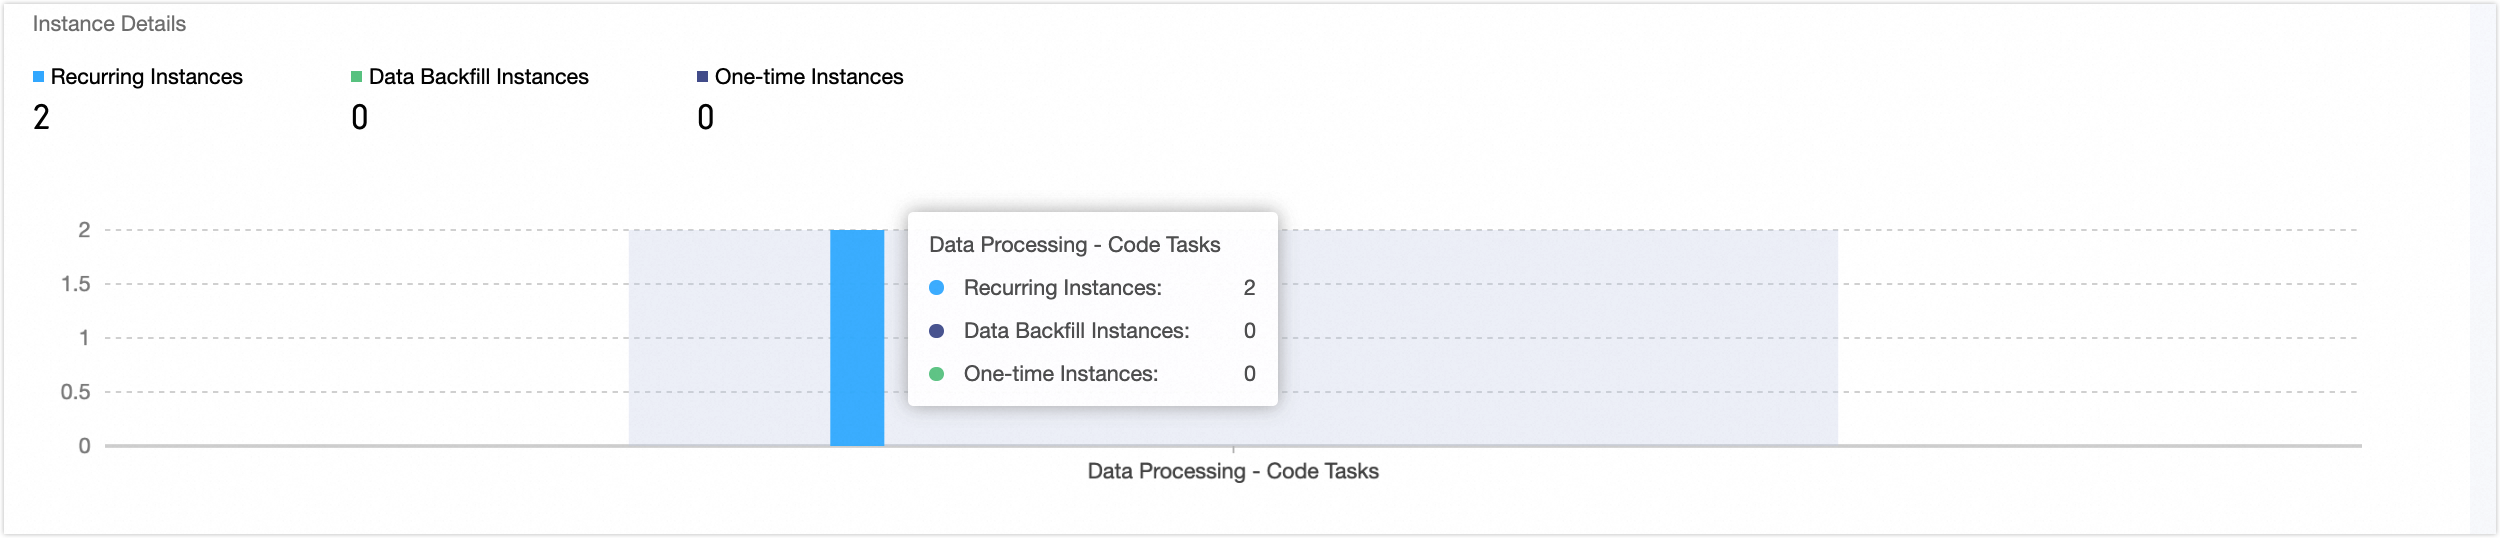
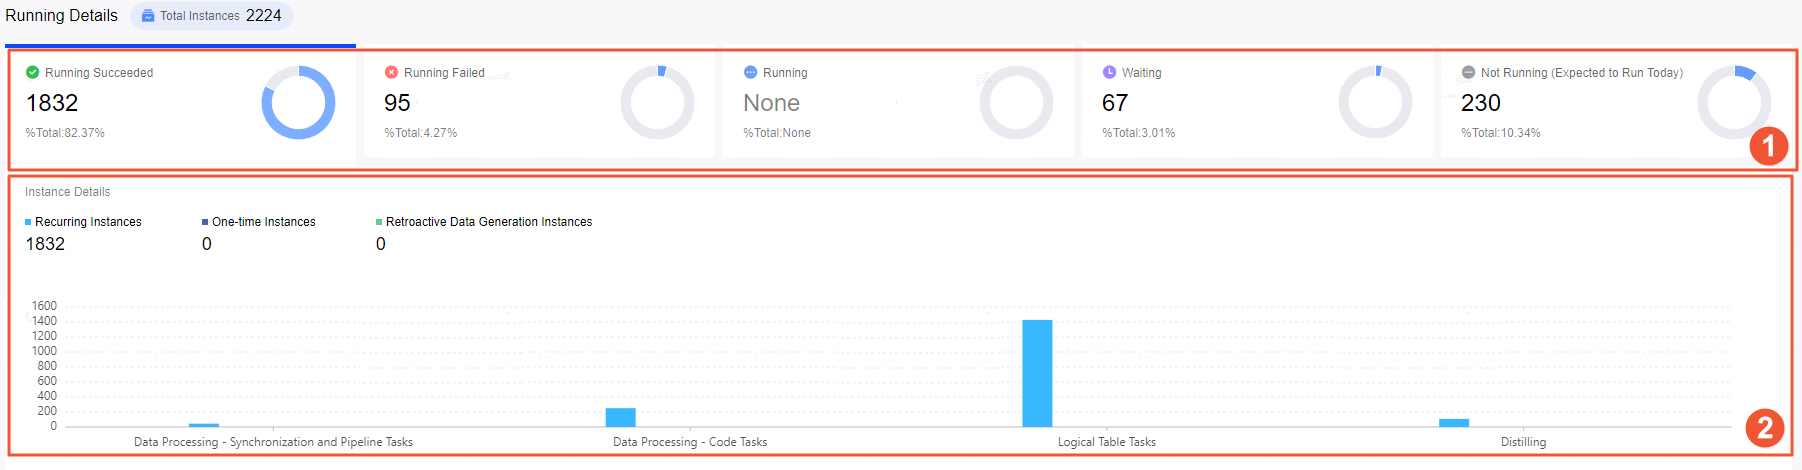
③Operational details |
Shows operational details, including the total number of instances and the proportion of instances in each status. It also displays the total number of Recurring Instances, One-time Instances, and Data Backfill Instances. Instance source modules are shown in a column chart. Hover over the chart to see the module name and the count of recurring, data backfill, and one-time instances. |
|
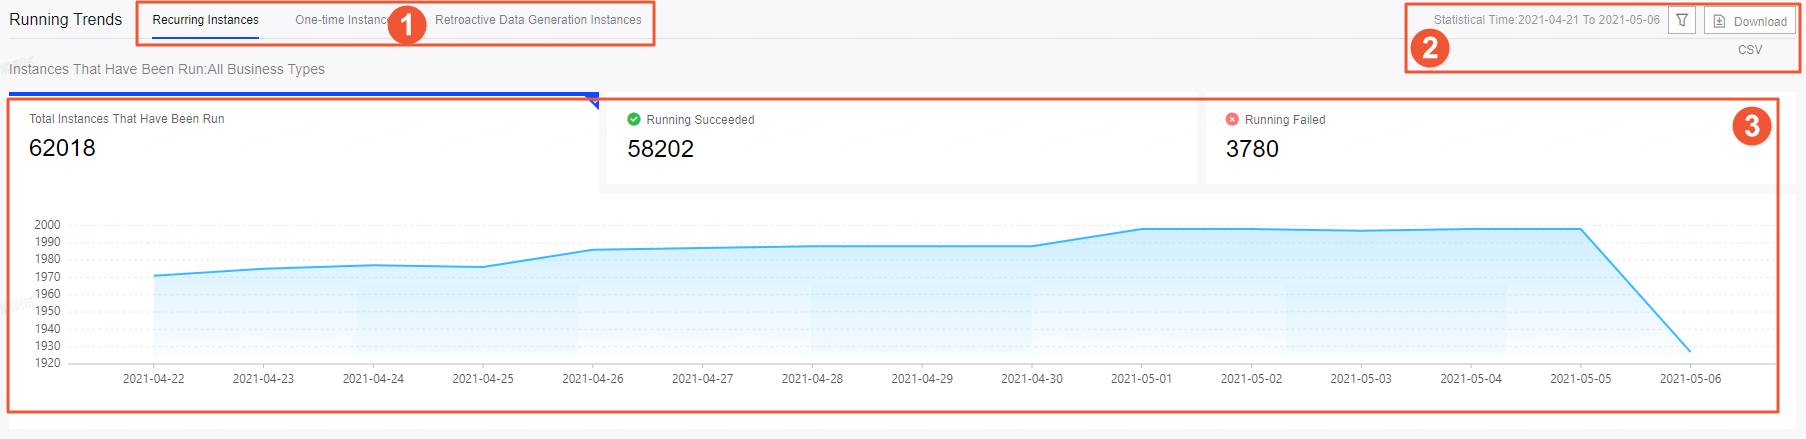
④Operational trends |
Shows the operational data and trends of recurring, one-time, and data backfill instances over the past 15 days. Hovering over a specific operational date reveals the operational status of instances for that day. If you have selected Total Number Of Running Instances, Successful Runs, and Failed Runs, you can view the Failed Runs, Total Number Of Running Instances, Successful Runs, and 15-day Average Of Failed Instances for that day. Note
Run Date supports viewing the Running Trend. |
|
⑤Instance operational statistics |
|
If you lack permission to view global scope data, request the necessary permissions. For more information, see Configure and change owner permissions.
View offline instance statistics
-
Operational Details
Operational details display the status of code tasks, sync tasks, pipeline tasks, logical tables, and extract tasks, with instance distribution by business and scheduling types.
Focus on failed instances with an operational date of the current day (data timestamp of T-1) to assess failure types and mitigate business impact.
Number
Description
①Number of operational statuses
Shows the number and proportion of instances in each status.
NoteFor logical table tasks, the statistics represent the number of materialized nodes, not the number of logical task nodes.
②Distribution
Displays the distribution of recurring, one-time, and data backfill instances for each business type based on the selected operational status in area ①.
When the project perspective is selected (
 icon), the system presents information tailored to the chosen project:
-
Selecting the extract project (Data_distill) omits Logical Table from the horizontal axis.
-
For non-extract projects (Data_distill), the horizontal axis excludes Extract.
In the global perspective (
 icon), the horizontal axis includes Data Processing - Sync & Pipeline, Data Processing - Code Tasks, Logical Table, and Extract.
 -
-
Operational Trends
Operational trends show the 15-day trend of recurring, one-time, and data backfill instances, helping identify abnormal patterns.
ImportantOperational trends are not available when filtering by data timestamp.
Number
Description
①Instance tabs
Select tabs for recurring, one-time, and data backfill instances to view corresponding trends.
②Filter and download CSV
Click the
 icon to filter by business category.
Click Download CSV to download the operational status of instances for the past 15 days.
③Trend chart
Select trends for running instances, successful runs, and failed runs to display in the trend chart.
Hover over the trend chart to view the operational status for that day. If running instances, successful runs, and failed runs are selected, hovering will display the Total Number Of Running Instances, Successful Runs, Failed Runs, and 15-day Average Of Failed Instances.
-
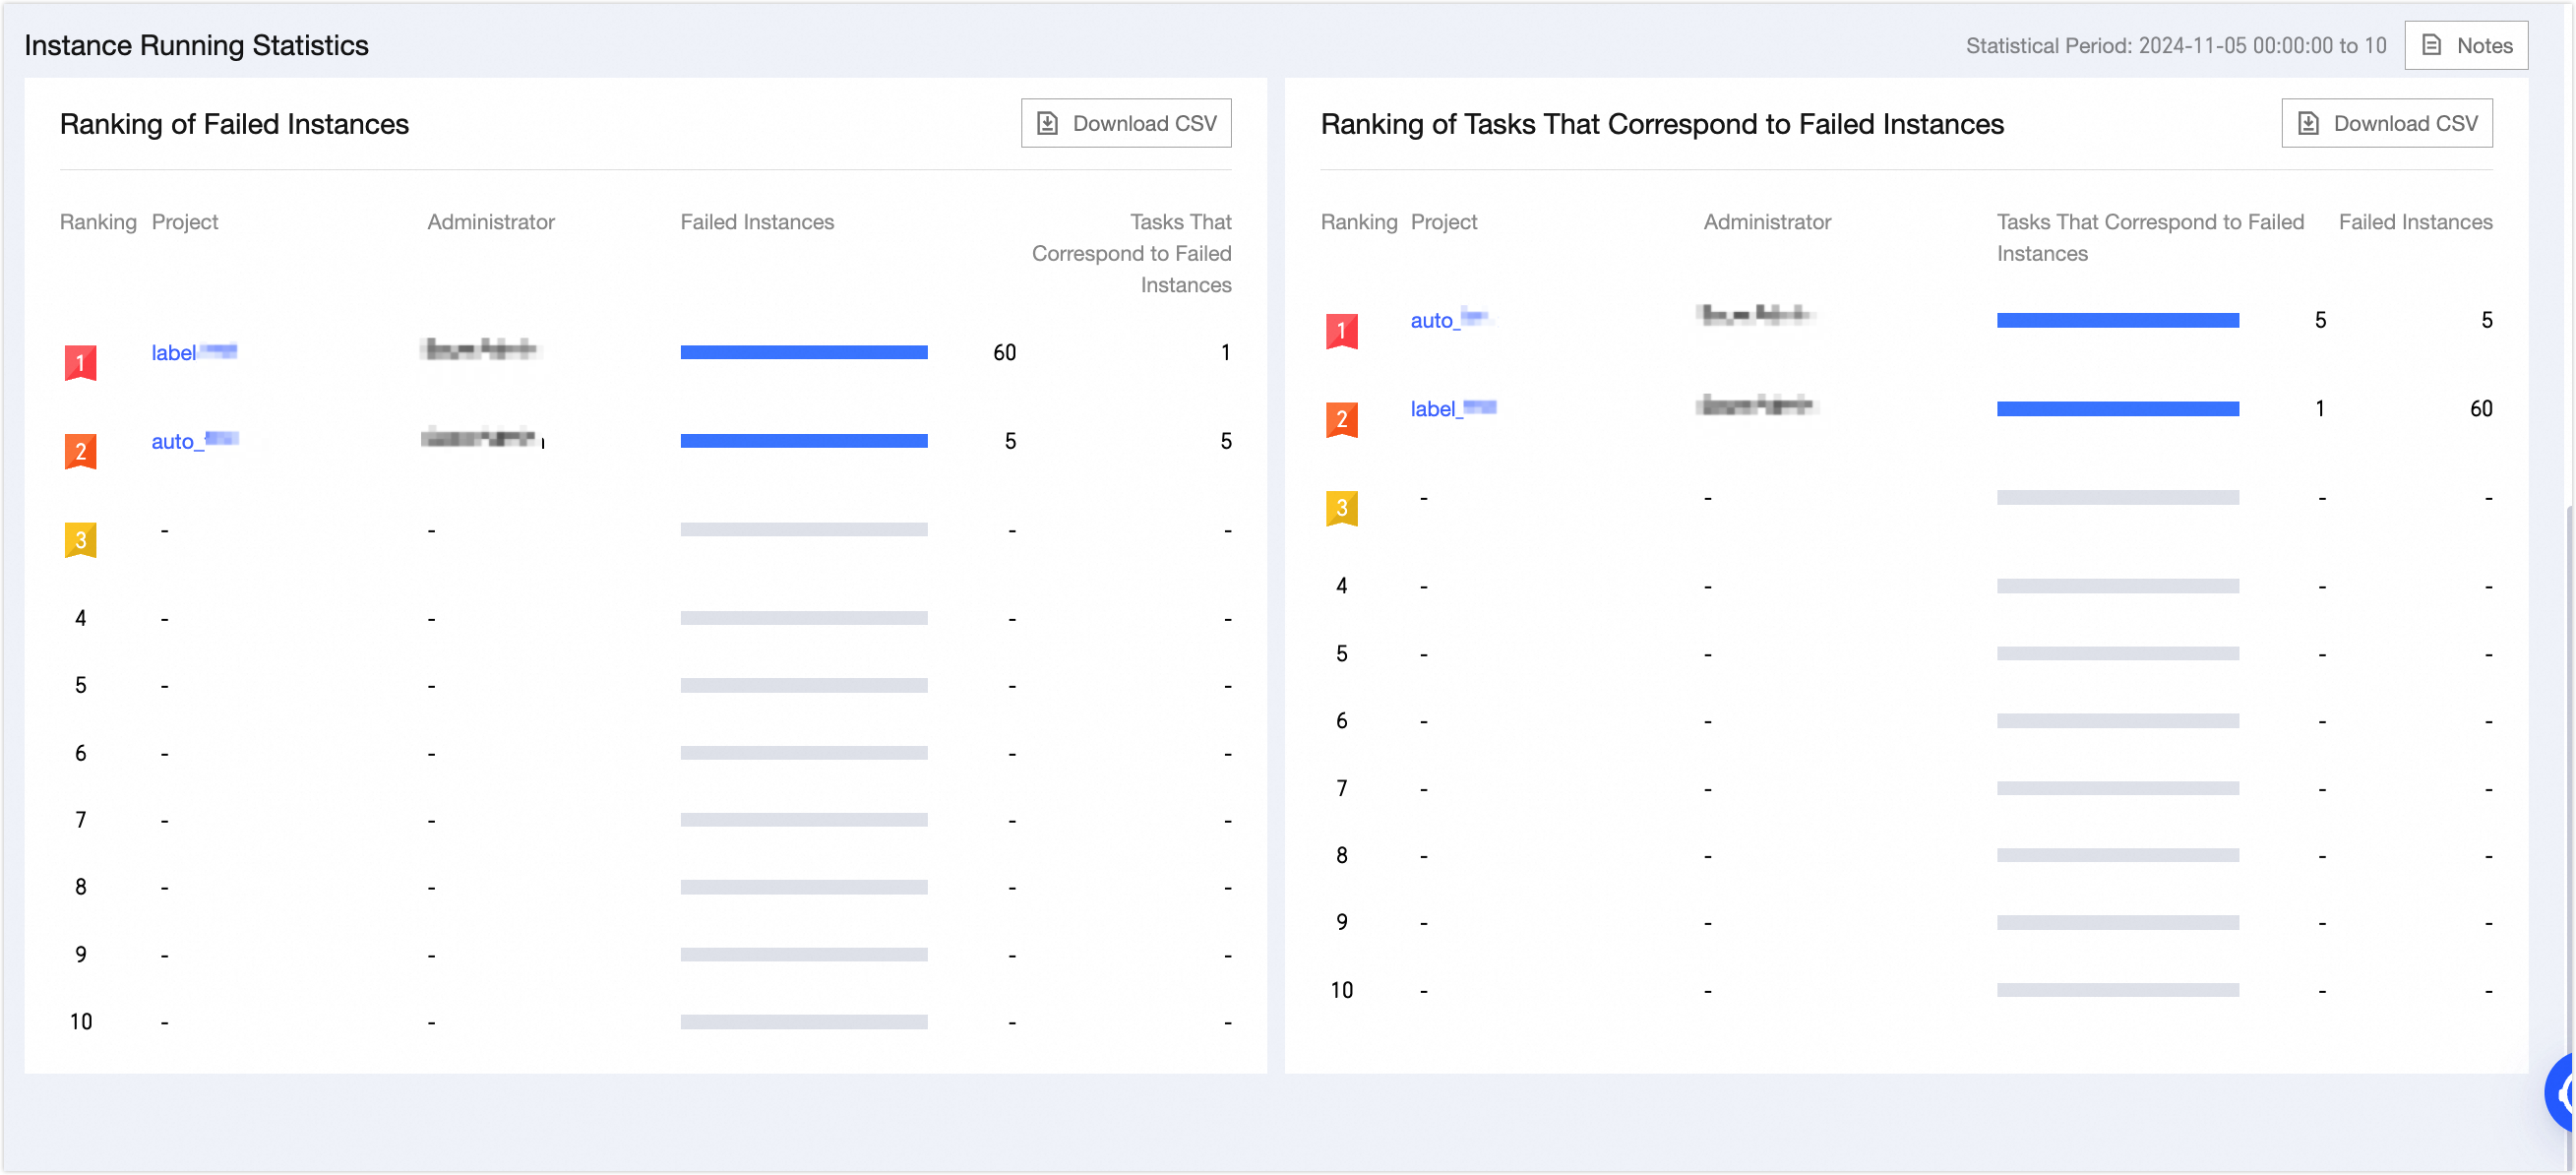
Instance Operational Statistics
ImportantInstance operational statistics are available when viewing the instance statistics page in the global perspective (
icon).Instance operational statistics rank projects by the number of failed instances and associated tasks. Because hourly and minute tasks generate multiple instances daily, the two rankings highlight different issues: use the task ranking to investigate failed tasks, and the instance ranking to assess impact on current business data.
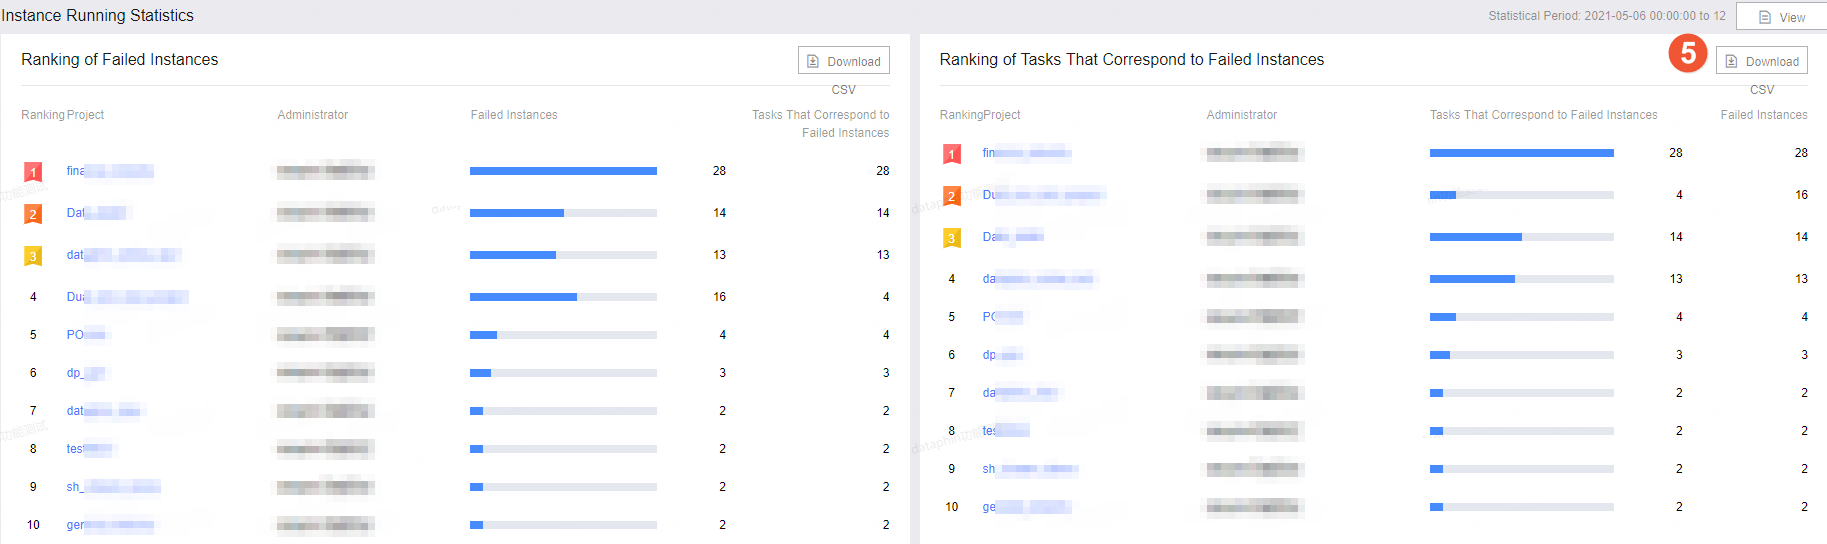
Click View Comments for explanations of failed instance and task counts. Click Download CSV to download the ranking data.
View real-time instance statistics
-
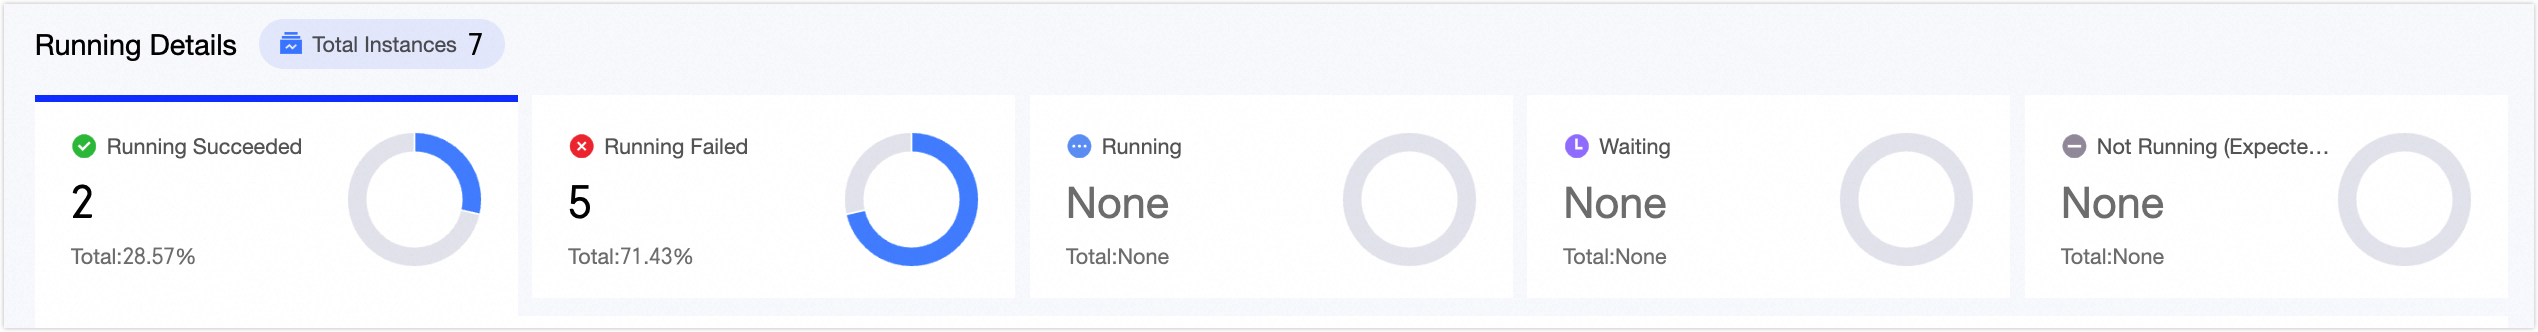
Operational Details
Operational details show the status and count of instances for each code type. Focus on failed instances with an operational date of the current day (data timestamp of T-1) to assess business impact and take action.
-
Operational Trends
Operational trends show the number of running, in-progress, paused, and stopped instances.
ImportantOperational trends are not available when filtering by data timestamp.
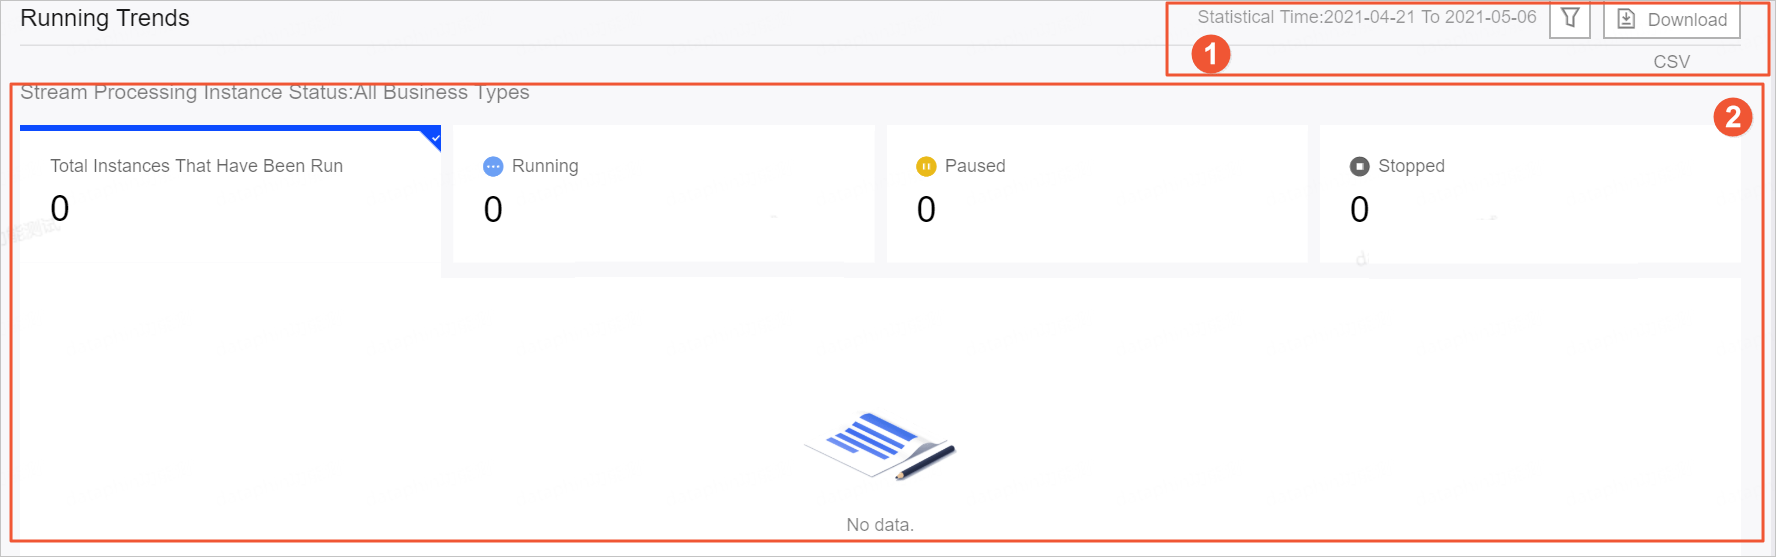
Number
Description
①Business category filter area
Click the
icon to filter by business category, including options like FLINK_SQL, FLINK_TEMPLATE_SQL, and FLINK_DATASTREAM.Click Download CSV to download operational details for the past 15 days.
②Operational trend chart
Select trends for running instances, in-progress instances, paused instances, and failed instances to display in the trend chart.
Hover over the trend chart to view the operational status for that day. If running instances, in-progress instances, paused instances, and stopped instances are selected, hovering will display the total number of instances, instances in progress, paused instances, and stopped instances.
-
Instance Operational Statistics
ImportantInstance operational statistics are available when viewing the instance statistics page in the global perspective (
icon).Instance operational statistics display rankings by project, showing the number of instances with failure and delay alerts.