A real-time instance is created when you submit a real-time task to the operations center. You can view instance data, code, and parameters, and perform operations such as starting, stopping, and decommissioning instances.
Real-time instance page
-
In the top navigation bar on the Dataphin homepage, choose Development > task operations.
-
In the top navigation bar, select either the production or development environment.
-
In the navigation pane on the left, choose instance operations > Real-time Instance to open the Real-time Instance page.
Real-time instance page
The Real-time Instance page lists all system-generated real-time instances and allows you to manage them.
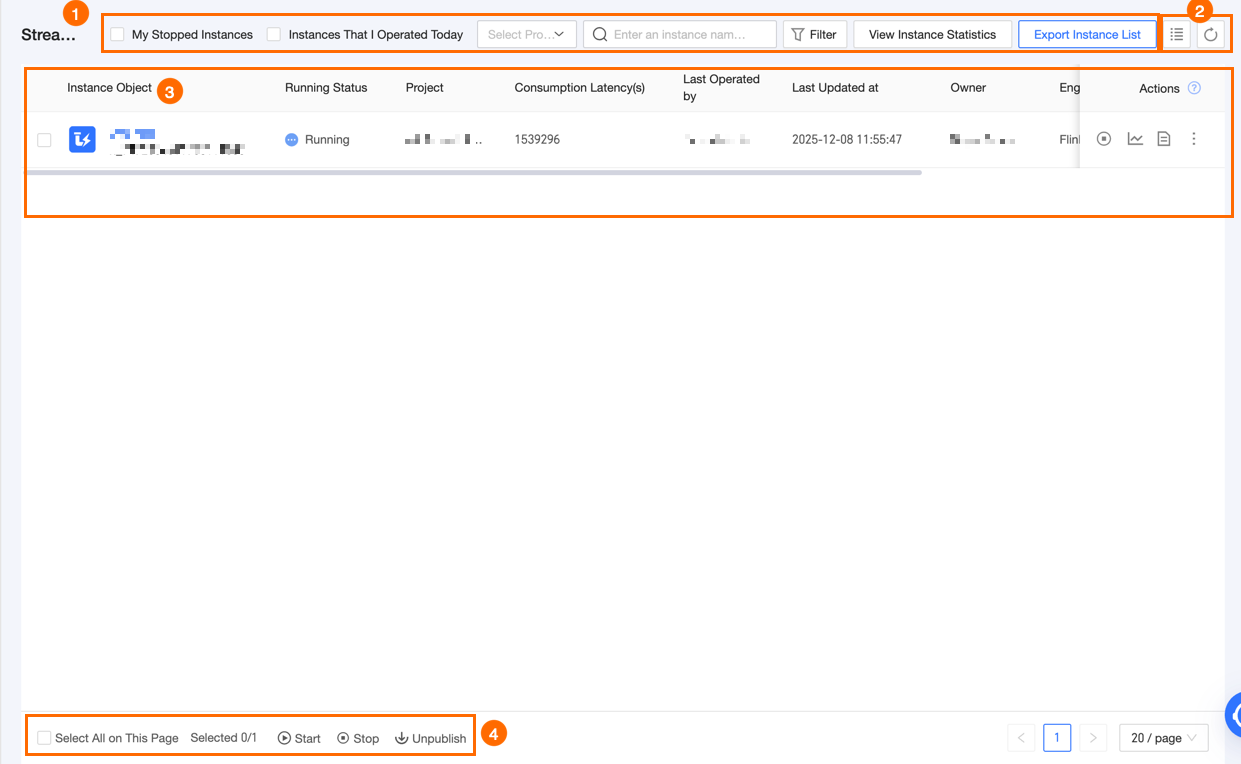
|
Area |
Description |
|
① Filter and search area |
You can search for a real-time instance by entering its object name or ID.
|
|
② List operations |
|
|
③ Real-time instance list |
The real-time instance list displays Instance Object, Status, Last Operator, Last Update Time, Owner, and Project. Column widths are adjustable and saved locally in your browser. Settings reset if you clear your browser history and cookies.
The Actions column lists the available operations for each real-time instance. For details on individual operations, see Individual operations. |
|
④ Batch operations |
Perform batch operations such as start, stop, and decommission on multiple real-time instances. For details on supported batch operations, see Batch operations. |
Real-time instance status
|
Icon |
Status |
Description |
|
|
Succeeded |
The instance has finished processing all data in a bounded stream. |
|
|
Starting |
The instance is preparing to start but has not yet begun executing. |
|
|
Running |
The instance is currently running. |
|
|
Stopping |
The system is stopping the instance. |
|
|
Stopped |
The instance has stopped. |
|
|
Failed |
The instance failed during execution. |
|
|
Startup Failed |
The instance failed to start. |
Manage real-time instances
Individual operations
|
Actions |
Description |
|
Start |
In the Actions column of the target real-time instance, click the |
|
Stop |
In the Actions column of a Running instance, click the
Note
|
|
Decommission |
In the Actions column of the target real-time instance, click the |
|
View runtime analysis |
In the Actions column, click the If the real-time instance uses the Ververica Flink or Blink engine, see View the details of a job. |
|
View real-time task |
In the Actions column, click the |
|
View instance code |
In the Actions column, click the |
|
View instance parameters |
Click the |
 icon and select View Real-time Task to navigate to the task page for the current instance and view its details.
Batch operations
|
Actions |
Description |
|
Start |
Note
The required instance status for starting varies by engine.
Start real-time development instances:
|
|
Stop |
Note
Only instances with a status of Failed, Running, Startup Failed, Recovery Failed, or Succeeded can be stopped. Stop real-time development instances:
|
|
Decommission |
Decommissions the selected real-time instances from the production environment. Note
Only instances in the Stopped state can be decommissioned. |
Real-time instance DAG
Click an instance object name in the list to display its DAG on the right. By default, the DAG centers on the selected node and shows its immediate parent and child nodes. You can adjust the view:
-
Click the
 icon to hide the instance list and expand the DAG.
 -
Click the
icon to hide the DAG. -
Hover over the
icon and drag to resize the DAG pane.
The DAG shows the node's upstream and downstream dependencies. You can perform operations on these nodes.

|
Area |
Description |
|
① Node information pane |
Displays summary information for the selected node. Click View node details for full details. Ververica Flink real-time engine: Includes Node Details, Runtime Log, Operation Log, Node Code, and Task Parameters (only for compute task instances).
|
|
② Node search and filter area |
Set the number of upstream and downstream levels to expand from the main node. You can also search for a node name to locate it in the DAG. |
|
③ Scheduling dependency graph |
Displays the scheduling dependency graph. Expand to show more upstream and downstream nodes and perform operations on them. Hover over a node to view its name, type, scheduling cycle, owner, and description. |
|
④ Canvas adjustment area |
Adjust the DAG display scale: set a specific zoom level (default 100%), zoom in (max 200%), zoom out (min 20%), fit to canvas, or enter full-screen mode. Also displays the node ID and name of the main node. |
DAG node operations
|
Actions |
Description |
|
Expand parent nodes |
Expands the DAG to show more levels of parent or child nodes. |
|
Expand child nodes |
|
|
View real-time task |
Navigates to the task node DAG for the current instance to view task details, upstream and downstream nodes, and perform task operations. For more information, see Manage real-time tasks. |
|
View node code |
Views the task code that generated the current instance. |
|
View runtime log |
Views the runtime log of the instance node. If the task generates dirty data, you can click Download Dirty Data File to download it for local inspection. The file includes the Time, Error content, and Error cause. By default, the system retains these files for 7 days. |
|
View task parameters |
View the task parameters of the current instance node, such as |
|
Edit development node |
Navigates to the task editing page for the current instance in the development project. This is applicable only in the Dev-Prod development mode. |
|
Edit node |
Navigates to the task editing page that generated the current instance node. This is applicable only in Basic mode. |
|
View production node |
Views the configuration of the task in the Prod project that generated the current instance node. |
|
View operation log |
Views the operation log for the current instance, including Operation Time, Operator, and Action. |
|
View runtime analysis |
Views the instance's runtime information, data curves, failover parameters, and more. If the real-time instance uses the Ververica Flink or Alibaba Blink engine, see View the details of a job. |
|
Start |
Starts the current real-time instance. For details, see Start a real-time instance. |
|
Stop |
Stops a real-time instance that is Running or Succeeded. For instances with a status of Succeeded, only
Note
The Blink real-time compute engine does not support choosing between stop without savepoint and stop with savepoint. |
|
Decommission |
Decommissions a real-time instance from the production environment. This action is available only for instances in the Stopped state. |