Add a Log Service (SLS) data source to DataV to visualize real-time data.
Prerequisites
The Log Service data source is prepared.Add a Log Service data source
Log on to the DataV console.
On the My Data tab, select Data Source Management and click Add Data.
- Select Log Service from the Type drop-down list.
- Enter Log Service information.
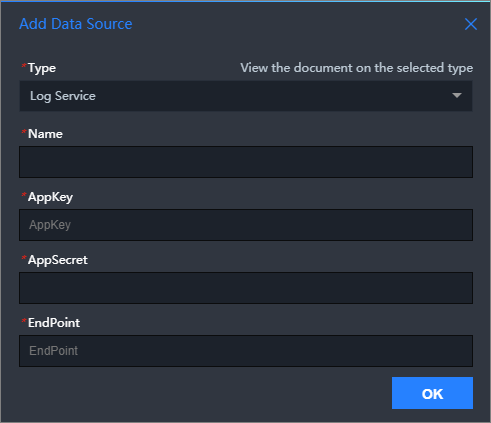
Parameter Description Name Custom name for the data source. AppKey AccessKey ID of an account with access to the SLS instance. AppSecret AccessKey secret of the same account. EndPoint SLS endpoint. Select the endpoint that matches your network type and region from Endpoints. Example: for a VPC-connected instance in the China (Shanghai) region, enter https://cn-shanghai-intranet.log.aliyuncs.com in EndPoint.
- Click OK.
The data source appears in the data source list.
Use a Log Service data source
Log on to the DataV console.
On the My Visualization page, hover the pointer over the visualization application that you want to edit, and then click Edit.
ImportantIf you do not have any visualization applications on the My Visualization page, create one. For more information, see Create a PC visualization application using a template.
On the canvas editor page, click a widget on the canvas.
If the canvas does not have any widgets, add one. For more information, see Add an asset.
In the configuration panel for the widget on the right, click the Data tab, and then click Configure Data Source.
- In the Set Data Source pane, select Log Service from the Data Source Type drop-down list.
- In the Select Data Source section, select the configured Log Service data source.
- Enter query parameters under Query.
Use a JSON object to specify query parameters:
{
"projectName": "test",
"logStoreName": "access-log",
"topic": "test",
"from": 1509897600,
"to": 1509984000,
"query": "" ,
"line": 100,
"offset": 0
}
Note For more information about the query syntax for query parameters, seeSearch syntax and functions. - Click Preview Data Response to verify the results.