The dashboard embedding feature lets you embed multiple published dashboards, known as child dashboards, into a main dashboard. This feature lets you display and manage multiple dashboards from a central location. You can use widgets, such as buttons and tab lists, to load and unload child dashboards, and use interaction events, global variables, and blueprint interactions to enable data and behavior interactions among them.
Demonstration and logic
Demonstration
Before embedding: Three dashboards are developed and displayed independently.
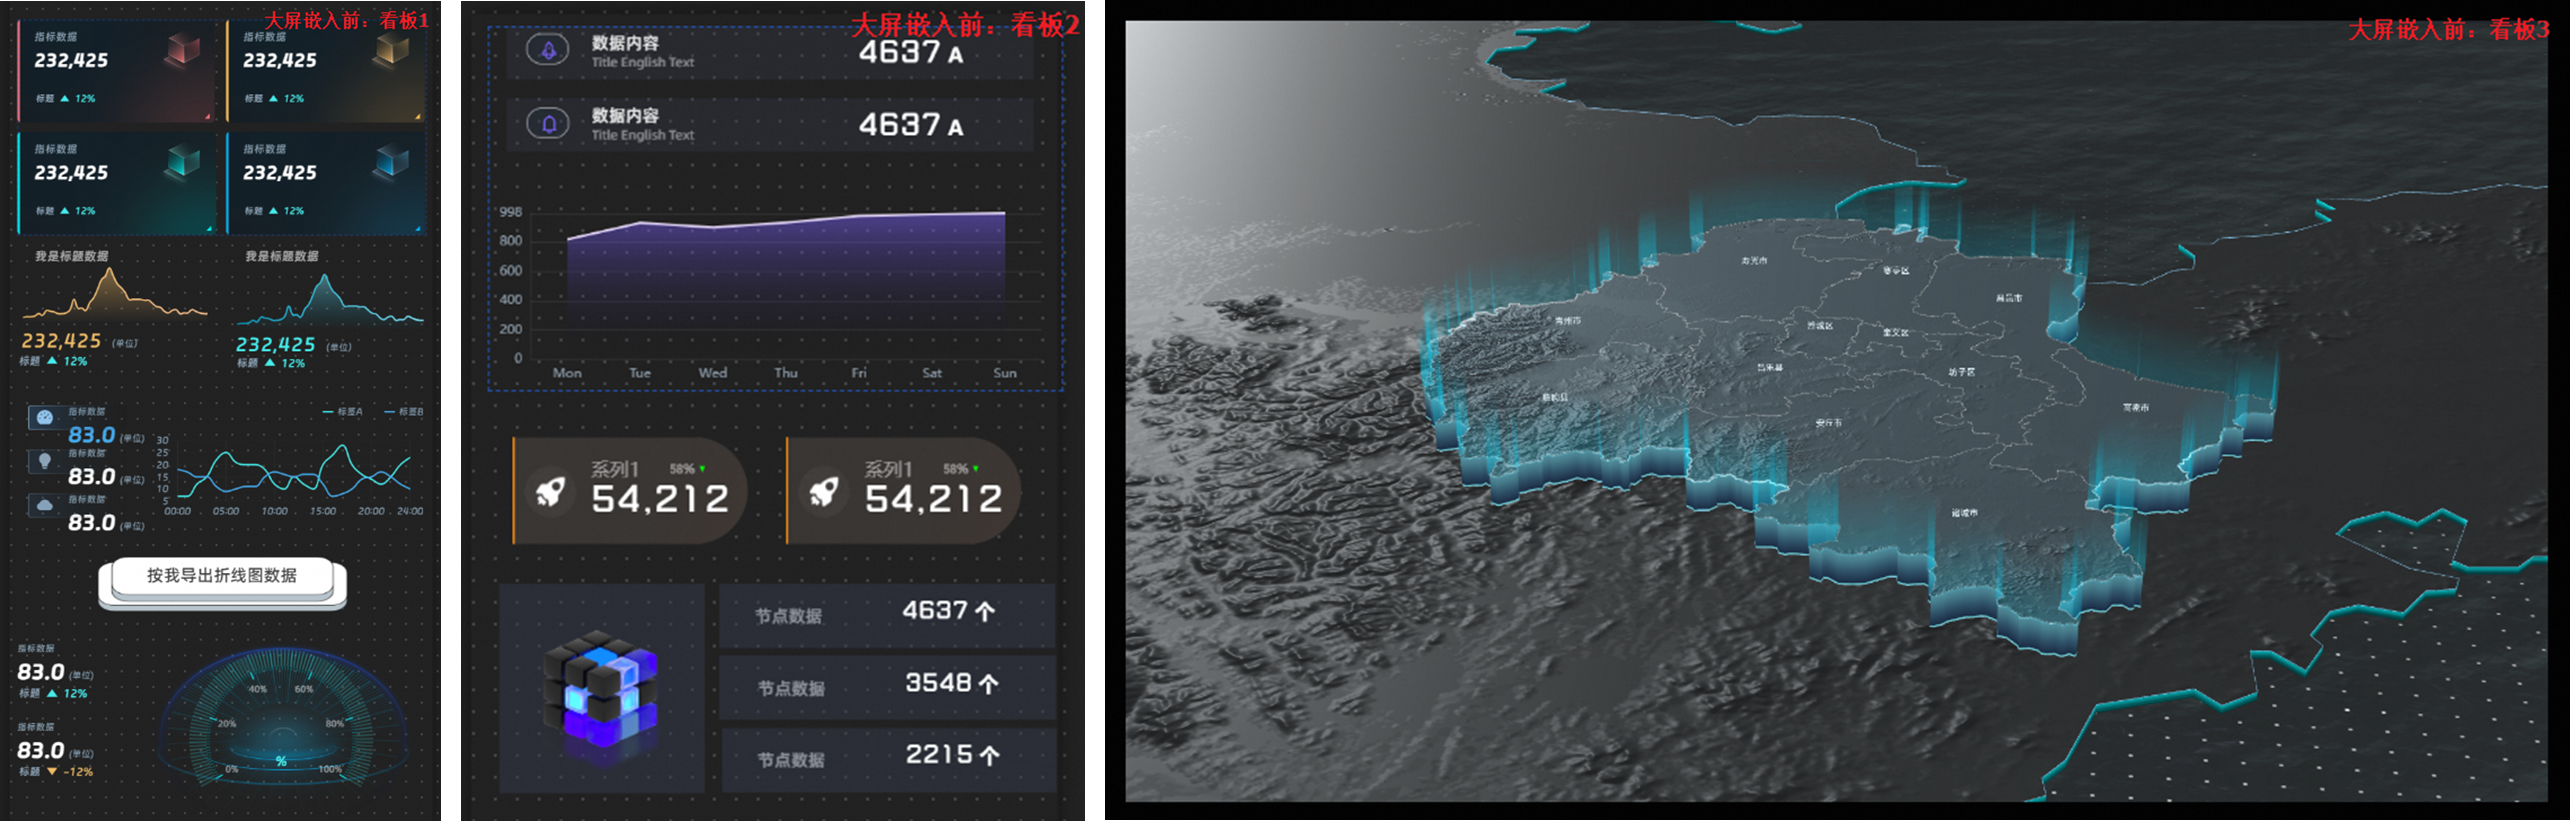
After embedding: Three dashboards are developed independently, displayed centrally, and support interactive effects.
The final result is shown below:
Logic implementation
The following example, based on the animation above, explains the logic behind dashboard embedding.
Example: A 3D map widget is added to the main dashboard as a background. Two child dashboards (Child Dashboard 1 and Child Dashboard 2) are embedded. Five button widgets control the visibility, loading, and unloading of the child dashboards. When a button in Child Dashboard 1 is clicked, data from its line chart is transferred to the line chart in Child Dashboard 2. The numbers from 1 to 7 in the diagram illustrate the data transfer process. The following diagram illustrates the logical relationship.

Main dashboards and child dashboards are functionally identical data dashboards. For clarity, dashboards that are embedded are referred to as child dashboards.
Showing/hiding and loading/unloading a child dashboard produce similar visual effects, but they differ in performance:
Show/Hide: When a dashboard is hidden, it is not cleared from memory but is simply not visible to the user. This allows for instant switching between dashboards. However, this method consumes system and graphics memory, making it suitable for high-performance machines.
Load/Unload: When a dashboard is unloaded, all of its content is cleared from memory. When loaded, the content is requested again. This method may result in a slightly slower loading process but conserves system and graphics memory, making it suitable for machines with standard performance.
Scenarios

Parallel development to improve efficiency.
If a main dashboard contains numerous modules, you can assign each module as a child dashboard to different teams for parallel development. After development, you can embed all child dashboards into the main dashboard for a unified display.
Content reuse to save resources.
If multiple dashboards share visual content, such as widgets or data, you can encapsulate this content into a child dashboard. You can then use dashboard embedding to reuse this child dashboard across multiple main dashboards.
Dynamically switch between multiple dashboards.
If your business requires presenting different dashboards for various scenarios, you can use dashboard embedding to switch between them dynamically. By integrating all dashboards into a single main dashboard, you can use the load/show and unload/clear mechanisms for dynamic switching.
When you publish changes to a child dashboard, any main dashboard that embeds it is updated in real time. You do not need to republish the main dashboard to view the latest content from its embedded child dashboards.
Limits
The dashboard embedding feature is available only to users of the Professional Edition or higher. If you are using a lower edition, see Upgrade your product edition.
You can only embed dashboards that have been published in the current workspace.
Circular references are not supported. If a circular reference occurs, an error is reported on the editor page, and the content causing the reference is automatically hidden in preview and published modes. For example, if Dashboard A references Dashboard B, and Dashboard B references Dashboard C, then Dashboard C cannot reference Dashboard A or B, and Dashboard B cannot reference Dashboard A.
Prerequisites
You have activated DataV-Board 7.0, Professional Edition or higher.
You have planned and created the required dashboards.
Child dashboard: This is the dashboard that will be embedded. You must create, configure, and publish it first. For more information, see User guide.
Main dashboard: This is the dashboard where you will perform the embedding operation. You can create it as needed by using a template, using a blank canvas, or using AI to generate it.
Procedure
Follow these steps to embed a child dashboard into a main dashboard.
In the main dashboard, you can add and configure other widgets in addition to embedding child dashboards. The process is the same as for a standard dashboard and is not detailed here. For more information, see Configure a data dashboard.

Step 1: Embed a child dashboard
Go to the canvas editor of the main dashboard.
Access the DataV console.
-
On the Workbench page, in the Data Dashboards area, hover over the target dashboard and click Edit. The canvas editor opens.
Embed the child dashboard.
In the navigation pane on the left of the canvas editor, click Dashboard Embedding. Hover over the target dashboard and click Add to Canvas to embed it into the main dashboard.
NoteThe Dashboard Embedding area displays only published dashboards from the current workspace. By default, the latest published version of the selected dashboard is embedded.
Circular references are not supported. If a circular reference occurs, an error is reported on the editor page, and the content causing the reference is automatically hidden in preview and published modes. For example, if Dashboard A references Dashboard B, and Dashboard B references Dashboard C, then Dashboard C cannot reference Dashboard A or B, and Dashboard B cannot reference Dashboard A.
You can click the
 icon to switch project groups or click the icon to search for a dashboard by name.
Step 2: Configure the child dashboard
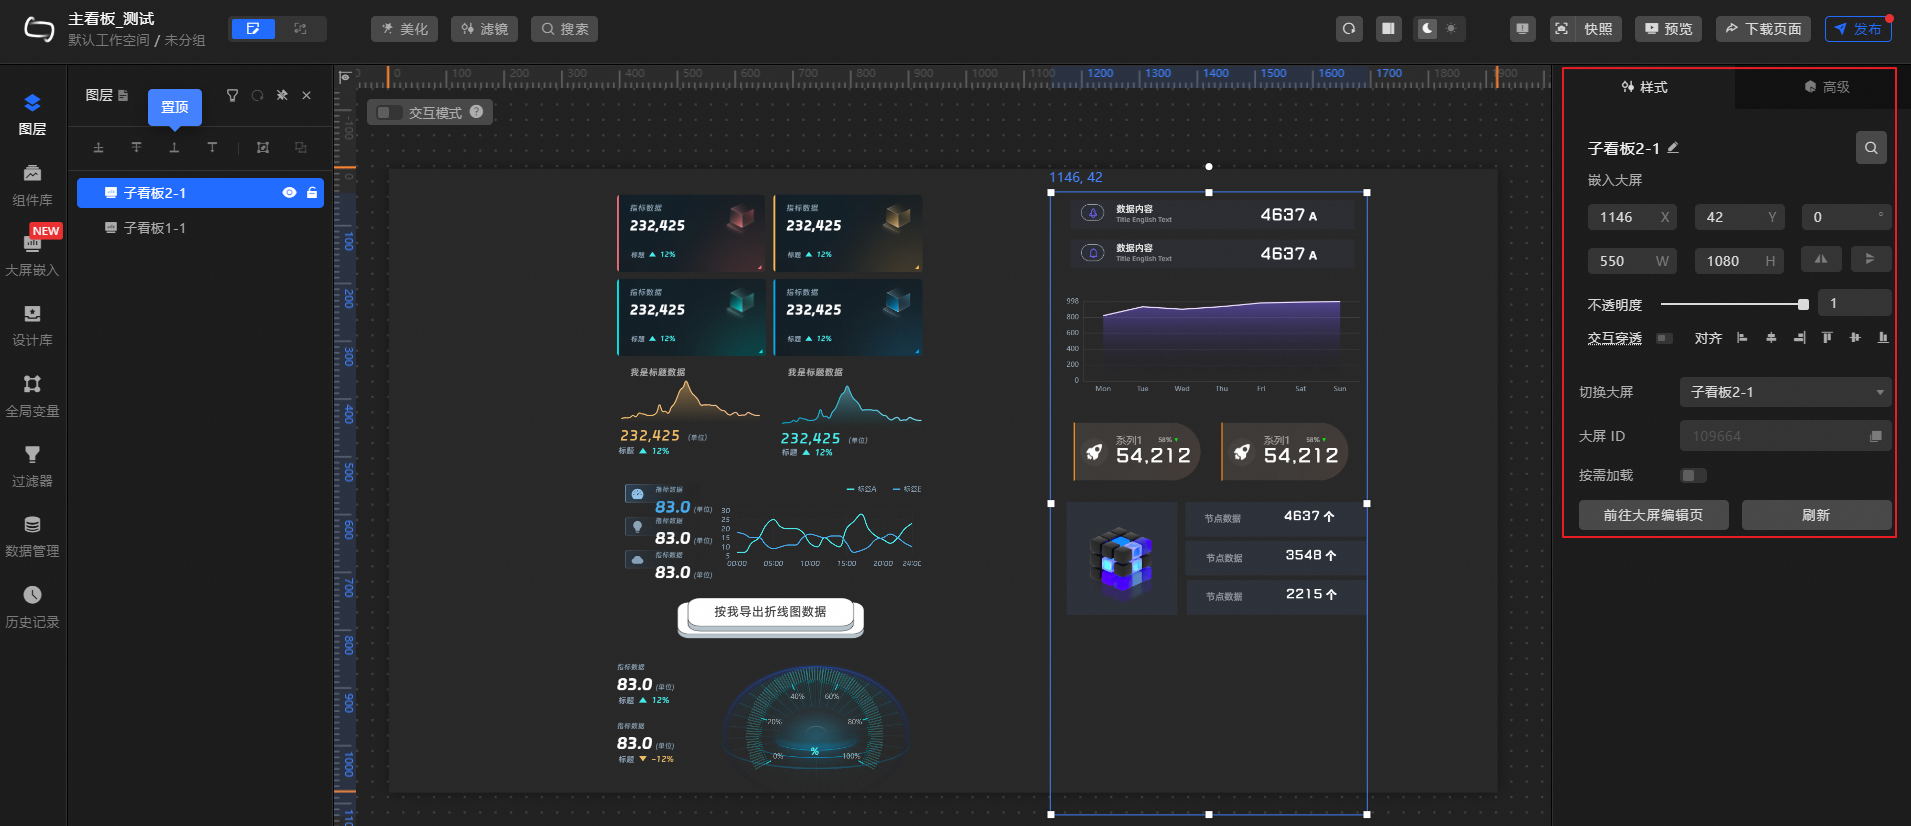
After a child dashboard is embedded, it appears as a single layer in the main dashboard. You can configure its style and advanced interactions as needed.
Style configuration
Click the child dashboard. In the Style tab on the right, you can configure the dashboard's position, opacity, ID, and other settings.
You can also click the  icon to search for a configuration item by keyword. The search supports fuzzy matching.
The following describes the related configuration items.
Configuration Item |
Description |
Global Configuration |
Defines the position, opacity, and interaction pass-through of the child dashboard in the main dashboard.
|
Switch to Dashboard |
Quickly switch between published dashboards in the current workspace. After switching, the display area of the current child dashboard is replaced by the selected dashboard. |
Dashboard ID |
Automatically generated by the system and cannot be edited. It can be used later for interaction configuration. |
On-demand Loading |
If you enable this feature, the current child dashboard is not displayed when you preview or publish the main dashboard.
Note
You can then use a blueprint to load the child dashboard content. This loading process is considered a cold start (the system restarts from an initial state).
|
Go to Dashboard Editor |
Click to go to the canvas editor of the current child dashboard, where you can edit its content. |
Refresh |
When the content of the child dashboard changes, use this to get the latest content. |
Advanced configuration
Click the child dashboard. In the Advanced tab on the right, you can define interactions and data transfer relationships between the child dashboard and other widgets or child dashboards. The following table describes the configuration items.
Configuration Item |
Description |
Illustration |
Interaction Events |
Define interaction behaviors with other child dashboards or widgets to create filter interactions. Click the |
|
Associate Global Variables |
You can associate global parameters in the child dashboard to pass parameters between dashboards or widgets for interaction. Click the Enable Emit Data to pass the dashboard data to the corresponding global variable by default. For more information about the configuration, see Configure interactions. |
 icon to define interaction events and actions.
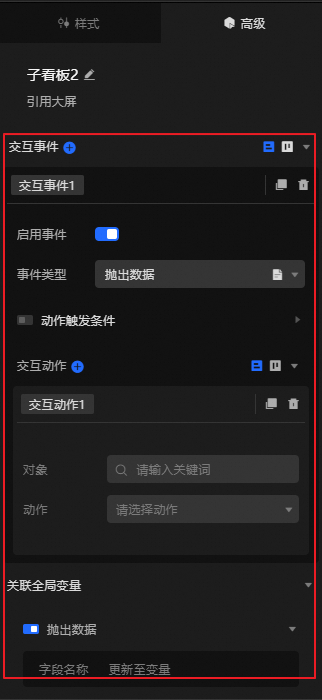
 icon to enable the corresponding instruction and associate it with the required
 Step 3: Configure blueprint interactions
You can use blueprint interactions to enable data interactions or event pass-through between widgets and child dashboards and between different child dashboards.
Procedure
In the canvas editor, click the
icon in the top menu bar to open the blueprint editor.In the layer node list, hover over the target dashboard or widget and click the
icon to add it to the blueprint canvas.Connect the nodes to configure the blueprint interaction relationships and behavior logic.
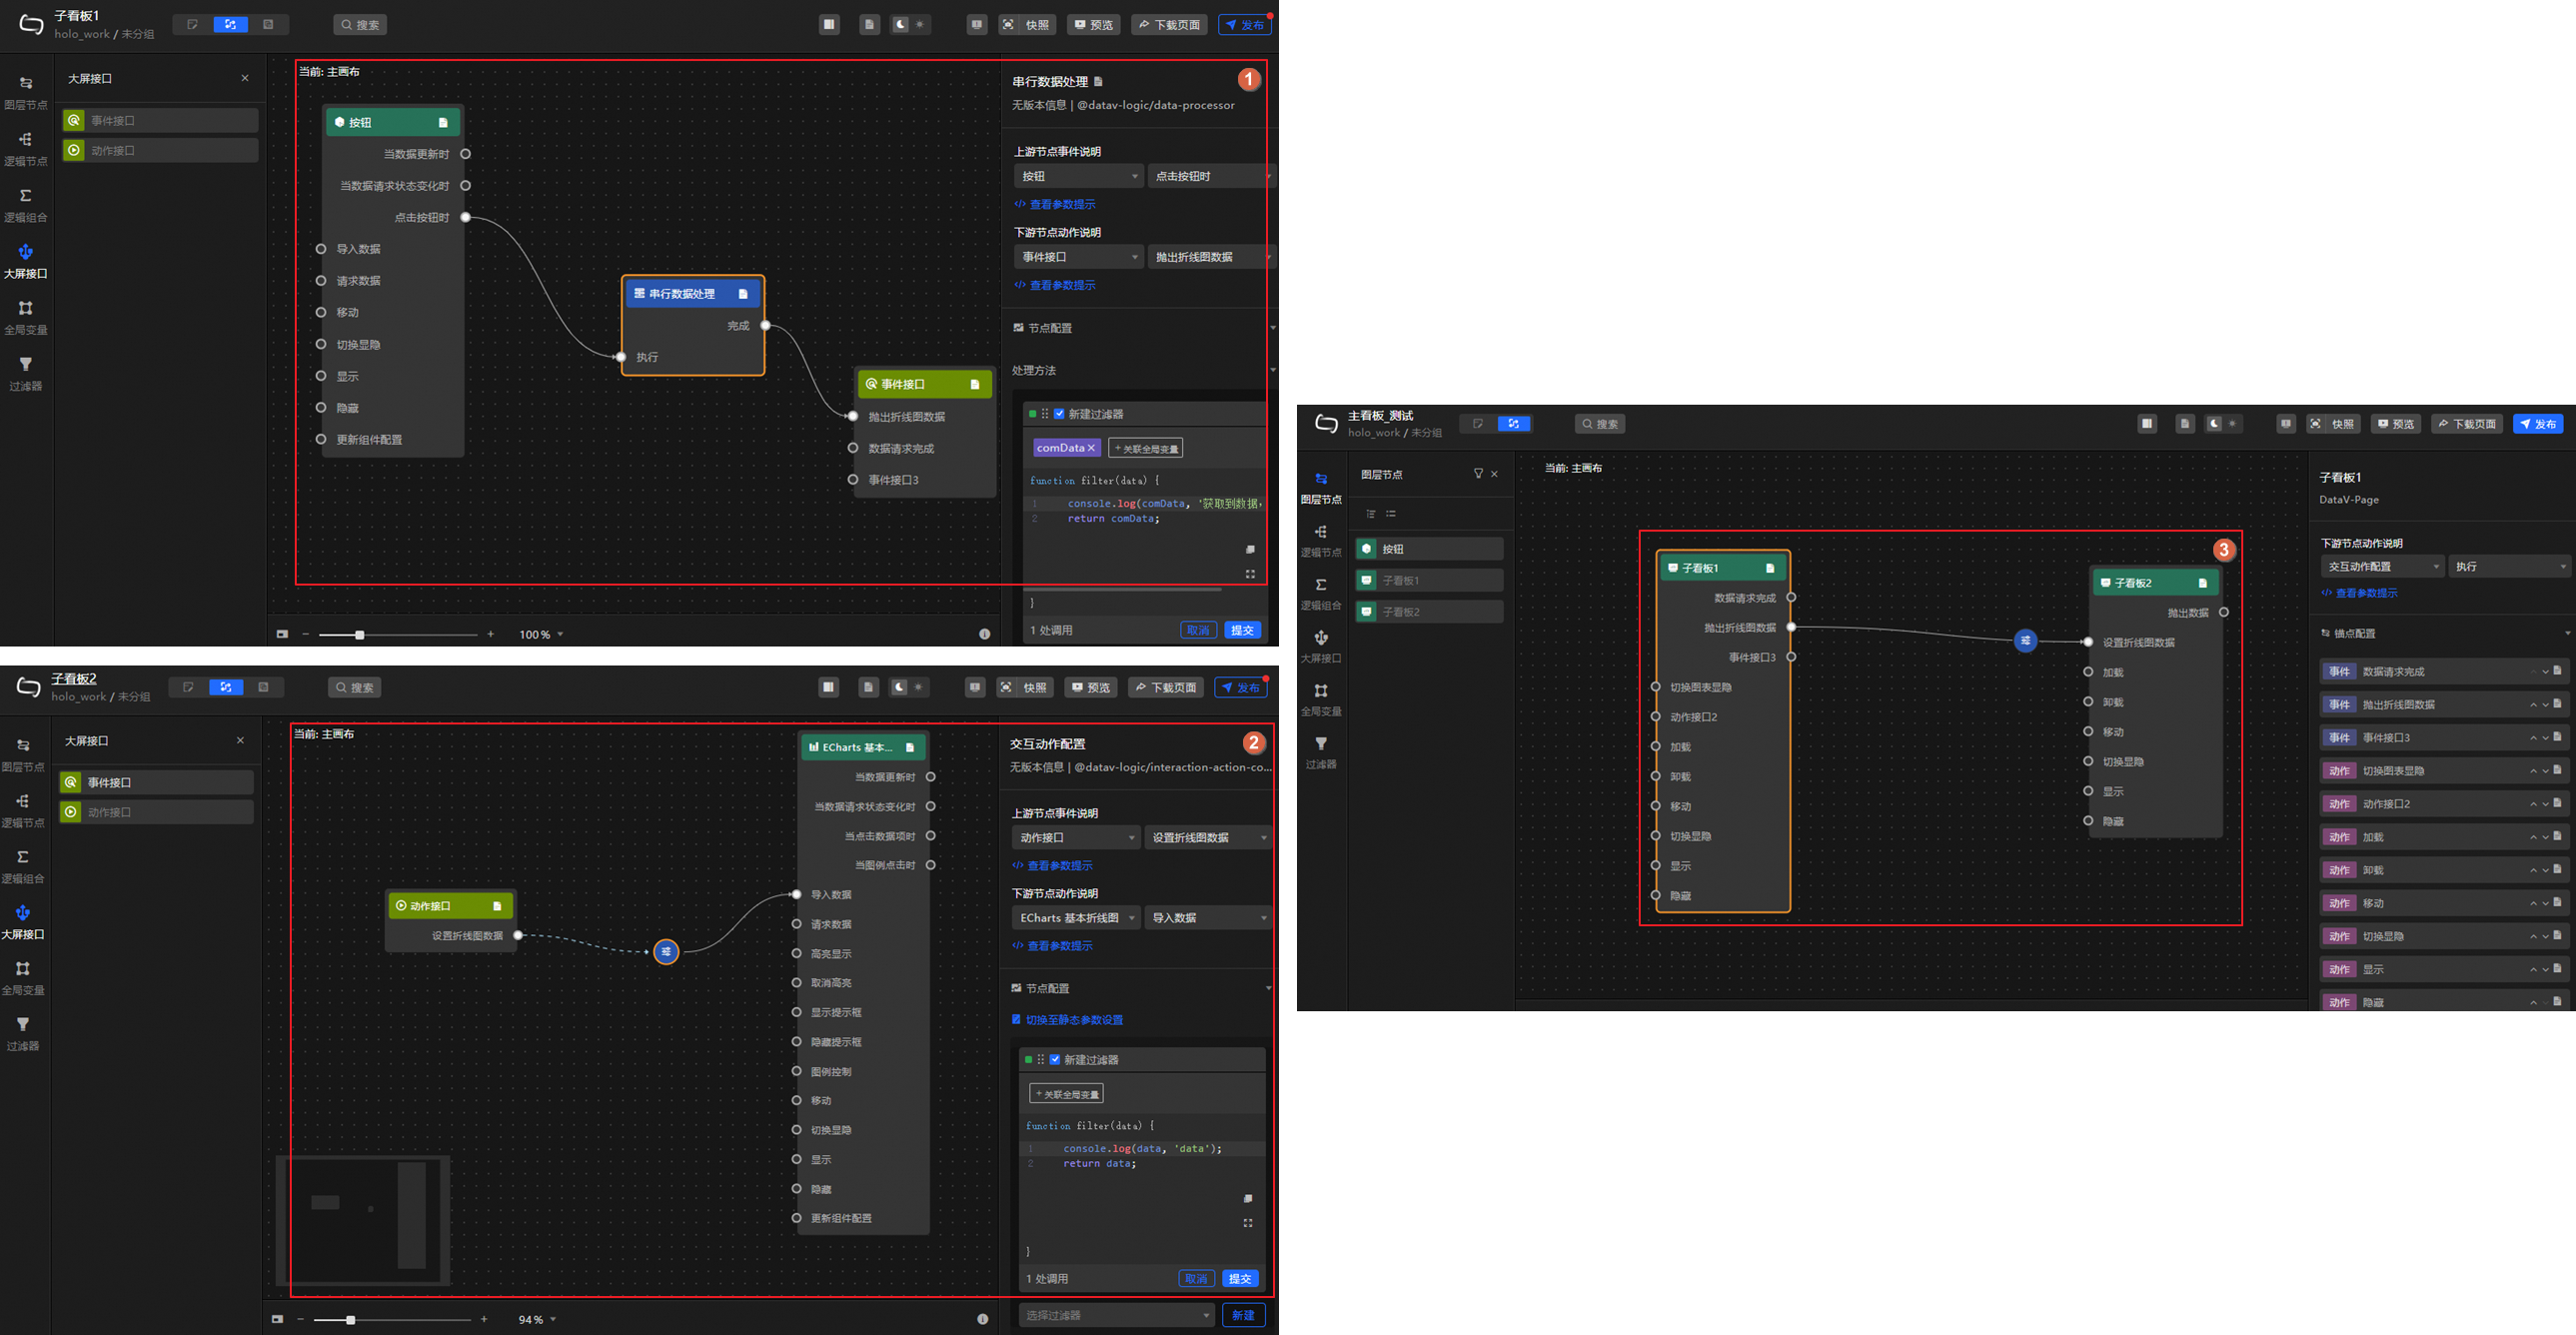
Example 1: Widget interacts with a child dashboard. When a button is clicked, Child Dashboard 1 is loaded.
Example 2: Interaction between child dashboards.
Child Dashboard 1: Defines the Emit Line Chart Data Event. This event is configured to emit the line chart data from Child Dashboard 1 when a button is clicked.
Child Dashboard 2: Defines the Set Line Chart Data Action. When this action is triggered, it imports the received data into the line chart of Child Dashboard 2.
Main Dashboard: Through blueprint interaction, when Child Dashboard 1 triggers the Emit Line Chart Data Event, Child Dashboard 2 executes the Set Line Chart Data Action. This process transfers the line chart data from Child Dashboard 1 to Child Dashboard 2, enabling data transfer between dashboards.
 icon in the top menu bar to open the blueprint editor.
 icon to add it to the blueprint canvas.
Configuration items
For dashboard embedding APIs, you can define custom events and actions in addition to the default system actions.
In the blueprint configuration interface, you can click the  icon next to an action or event to view detailed information about its parameters.
Use custom APIs
Custom APIs are typically used for interactions between child dashboards. First, you define the required events or actions in the blueprint editor of a child dashboard. Then, you configure the interactions between the child dashboards in the blueprint editor of the main dashboard.
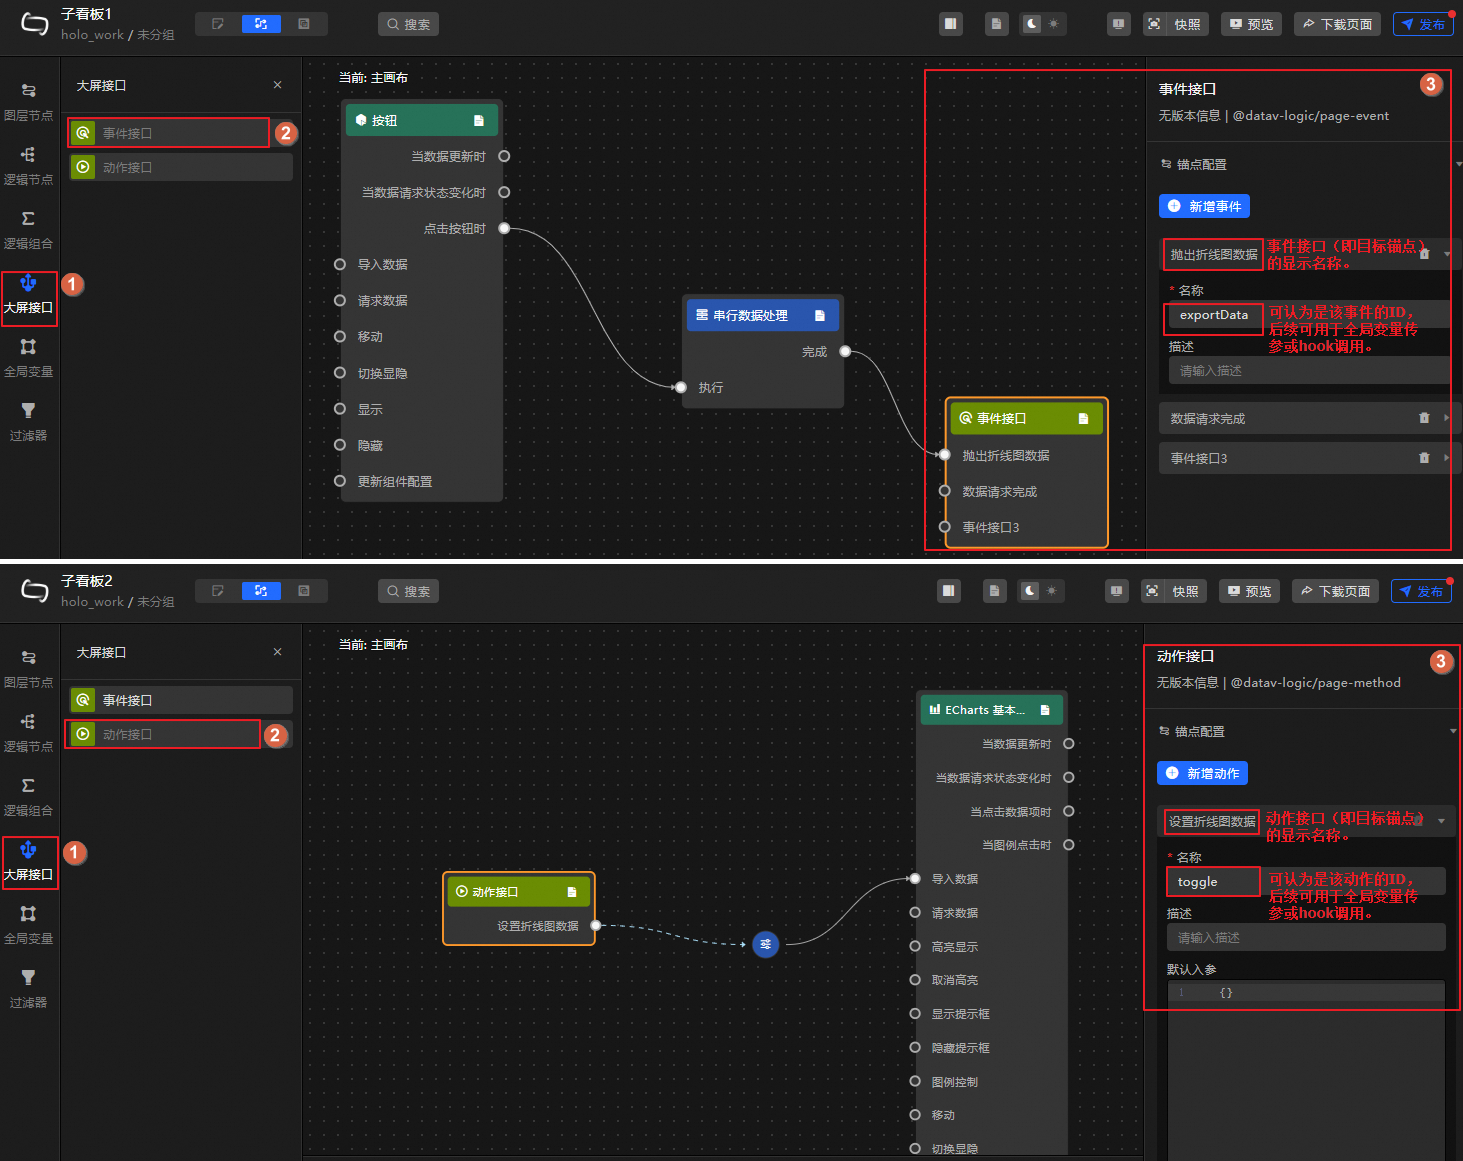
Define APIs in the child dashboard.
Go to the blueprint editing page for the data dashboard.
In the navigation pane on the left, click Dashboard API and define the required actions or events.
ImportantYou can add multiple events or actions. If you change a defined event or action API, for example, by renaming it, the corresponding interaction in the blueprint may become invalid. You must then reconfigure the interaction.
You can configure the data processing logic for events or actions, such as serial data processing, to meet your business needs.
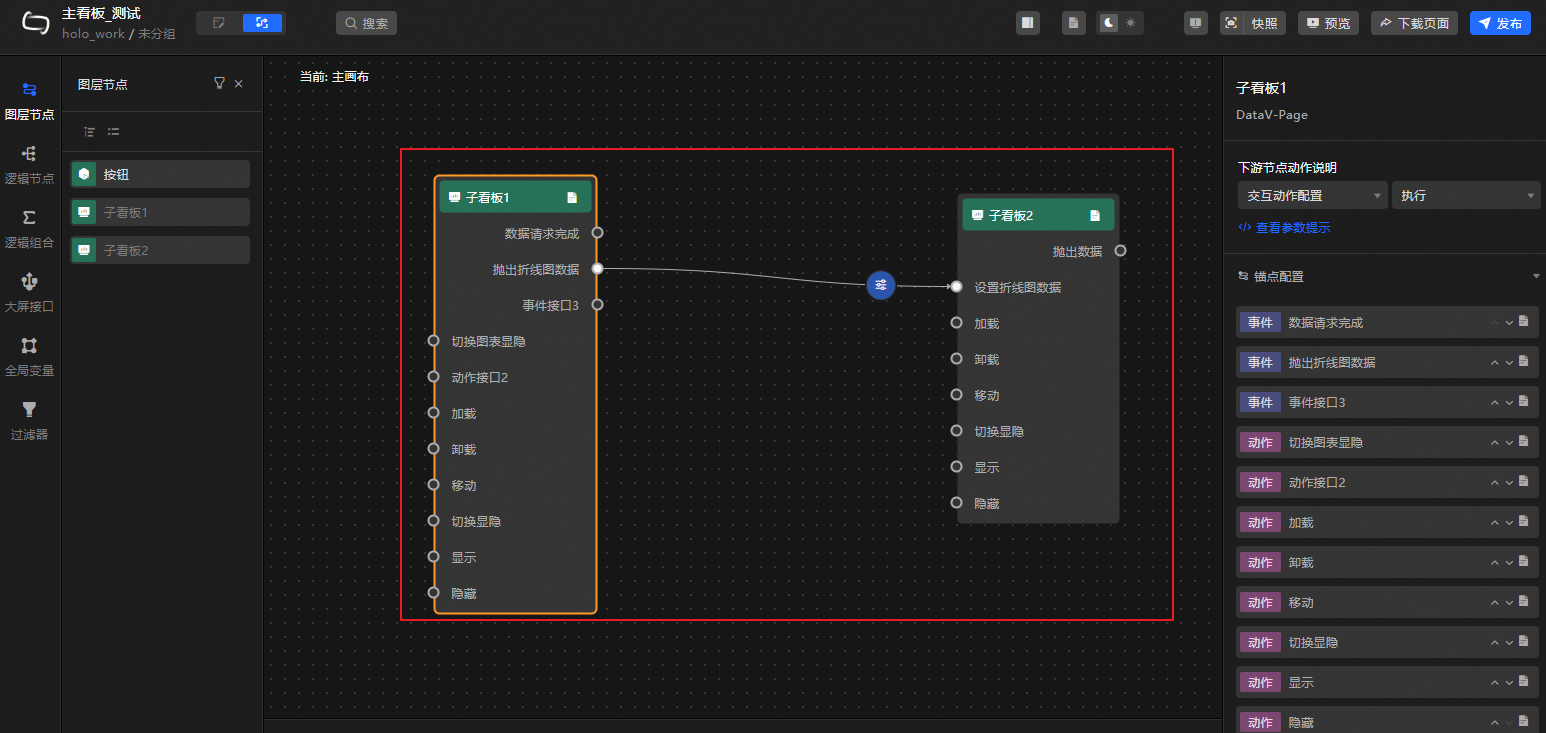
Implement interactions in the main dashboard.
Go to the blueprint editor of the main dashboard and connect the nodes to configure the interaction logic between the child dashboards.
Step 4: Preview and publish the main dashboard
After you configure the main dashboard, click Preview in the upper-right corner of the editor to see the result. You can then publish the dashboard and deploy it to the relevant devices.
View reference relationships
You can view the reference relationships of a dashboard in two ways. You can click the editor page or published page links to quickly navigate to the content.
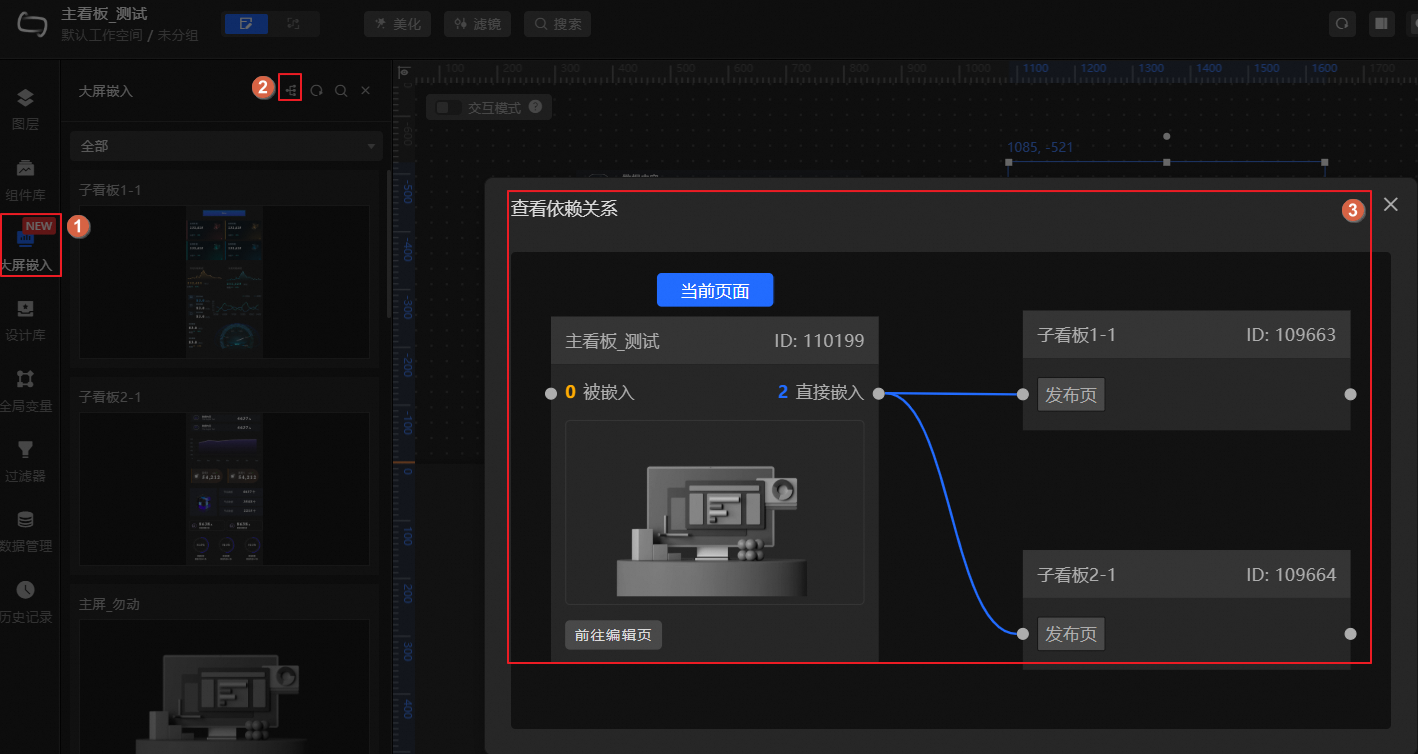
Method 1: View in the canvas editor
NoteThis method only lets you view reference relationships from the main dashboard.
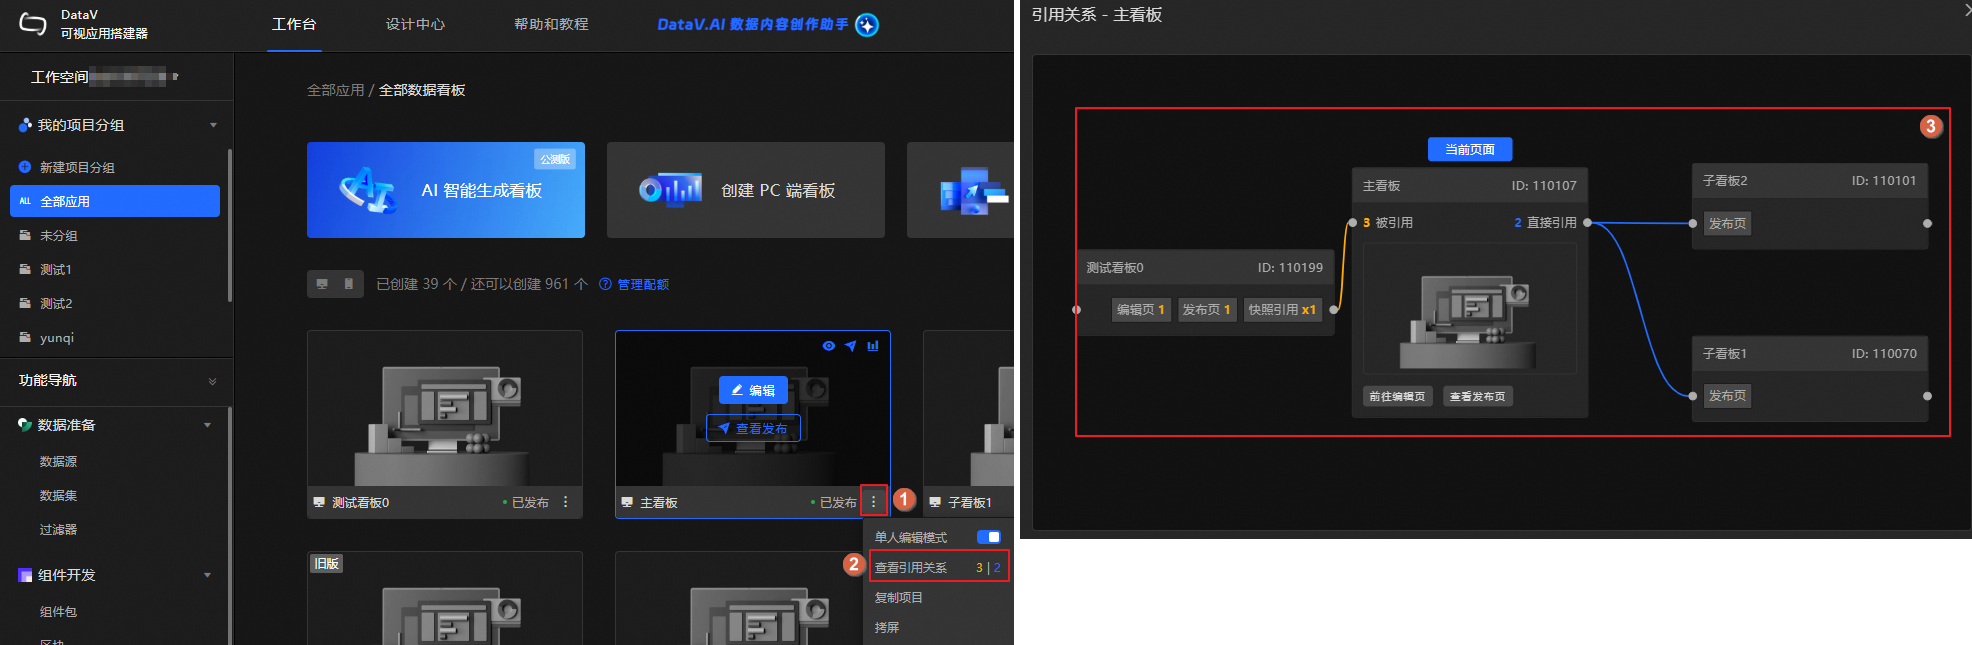
Method 2: View on the Workbench page
NoteThis method lets you view reference relationships from either the main dashboard or a child dashboard. If the main dashboard has snapshots, the child dashboard's reference count includes the main dashboard's editor page, published page, and any snapshot pages.
Dashboard management
Log on to the DataV console. In the area, you can click the  icon to perform management operations, such as copying, deleting, or transferring a dashboard. The following table describes the management operations for dashboards that use the embedding feature.
Operation |
Description |
Notes |
Copy Dashboard |
When you copy a main dashboard, the system automatically creates a replica. This replica also maintains the reference relationship with the child dashboards. |
Not applicable |
Copy and Transfer |
When you copy a main dashboard for another user, you can choose whether to also copy the child dashboards embedded in it. |
If the total number of dashboards (number of main dashboards + number of child dashboards + number of existing dashboards in the destination workspace) exceeds the maximum number of dashboards supported by the destination workspace, the copy operation fails. |
Copy to Workspace |
When you copy a main dashboard to another workspace, the child dashboards embedded in it are also copied. |
|
Delete Dashboard |
Before deleting a dashboard, unpublish it first.
|
Important
The delete operation cannot be undone. Proceed with caution. |
Example
Introduction
This example provides a complete, end-to-end process. It shows how to embed two child dashboards, Child Dashboard 1 and Child Dashboard 2, into a main dashboard to achieve the following effects:
Centrally display two child dashboards in the main dashboard.
Click a button in Child Dashboard 1 to transfer its line chart data to the line chart in Child Dashboard 2.
Add four button widgets to the main dashboard to control the loading and unloading of Child Dashboard 1 and Child Dashboard 2.
Follow the instructions below to configure the child dashboards and the main dashboard.
Create and configure Child Dashboard 1
Create the data dashboard.
Access the DataV console.
Click . On the blank dashboard card, click + Create Dashboard. Follow the on-screen instructions to create a dashboard and name it Child Dashboard 1. After creation, you are automatically taken to the canvas editor.
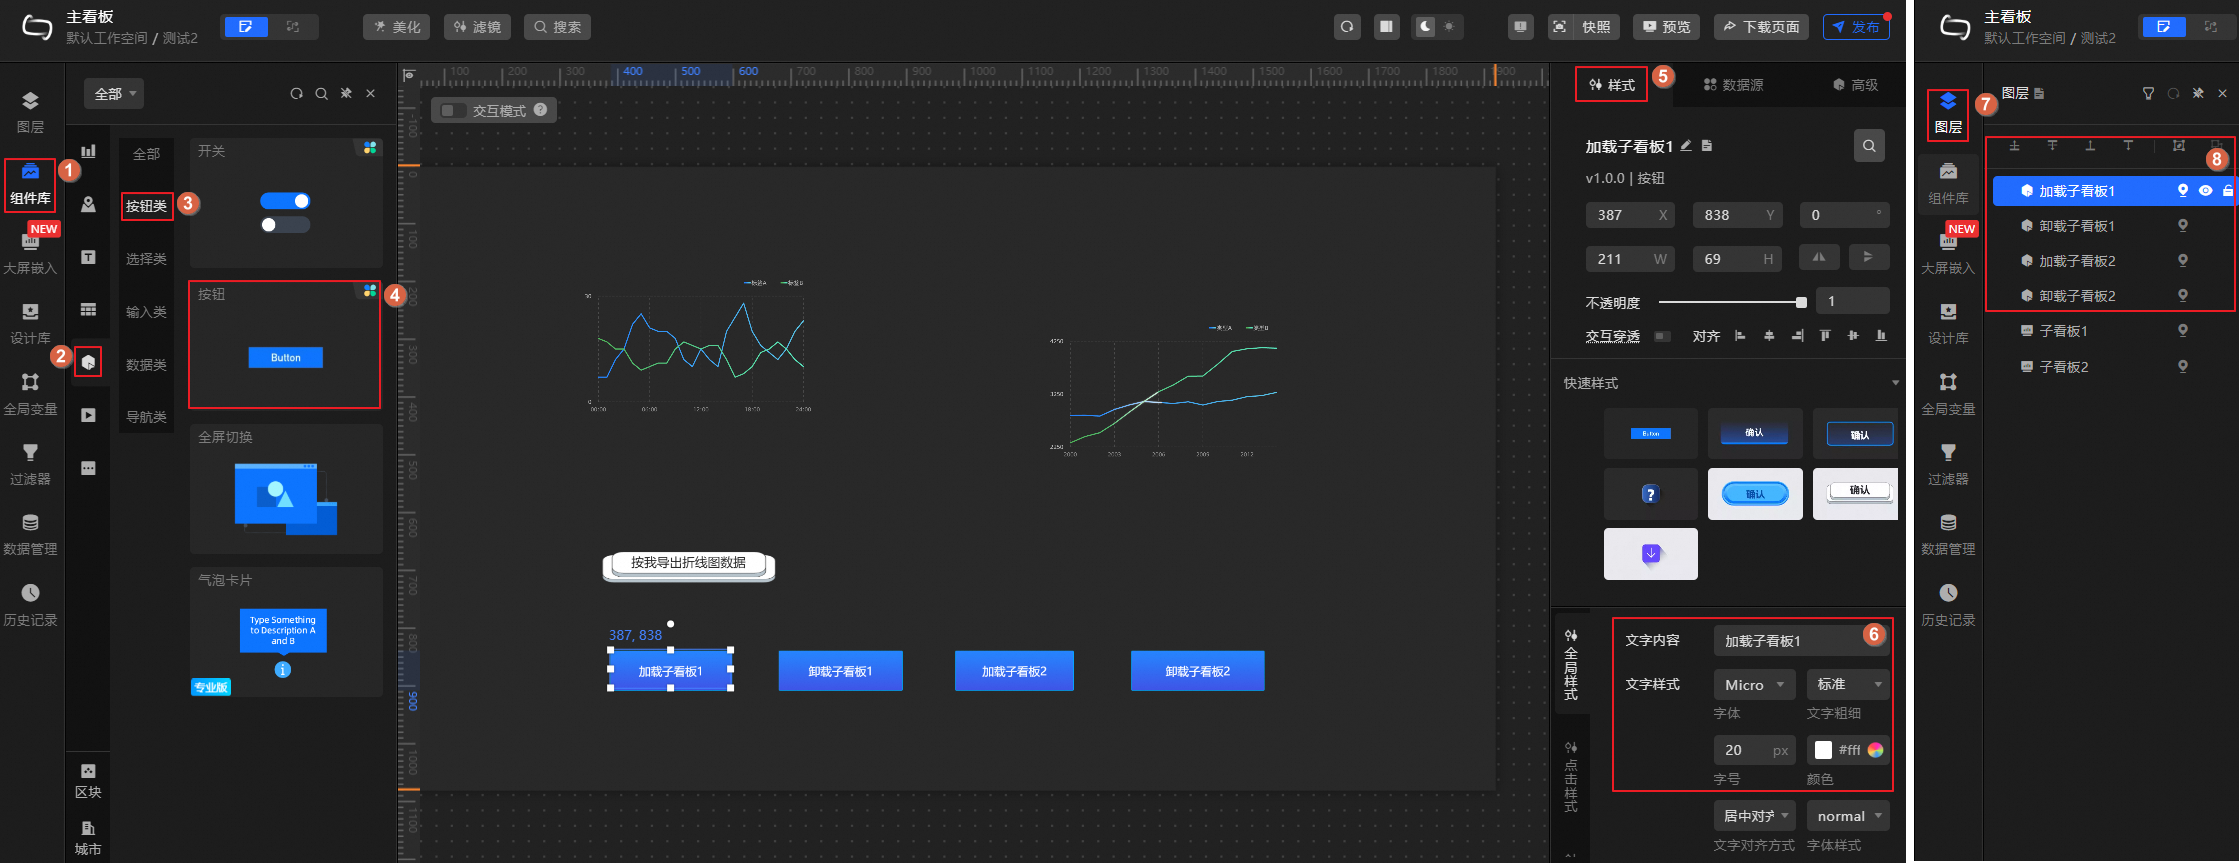
Add and configure widgets.
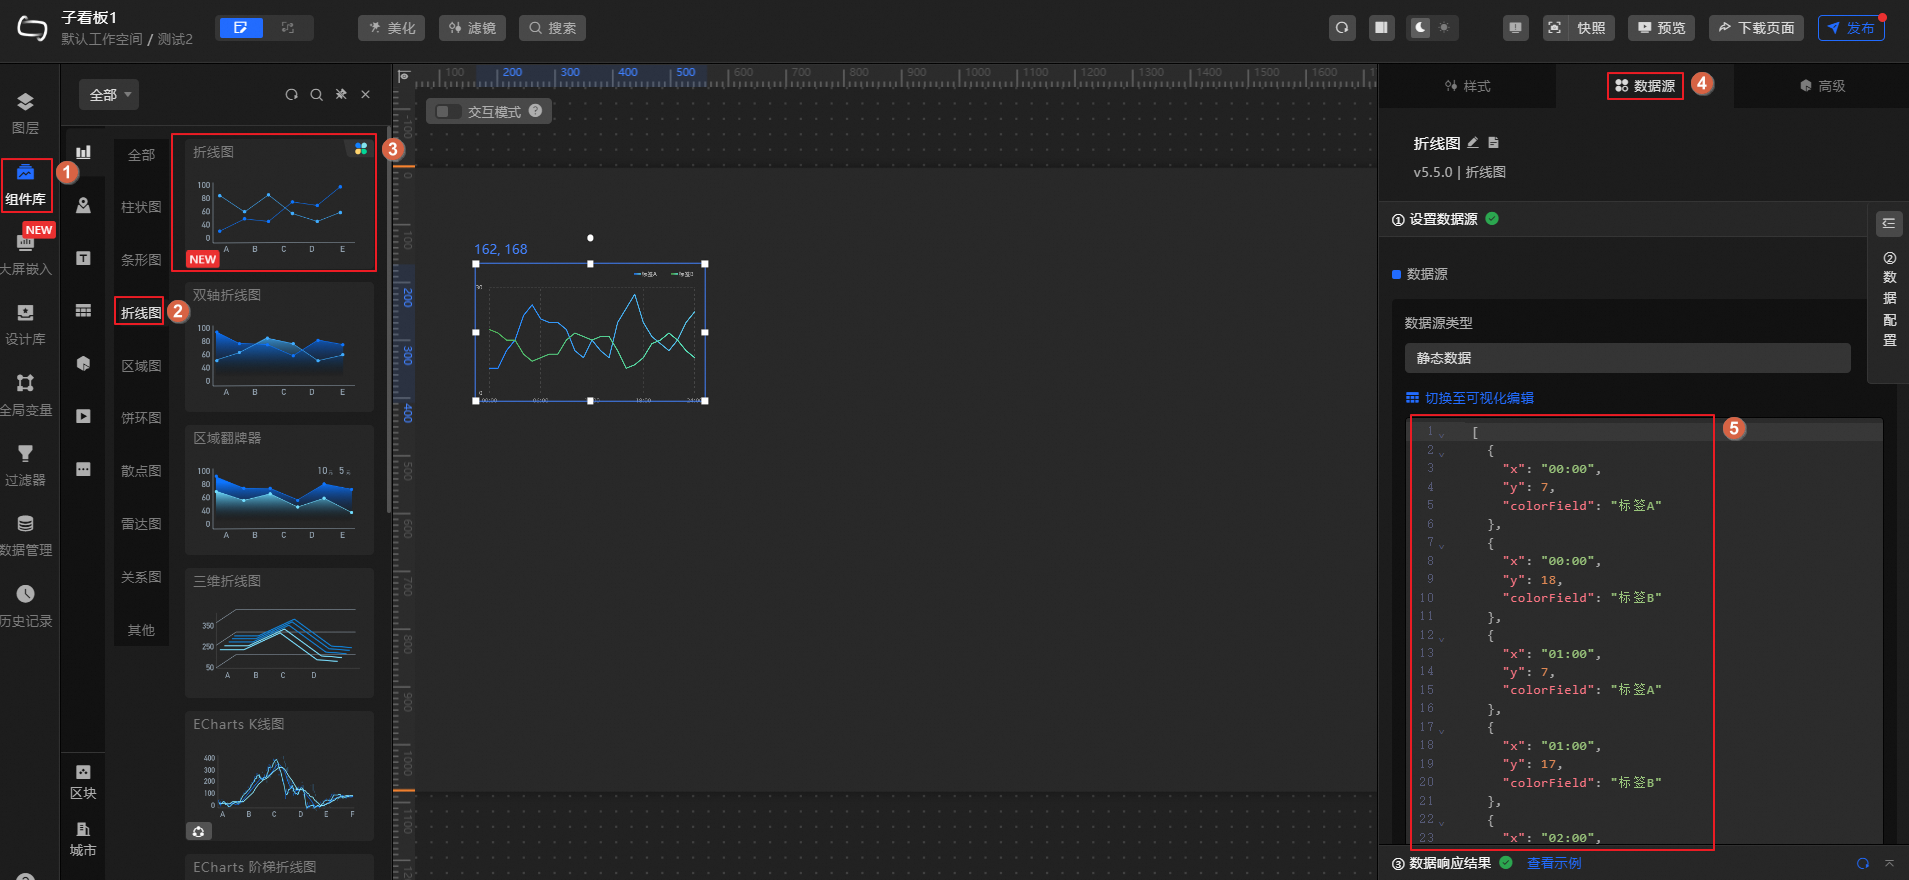
In this step, you will add a line chart and a button widget to be used for interaction later.
Follow the steps in the figure to add a line chart and replace its data with the test data.
Follow the steps in the figure to add a button and change its style as needed.
Configure widget blueprint interactions.
In this step, you will use a global variable and the dashboard embedding event API to facilitate data transfer. First, pass the line chart data to the global variable comData. Then, define a dashboard embedding event named Emit Line Chart Data. This event is triggered when the button is clicked, retrieving the data from the comData global variable and emitting it. You can use this event later to transfer data to Child Dashboard 2.
In the upper-left corner of the canvas editor, click the
icon to open the blueprint editor.Add widgets to the canvas.
On the Layer Nodes tab on the left, hover over a widget and click the
icon to add it to the blueprint canvas.Use this operation to add the line chart and button widgets to the canvas.
Create and add a global variable.
Follow the steps in the figure to create the global variable comData. After it is created, hover over the variable name and click the
icon to add the global variable to the blueprint canvas.Add a data processing node.
On the Logic Nodes tab on the left, hover over the Serial Data Processing node and click the
icon to add the node to the blueprint canvas.Create and add a dashboard embedding event.
Follow the steps in the figure to create and add the Emit Line Chart Data event to the canvas.
Connect the nodes as shown in the figure and configure the serial data processing node to retrieve the global variable data.
In the upper-right corner of the blueprint editor, click Publish to publish Child Dashboard 1.

 icon to open the blueprint editor.
 icon to add the global variable to the blueprint canvas.
Create and configure Child Dashboard 2
Create the data dashboard.
Access the DataV console.
Click . On the blank dashboard card, click + Create Dashboard. Follow the on-screen instructions to create a dashboard and name it Child Dashboard 2. After creation, you are automatically taken to the canvas editor.
Follow the steps in the figure to add a line chart to the canvas for later interaction.
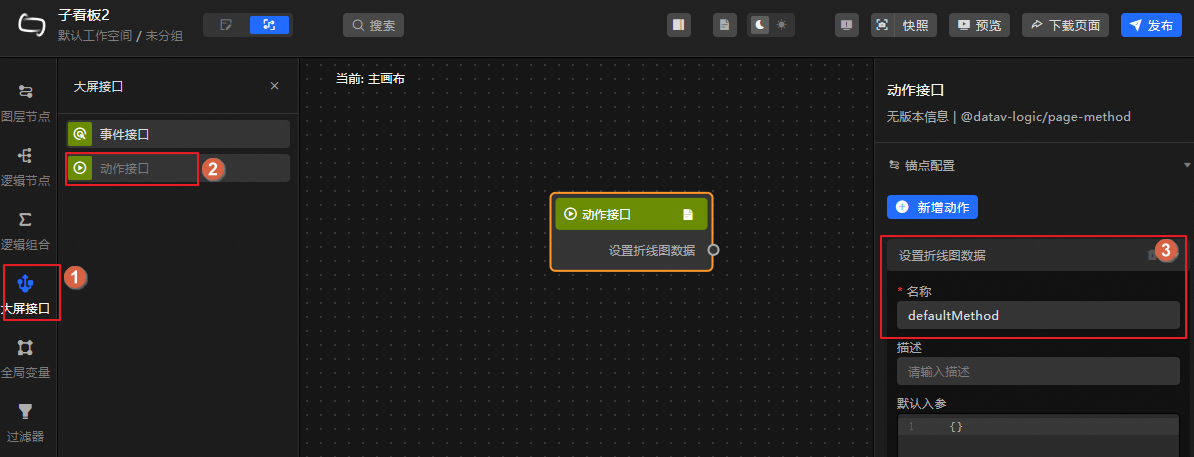
Define the dashboard embedding action API and configure interactions.
In this step, you will define a custom action named Set Line Chart Data. This action will interact with the Emit Line Chart Data event from Child Dashboard 1. It transfers the data emitted by the event to the line chart in Child Dashboard 2.
In the upper-left corner of the canvas editor, click the
icon to open the blueprint editor.Add the widget to the canvas.
On the Layer Nodes tab on the left, hover over the line chart widget and click the
icon to add it to the canvas.Create and add the dashboard embedding action API.
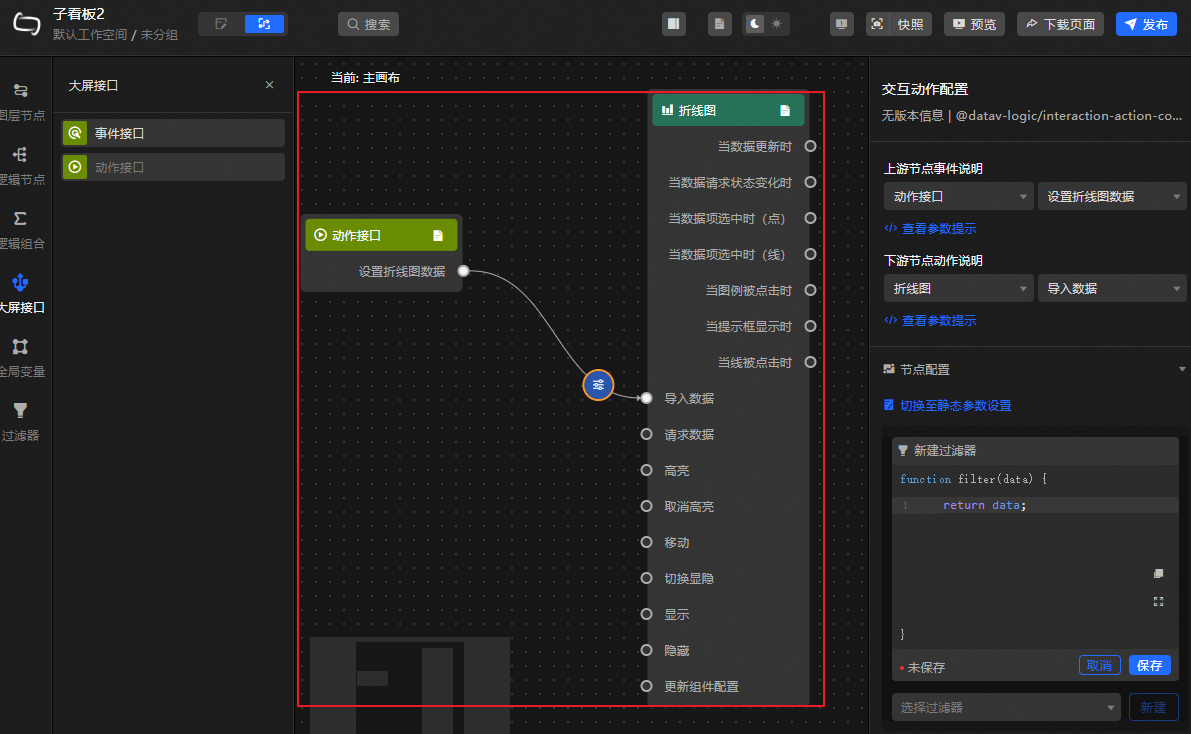
Follow the steps in the figure to create and add the Set Line Chart Data action to the canvas.
Connect the nodes as shown in the figure to import the data received by the action API into the line chart.
In the upper-right corner of the blueprint editor, click Publish to publish Child Dashboard 2.
Create and configure the main dashboard
Create the data dashboard.
Access the DataV console.
Click . On the blank dashboard card, click + Create Dashboard. Follow the on-screen instructions to create a dashboard and name it Main Dashboard. After creation, you are automatically taken to the canvas editor.
Embed child dashboards and add button widgets.
Embed child dashboards: Follow the steps in the figure to embed Child Dashboard 1 and Child Dashboard 2 into the main dashboard. This centrally displays the content of both child dashboards.
NoteAdjust the size of the child dashboards as needed to prevent layers from overlapping, which could cause functional errors.
Add widgets: Follow the steps in the figure to add four button widgets to the main dashboard and change their display names. These buttons will be used to control the loading and unloading of the child dashboards.
Configure blueprint interactions.
In the upper-left corner of the canvas editor, click the
icon to open the blueprint editor.On the Layer Nodes tab on the left, hover over the relevant nodes and click the
icon to add all nodes to the canvas.Connect the nodes as shown in the figure to configure interactions between the child dashboards and widgets.
Transfer the line chart data from Child Dashboard 1 to the line chart in Child Dashboard 2.
Use the button widgets to control the loading and unloading of the child dashboards.
In the upper-right corner, click Preview to see the effect on the main dashboard. You can adjust the dashboard content as needed.
In the upper-right corner, click Publish to publish the main dashboard.