The visual application center is a comprehensive data visualization management platform in DataV for centralized management and display of visualization studios and data dashboards.
Terms
Kanban
Kanban refers to data dashboards. The thumbnails of data dashboards published on the workspace page are displayed in the visual application center.
Presentation plan
A presentation plan is a sequenced display of data dashboards. You create a presentation plan by arranging data dashboards in order and configuring carousel and security settings. Project these plans to streamline data presentations and work reports.
Projection
Projection displays presentation plans on a large screen in slideshow format. Open the projection player and use the console for autoplay, page navigation, or share the console QR code with others to start the projection.
Function introduction
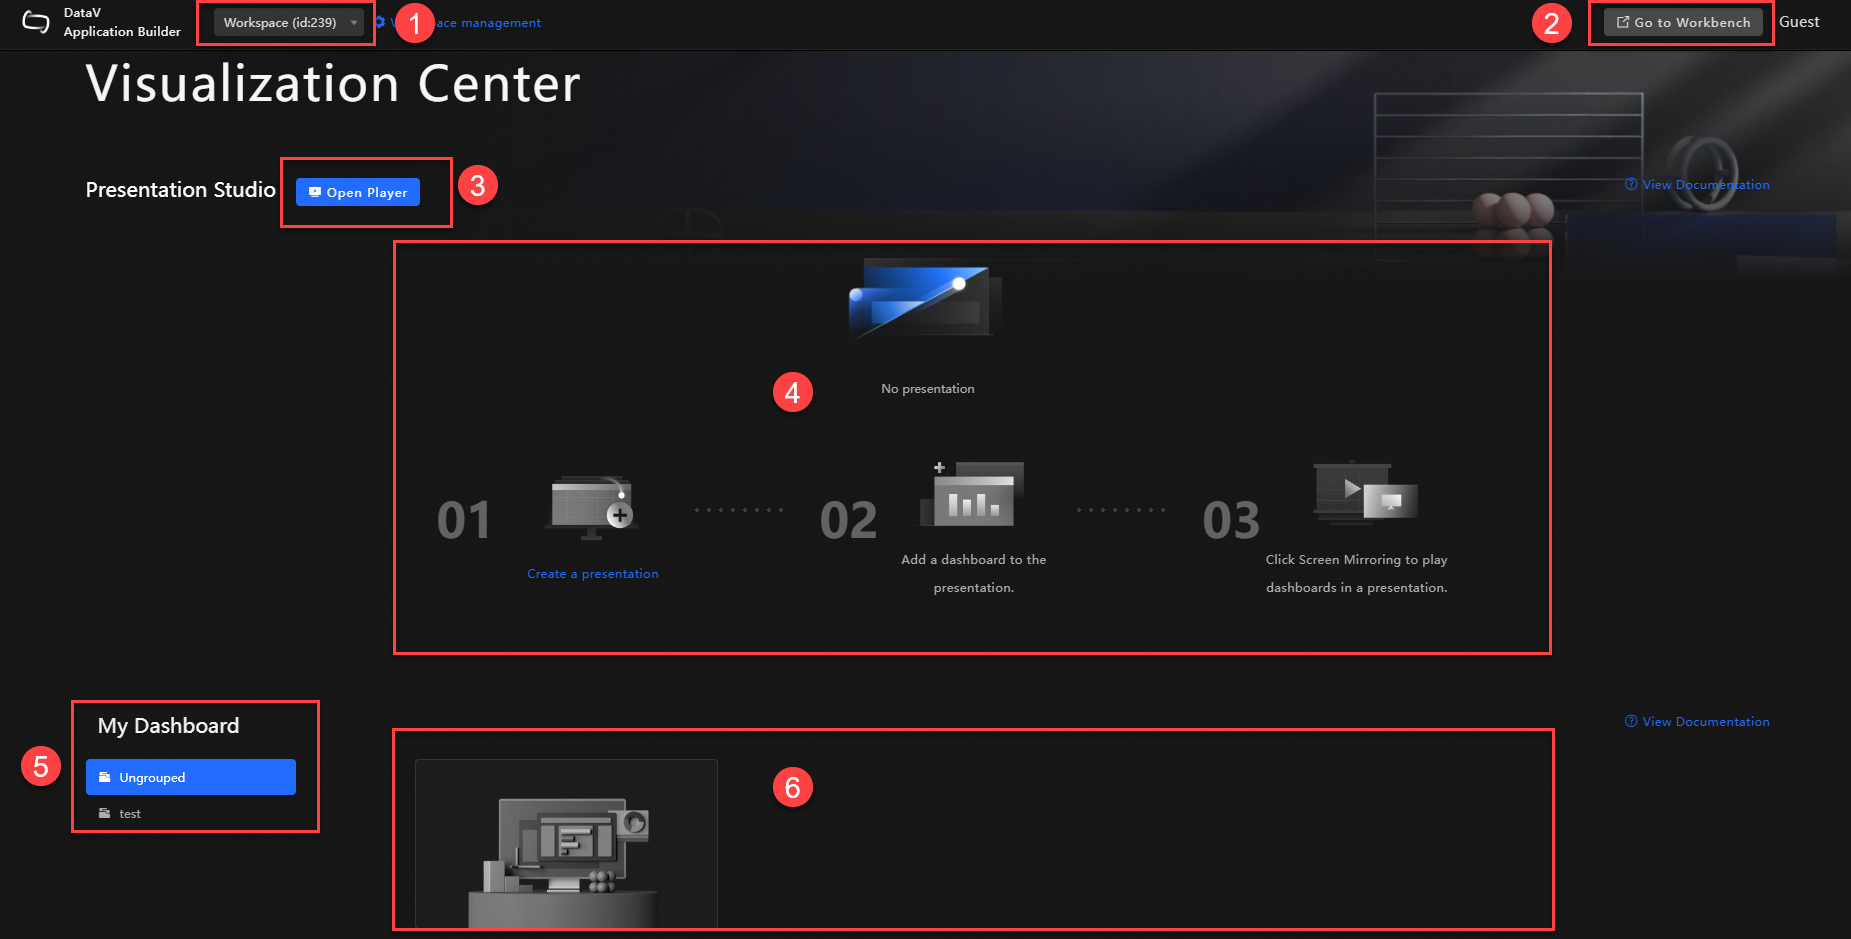
Visual application center
|
Ordinal number |
Name |
Description |
|
1 |
Workspace |
Switch workspaces to access different visual application centers. |
|
2 |
Go to workspace |
Navigate to the visualization workspace to edit your kanban. |
|
3 |
Open projection page |
Navigate to the projection player. Enter the projection code of the current page to project your kanban. |
|
4 |
Presentation plan display |
Displays the presentation plans in the current workspace. |
|
5 |
Kanban grouping |
Displays the grouping of data dashboards published from the workspace. |
|
6 |
Kanban display |
Displays the details of data dashboards published from the workspace. |
Visualization studio - Management page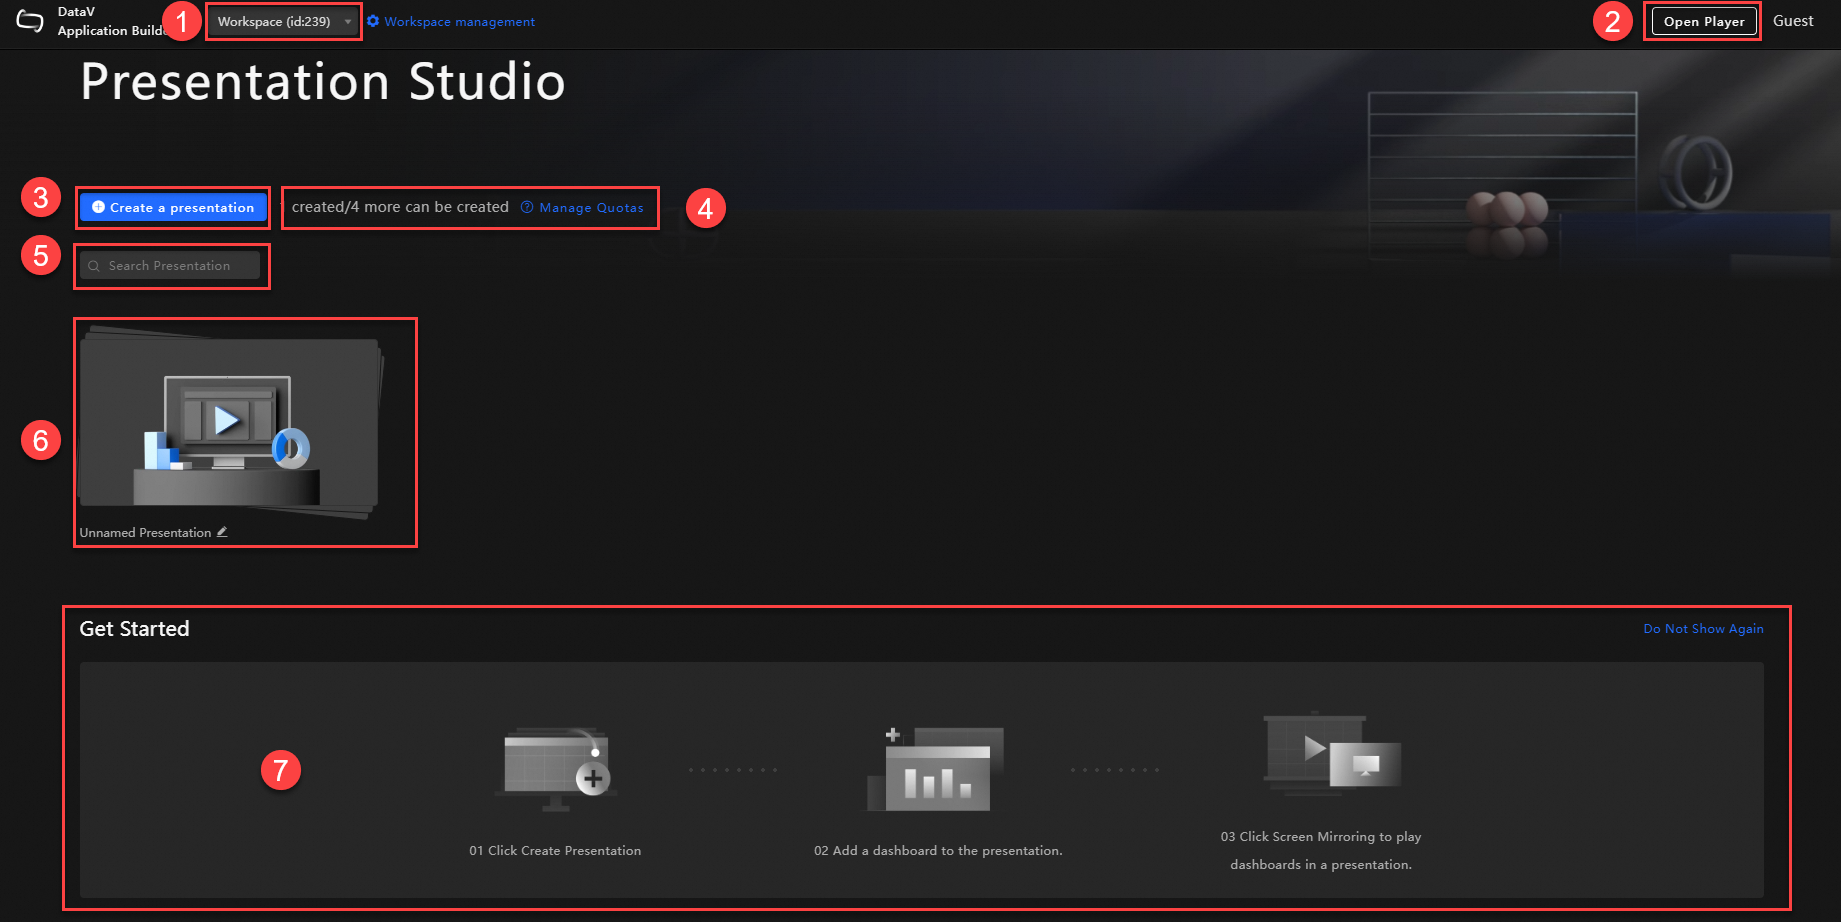
|
Ordinal number |
Name |
Description |
|
1 |
Workspace |
Switch workspaces to access different visualization studios. |
|
2 |
Open projection player |
Navigate to the projection player. Enter the projection code of the current page to view your kanban projection. |
|
3 |
Add presentation plan |
Navigate to the presentation plan creation page. Add published data dashboards to the presentation sequence, then configure carousel and security settings. |
|
4 |
Plan quota management |
Displays the number of plans created and the remaining quota in the current workspace. |
|
5 |
Search plans |
Enter a plan name to quickly find the plan you need. |
|
6 |
Manage plans |
Perform operations on created plans, such as projection, preview, edit, rename, and delete. |
|
7 |
Quick start |
Displays the basic steps for plan projection to help you get started quickly. |
Visualization studio - Quick preview page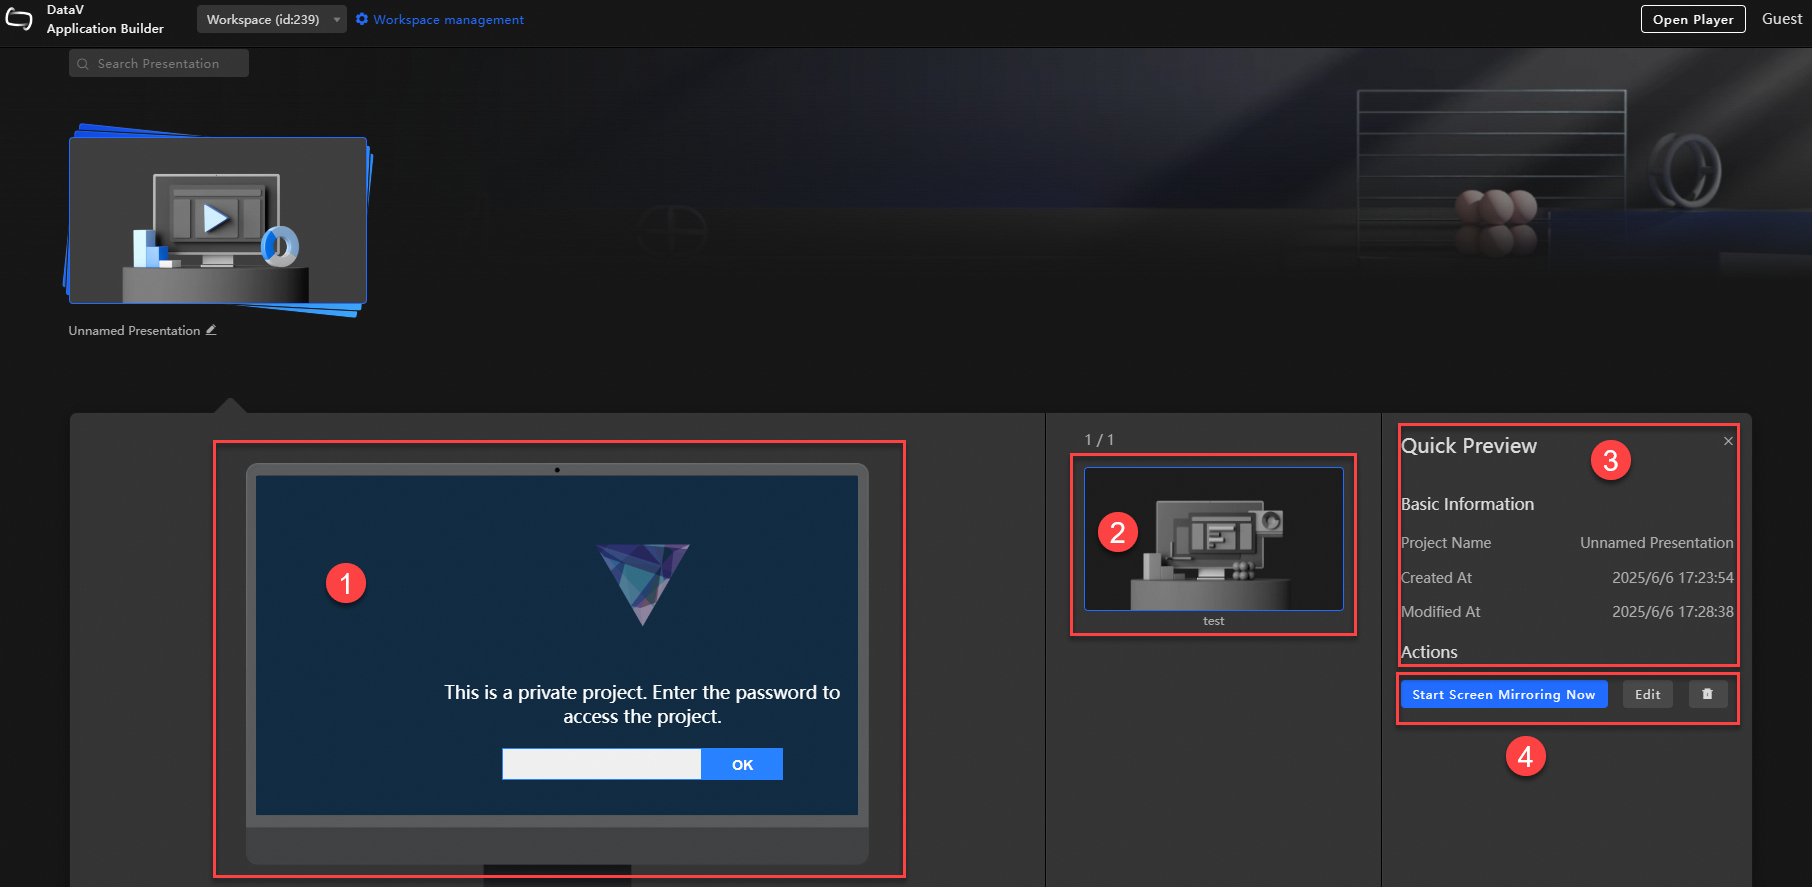
|
Ordinal number |
Name |
Description |
|
1 |
Kanban preview |
Preview the selected kanban by choosing it from the kanban sequence. |
|
2 |
Kanban sequence |
Select different kanbans to view in the preview area. |
|
3 |
Basic information |
Displays the basic information of the current plan, including the project name, creation time, and modification time. |
|
4 |
Plan operations |
Perform projection, edit, and delete operations on the selected plan. |
Visualization studio - Plan creation page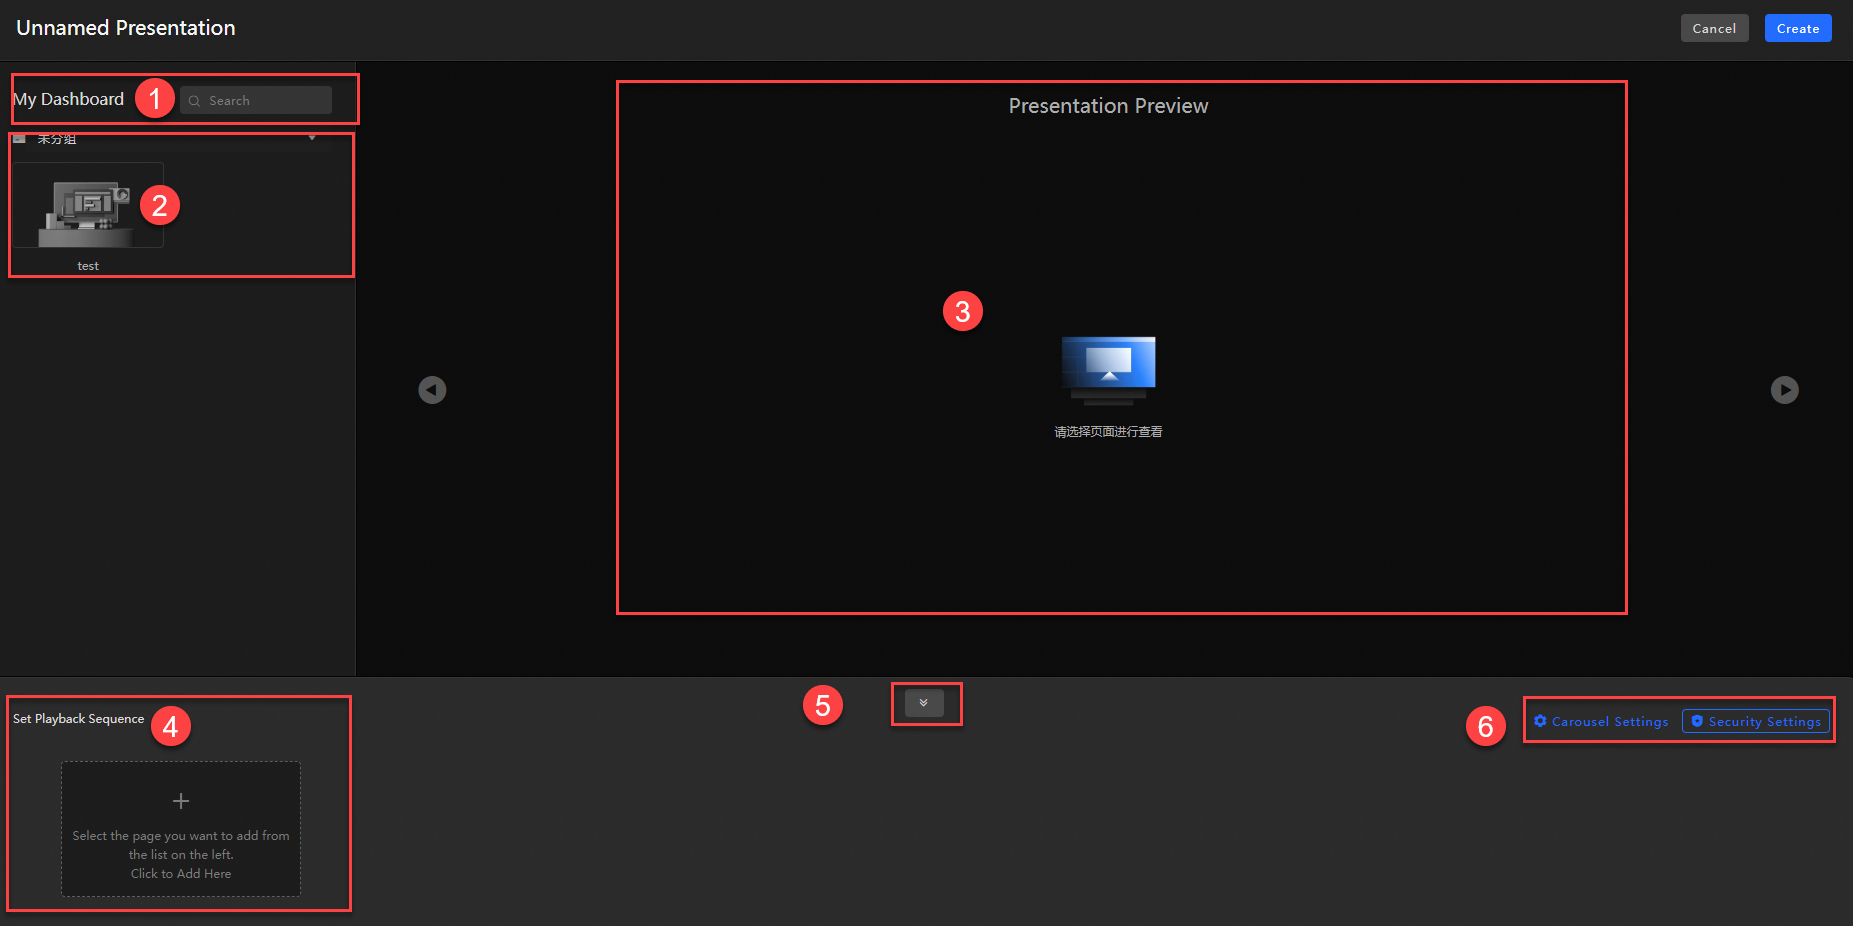
|
Ordinal number |
Name |
Description |
|
1 |
Search kanban |
Enter a kanban name or change the group to quickly find the kanban you need. |
|
2 |
My kanban |
Displays all kanbans in the current group. |
|
3 |
Plan preview |
Displays a preview of the data dashboard selected in the playback sequence. |
|
4 |
Playback sequence |
Displays the plan presentation sequence. Drag kanbans to reorder them, or remove kanbans from the sequence. |
|
5 |
Hide sequence |
Hide the playback sequence and toggle between left and right panels to immersively view the preview kanban. |
|
6 |
Carousel and security settings |
Configure the carousel interval for each kanban and set the control terminal password for projection. |
Visualization studio
Visualization studio is a data visualization presentation platform in DataV that supports plan creation, projection, and end-to-end management.
My kanban
Published data dashboards from the workspace are automatically displayed here. Unpublished data dashboards will not be shown. To modify a kanban, click Go To Workbench in the upper right corner of the visual application center, edit and publish it, then refresh the page for changes to take effect.
If no kanban exists, first create a data dashboard and publish it. You can then view it in My Dashboard.
-
Preview data dashboard: Hover over a data dashboard and click to view it in a new page.
-
View access statistics: Hover over a data dashboard and click the
 icon to view its access statistics.