In DataWorks, a data quality monitoring node lets you configure rules to monitor data quality in your data source tables, for example, by checking for dirty data. You can also define custom scheduling policies to periodically run validation tasks. This topic describes how to use a data quality monitoring node.
Background
The data quality feature in DataWorks detects changes in source data and identifies dirty data generated during the extract, transform, and load (ETL) process. It can automatically block problematic tasks to prevent dirty data from propagating to downstream nodes. This prevents unexpected data that can affect normal operations and business decisions. It also significantly reduces troubleshooting time and prevents wasted resource costs from task reruns. For more information, see Data quality.
Limitations
-
Supported table types: MaxCompute, E-MapReduce, Hologres, CDH Hive, AnalyticDB for PostgreSQL, AnalyticDB for MySQL, and StarRocks.
-
Table monitoring scope:
-
You can monitor only tables in a data source bound to the same workspace as the data quality monitoring node.
-
Each node can monitor only one table, but you can configure multiple monitoring rules for that table. The monitoring scope varies by table type:
-
For a non-partitioned table, the entire table is monitored by default.
-
For a partitioned table, you must use a partition filter expression to specify a partition to monitor.
NoteTo monitor multiple tables, create multiple data quality monitoring nodes.
-
-
-
Operation limits:
-
Data quality monitoring rules created in DataStudio can be run, modified, published, and managed only in DataStudio. You can view these rules in the Data Quality module, but you cannot manage them there.
-
If you modify the monitoring rules in a data quality monitoring node and then publish the node, the original monitoring rules are replaced.
-
Prerequisites
-
A business flow is created.
In DataStudio, development operations for different data sources rely on business flows. Therefore, you must create a business flow before you can create a node. For more information, see Create a business flow.
-
A data source must be created and bound to the current workspace, and the table to be monitored must exist in that data source.
Before you run a data quality monitoring task, create the table that you want to monitor in your data source. For more information, see Manage data sources, Manage compute engine resources, and Develop a node.
-
A resource group is created.
Data quality monitoring nodes can run only on a Serverless resource group. For more information, see Manage resource groups.
-
(Optional, for RAM users) The RAM user for task development must be added to the workspace and granted the Development or Workspace Administrator role. The Workspace Manager role has extensive permissions and should be granted with caution. For more information about adding members and granting permissions, see Add workspace members.
Step 1: Create a data quality monitoring node
Log on to the DataWorks console. In the target region, click in the left-side navigation pane. Select a workspace from the drop-down list and click Go to Data Development.
-
Right-click the target business flow and choose .
-
In the Create Node dialog box, enter a Name for the node and click OK. After the node is created, you can develop and configure the task on the node's configuration page.
Step 2: Configure data quality monitoring rules
1. Select table to monitor
Click Add Table. In the Add Table dialog box, search for and select the target table to monitor.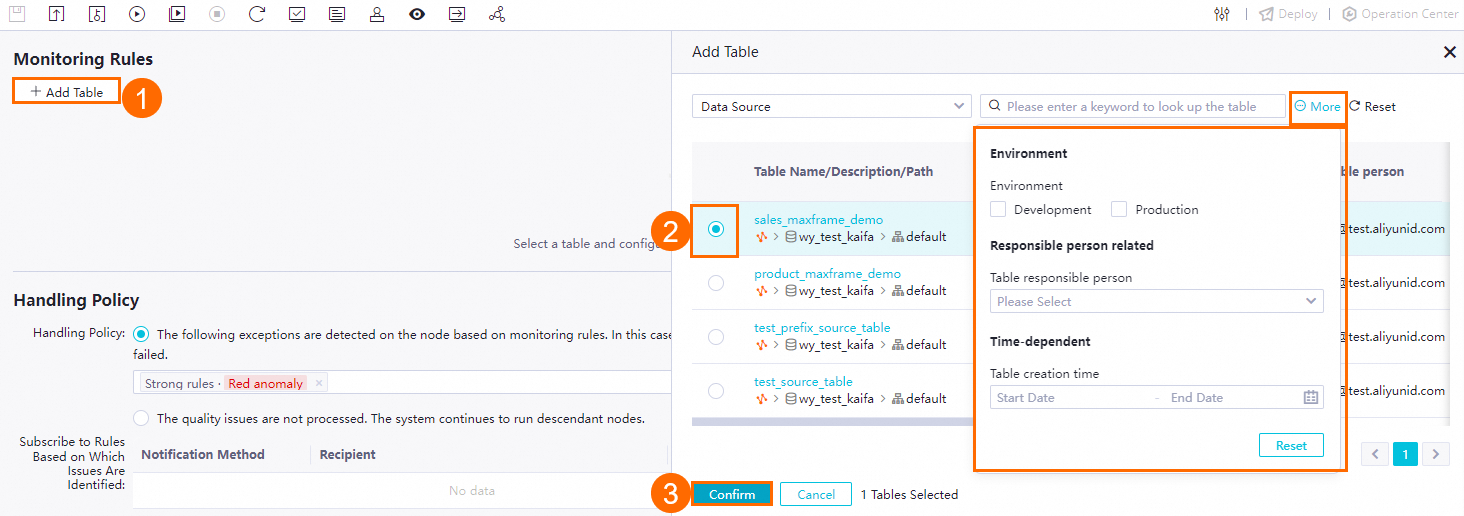
2. Configure data monitoring scope
-
For a non-partitioned table, the entire table is monitored by default. You can skip this step.
-
For a partitioned table, select the partition that you want to monitor. You can use scheduling parameters. Click Preview to verify that the partition filter expression is calculated correctly.

3. Configure quality rules
You can create new rules or import existing ones. By default, configured rules are enabled.
-
Create a new rule
Click Create Rule to create a data quality monitoring rule from a template or by using custom SQL. The following sections describe these methods.
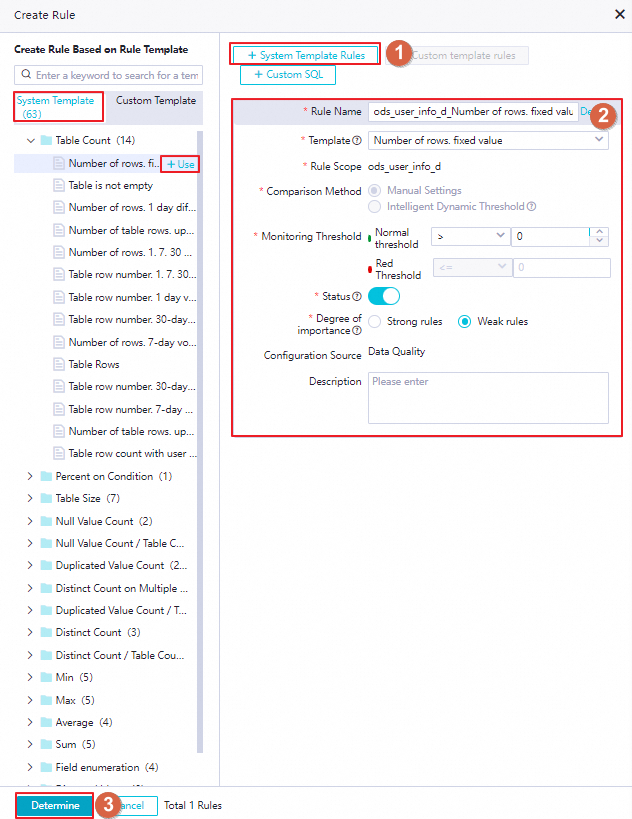
Method 1: From a system template
The platform provides various built-in monitoring rules. You can use these rule templates to quickly create a data quality monitoring rule. The following figure shows the procedure.
NoteYou can also find the required rule template in the system template list on the left and click +Use to create a rule.
Method 2: From a custom template
Before you use this method, go to to create a custom rule template. You can then create a data quality monitoring rule based on that template. For more information, see Create and manage custom rule templates.
The following figure shows how to create a data quality rule from a custom template.
NoteYou can also find the required rule template in the custom template list on the left and click +Use to create a rule.

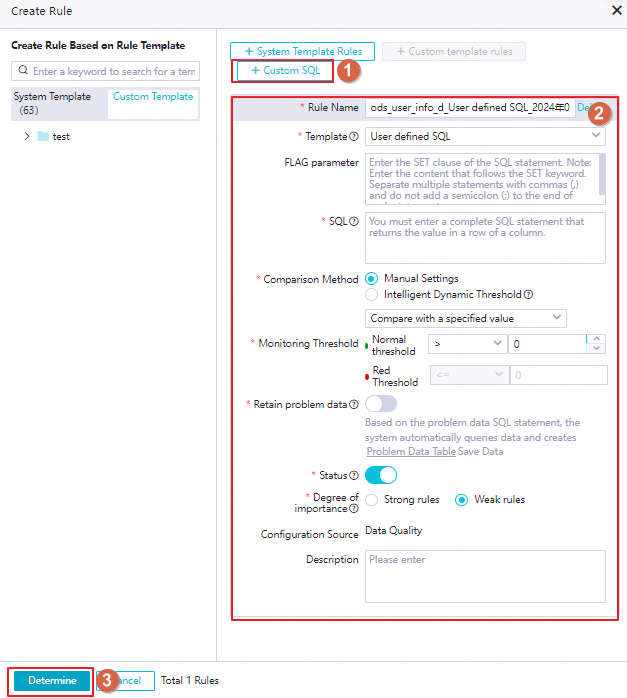
Method 3: From custom SQL
This method lets you define custom data quality check logic for a table.
-
Import existing rules
If monitoring rules for the target table already exist in the Data Quality module, you can import them to quickly clone the rules. If no rules exist, you must first create them in the Data Quality module. For more information, see Configure rules for a single table.
NoteThis method supports importing multiple rules in a batch and allows you to configure monitoring rules at the field level.
Click Import rules. You can search for and select the rules to import by rule ID or name, rule template, or associated scope (the entire table or specific fields).


After you publish a data quality monitoring node, you can view the details of its quality monitoring rules in the Data Quality module. However, you cannot perform management operations, such as modifying or deleting the rules, in that module.
4. Configure compute resources
Step 3: Configure policy for check results
In the Handling Policy section of the node editor, you can configure how to handle exceptions from data quality rule checks and how to subscribe to notifications.
Exception categories
Exception handling policy
Exception notification method
Step 4: Configure task scheduling
If you need to run the node task periodically, click Scheduling Settings on the right side of the node editor. In the Properties pane, configure the scheduling information for the task based on your business requirements. For more information, see Configure scheduling properties for a node.
You must set the Rerun attribute and Parent Nodes properties for the node before you can submit it.
Step 5: Debug the task
Perform the following debugging operations as needed to verify that the task runs as expected.
-
(Optional) Select a resource group and assign values to custom parameters.
-
Click the
icon in the toolbar. In the Parameter dialog box, select the scheduling resource group to use for debugging. -
If your task uses scheduling parameters, you can assign values to the variables here for debugging. For more information about the parameter assignment logic, see Task debugging process.
The following figure shows an example of scheduling parameter configuration.
-
-
Save and run the task.
Click the
icon in the toolbar to save the task. Click the icon to run the task.After the task is complete, you can view the run result at the bottom of the node editor. If the run fails, troubleshoot the issue based on the error message.
-
(Optional) Perform smoke testing.
If you want to perform smoke testing in the development environment to check whether the scheduling node task runs as expected, you can perform smoke testing when you submit the node or after it is submitted. For more information, see Perform smoke testing.

Step 6: Submit and deploy the task
After configuring the node task, you must submit and deploy it. After the task is deployed, the node runs periodically based on its scheduling configuration.
Submitting and deploying the node also submits and deploys its configured quality rules.
-
Click the
icon in the toolbar to save the node. -
Click the
icon in the toolbar to submit the node task.When you submit the task, enter a Change Description in the Submission dialog box. If needed, you can also select whether to perform a code review after the node is submitted.
Note-
You must set the Rerun attribute and Parent Nodes properties for the node before you can submit it.
-
Code review helps control the quality of task configurations and prevents errors from unreviewed deployments. If you perform a code review, the submitted node can be deployed only after it is approved by a reviewer. For more information, see Code review.
-
If you use a workspace in standard mode, you must click Deploy in the upper-right corner of the node editor after the task is submitted. This deploys the task to the production environment. For more information, see Deploy tasks.
Next steps
-
Operations and maintenance: After the task is submitted and deployed, it runs periodically based on the node's configuration. You can click O&M in the upper-right corner of the node editor to go to the Operation Center, where you can view the scheduling and running status of the periodic task, including the node status and details of triggered rules. For more information, see Manage periodic tasks.
-
Data Quality: After the data quality monitoring rules are deployed, you can also go to the Data Quality module to view rule details. However, you cannot manage the rules, such as modifying or deleting them. For more information, see Data quality.