Operation Center is a big data O&M monitoring platform. View real-time task execution status, diagnose and rerun abnormal tasks, and use Smart Baseline to ensure critical tasks complete on time. Operation Center also provides O&M capabilities for engines, resources, and scheduling.
Functional modules
After you deploy nodes from DataStudio, use Operation Center to manage Auto Triggered Nodes, Manually Triggered Nodes, and real-time nodes—run production tasks, troubleshoot issues, monitor status, and view O&M metrics.

Operation Center requires a desktop browser with Chrome 69 kernel or later.
Usage notes
Nodes run on schedule only after deployment to the production environment. Development environment nodes are not automatically scheduled.
Access Operation Center
Log on to the DataWorks console. In the target region, click in the left-side navigation pane. Select a workspace from the drop-down list and click Go to Operation Center.
Task O&M
Task O&M covers three node types: Auto Triggered Nodes, real-time nodes, and Manually Triggered Nodes. Use the O&M Dashboard for key execution metrics, and tools like Data Backfill, Intelligent Diagnosis, and Automated O&M for comprehensive maintenance.
|
Module |
Description |
Environment availability |
|
|
Displays key O&M metrics for scheduled tasks in reports, with dedicated pages for offline and real-time synchronization tasks in Data Integration. |
Not available in the development environment. |
||
|
Auto Triggered Task O&M |
View the DAG for Auto Triggered Nodes and perform node Test and Run. |
The development environment cannot automatically schedule or generate Auto Triggered instances. |
|
|
Lists instances generated after Auto Triggered Nodes are submitted to the scheduling system. View instance DAG, perform Run Diagnostics, and Rerun Auto Triggered instances. |
|||
|
Lists test instances generated after you test an Auto Triggered Node. Check execution status, view instance DAG, perform Run Diagnostics, and Rerun instances. |
|||
|
Real-time Task O&M |
Start, Stop, and Undeploy real-time computing nodes. Monitoring Setting alerts for timely exception handling. |
- |
|
|
Start, Stop, Undeploy, and Modify Owner of real-time synchronization nodes. Monitoring Setting alerts for timely exception handling. |
- |
||
|
Manually Triggered Task O&M |
Query Manually Triggered Nodes, manual business workflows, and event-triggered workflows. View the DAG, manually Run nodes, and View Instances. |
- |
|
|
Use the DAG to view instance details: View Runtime Log, Run Diagnostics, View Code, and View Lineage. |
- |
||
|
O&M Assistant |
Manage data backfill tasks. |
- |
|
|
End-to-end analysis for quick issue diagnosis. View a node's Operation Details, General, Influenced Baseline, and Historical instance. |
Not available in the development environment. |
||
|
Create custom O&M rules that define monitoring metrics for instances on a target resource group. When triggered, the system automatically executes a predefined action. |
- |
||
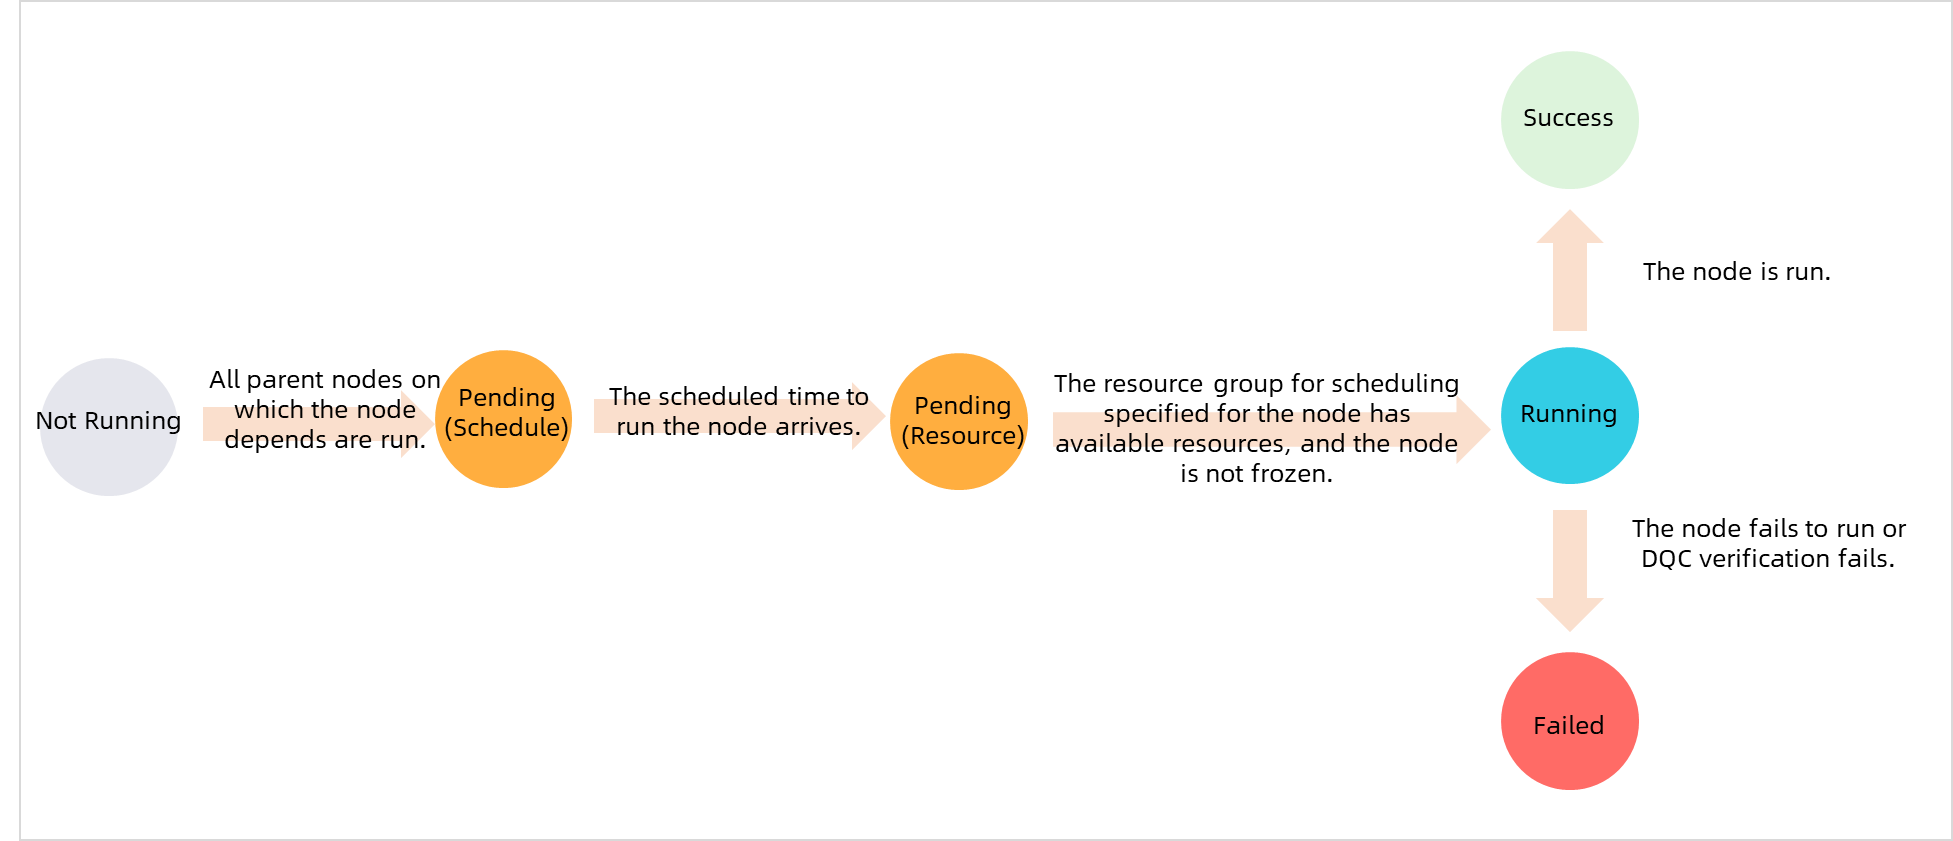
A periodically scheduled node instance runs only if the following conditions are met:
-
All dependent ancestor node instances have run successfully.
-
The scheduled execution time for the node has been reached.
-
Sufficient scheduling resources are available.
-
The node is not in a frozen state.
In Operation Center, different colors represent different instance statuses. For more details on instance statuses, see Appendix: Instance execution status and diagnosis.
Task monitoring
Task monitoring includes Smart Baseline and Alert monitoring. Configure Smart Baseline to detect node exceptions and send early warnings. Manage monitoring rules, alert notifications, and on-duty schedules for timely alert handling.
|
Module |
Description |
Environment availability |
|
|
Intelligent Baselines detects exceptions that prevent baseline nodes from completing on time and sends early warnings, ensuring critical data is generated on schedule. Benefits: reduce configuration costs, avoid unnecessary alerts, and automatically monitor all critical tasks. |
Not available in the development environment. |
||
|
Monitoring and Alerting |
Configure custom monitoring rules for node execution status or resource usage to promptly detect and handle exceptions. |
||
|
Centralizes all alerts from the Task Monitoring module: baseline warnings and event alerts from Intelligent Baselines, plus custom rule and global rule alerts. |
|||
|
Manage O&M alert response shifts. After configuration, DataWorks sends Alerts to on-duty personnel for prompt resolution. |
|||
Other O&M
Beyond task O&M and monitoring, DataWorks lets you view E-MapReduce engine details, monitor resource group usage, and customize scheduling parameters.
|
Module |
Description |
Environment availability |
|
|
View E-MapReduce job details. Find and clean up errored jobs to prevent them from blocking downstream nodes. |
Not available in the development environment. |
||
|
Visualizes resource group usage and instance execution status. Enables intelligent monitoring and Automated O&M for resource groups and instances. |
- |
||
|
Create and manage Scheduling Calendar and Workspace-level Parameters to customize task scheduling. |
- |
||
Appendix: Instance execution status and diagnosis
In Operation Center, colors and icons indicate instance execution status as described below. For task execution prerequisites, see Task execution diagnosis.
|
No. |
Status type |
Status icon |
Execution flowchart |
|
1 |
Success |
|
|
|
2 |
Not running |
|
|
|
3 |
Failed |
|
|
|
4 |
Running |
|
|
|
5 |
Waiting |
|
|
|
6 |
Suspended/frozen |
|