This feature is available only to paid customers and is no longer sold to new customers.
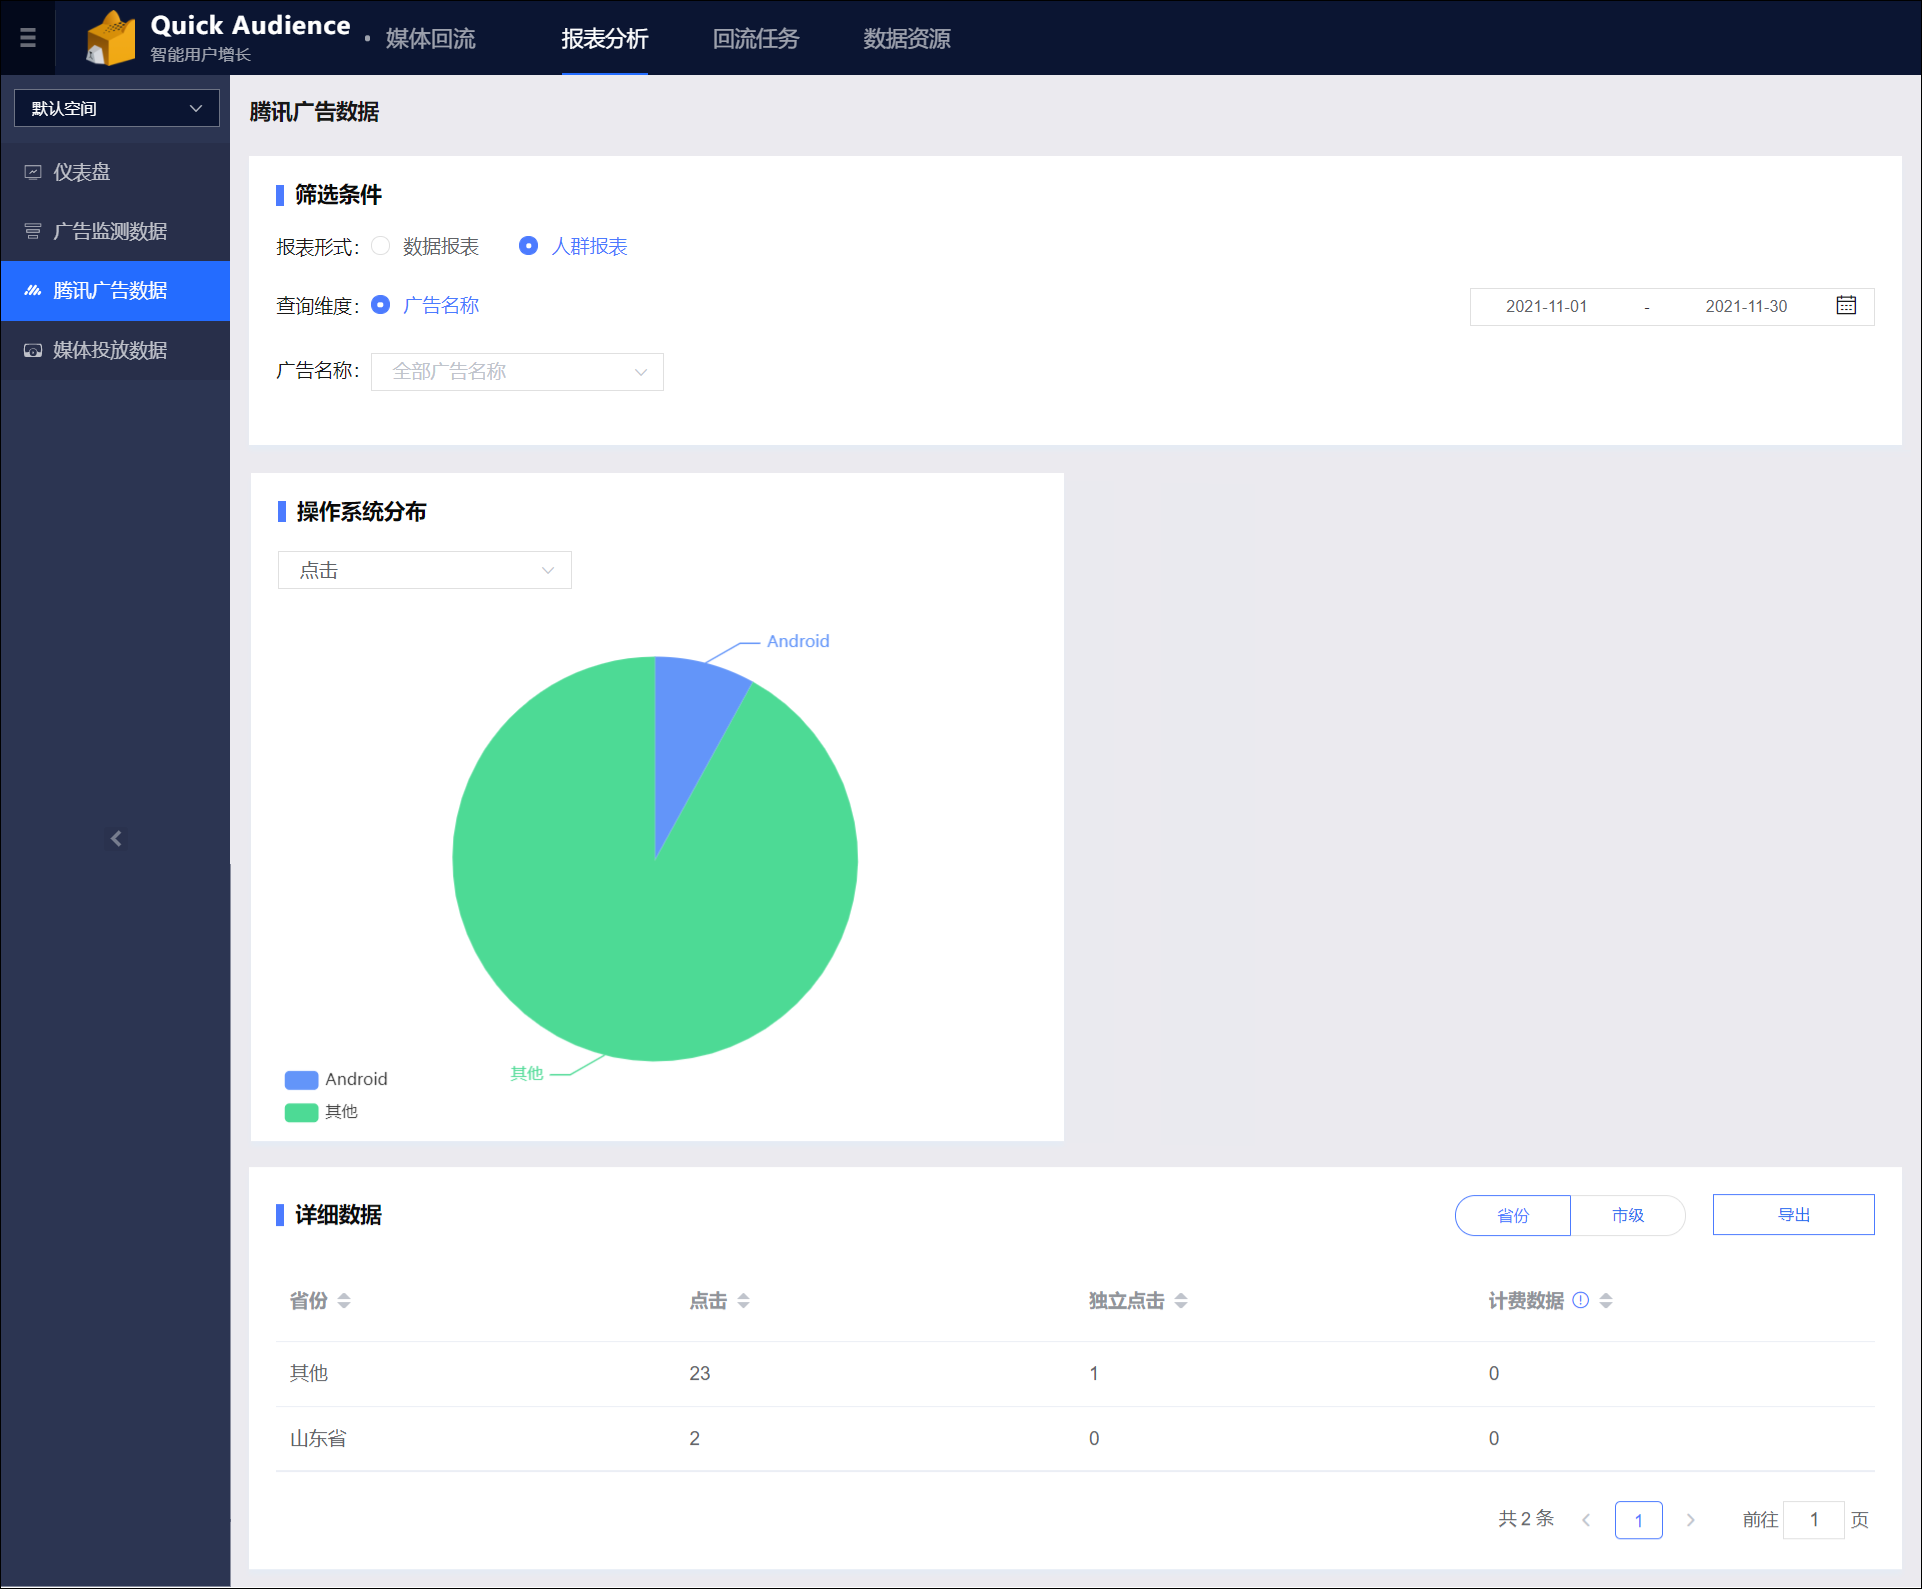
Go to Media Backflow > your workspace > Report Analysis > Tencent Ad Data. On this page, you can view ad data reports from the Tencent Ad platform, as shown in the following figure.
Filter conditions
Report type:
For each report type, you can select different items from a drop-down list to display in the report:
Data report: This report provides a time trend graph, as shown in the figure above. You can choose to display clicks and unique clicks.
Audience report: This report provides a and an operating system distribution graph, as shown in the figure below. You can choose to display impressions, clicks, unique impressions, and unique clicks.
Time dimension:
This setting is available only for reports that include a time trend graph:
View by day
View by hour
Query dimension: You can query only by ad name. By default, the report displays data for all ads. You can also select one or more ads from the drop-down list to filter the data.
Time filter: The default time range is the last 7 days, excluding the current day. You can select a time range of up to 180 consecutive days.
Detailed data
The detailed data table displays data based on the selected filter conditions.
If the report is grouped by date or hour, two buttons appear in the upper-right corner of the Detailed data area that allow you to switch the data grouping. The button names change based on the selected dimensions, such as Ad Name-Date and Date-Ad Name:
When you click Ad Name-Date, the detailed data table groups statistics by ad name. An
 arrow icon appears next to each ad name. You can click the icon to expand the row and view detailed data by date for that ad.
When you click Date-Ad Name, the detailed data table groups statistics by date. An
arrow icon appears next to each date. You can click the icon to expand the row and view detailed data by ad name for that date.
If the Report type is Audience, the Province and City buttons appear in the upper-right corner of the Detailed data area. You can use these buttons to switch the statistic granularity of the detailed data table.
You can click the Export button in the upper-right corner of the Detailed data area to export the detailed data table as a local file.