This document describes how to use the static resource monitoring plugin in EMAS to collect data on failed and slow-loading resources. This information helps you analyze static resource issues and improve your application's stability and performance.
Overview
Slow or failed loading of static resources, such as JS, CSS, and images, can significantly affect page performance and user experience. In modern web and H5 applications, these resources are vital. Ensuring they load effectively is key to improving user interaction. Static resource monitoring in EMAS focuses on catching and analyzing slow loads and loading errors. It provides detailed logs to help developers identify performance bottlenecks, diagnose problems, and resolve them.
Static resource monitoring provides the following main features:
Tracking and issue identification: Developers can use this feature to track the success rate of page resource loading in real-time and quickly identify the causes of loading failures. The console provides detailed error logs to help troubleshoot and resolve issues, ensuring all resources load correctly.
Performance impact analysis: Allows developers to understand how slow loads and loading errors affect the user experience. This helps them create effective optimization strategies.
Device and browser compatibility: Development and operations teams can use this tool to track and resolve resource loading issues that users experience on specific devices and browsers. This ensures a consistent user experience across all platforms.
This comprehensive monitoring improves the user experience across different devices and network conditions. It also provides valuable data for resource management and optimization.
Preparations
Before you can use the static resource monitoring feature, you must integrate the EMAS Application Performance Management (APM) software development kit (SDK). For more information, see SDK Integration.
Enable reporting for the static resource module. For more information, see Reporting Configuration.
Configure a baseline threshold for slow-loading static resources that suits your business needs. For more information, see Threshold Configuration.
Feature description
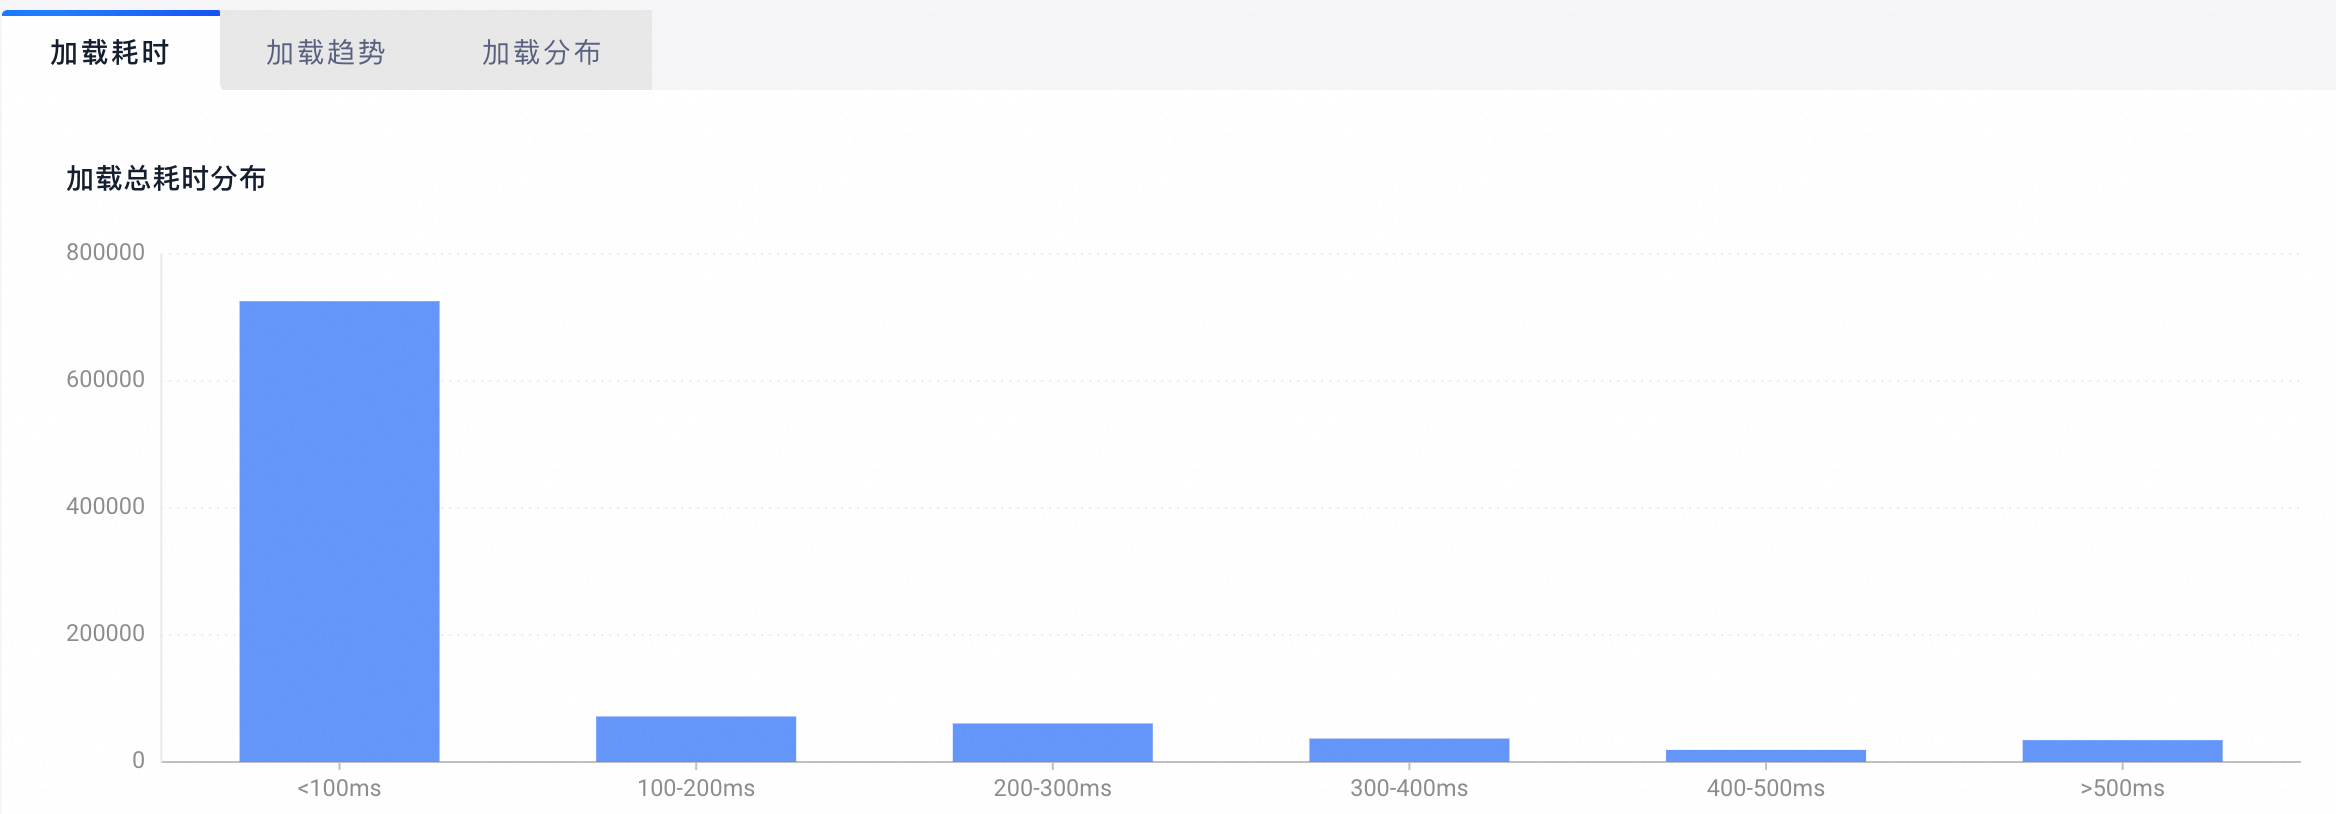
Loading time
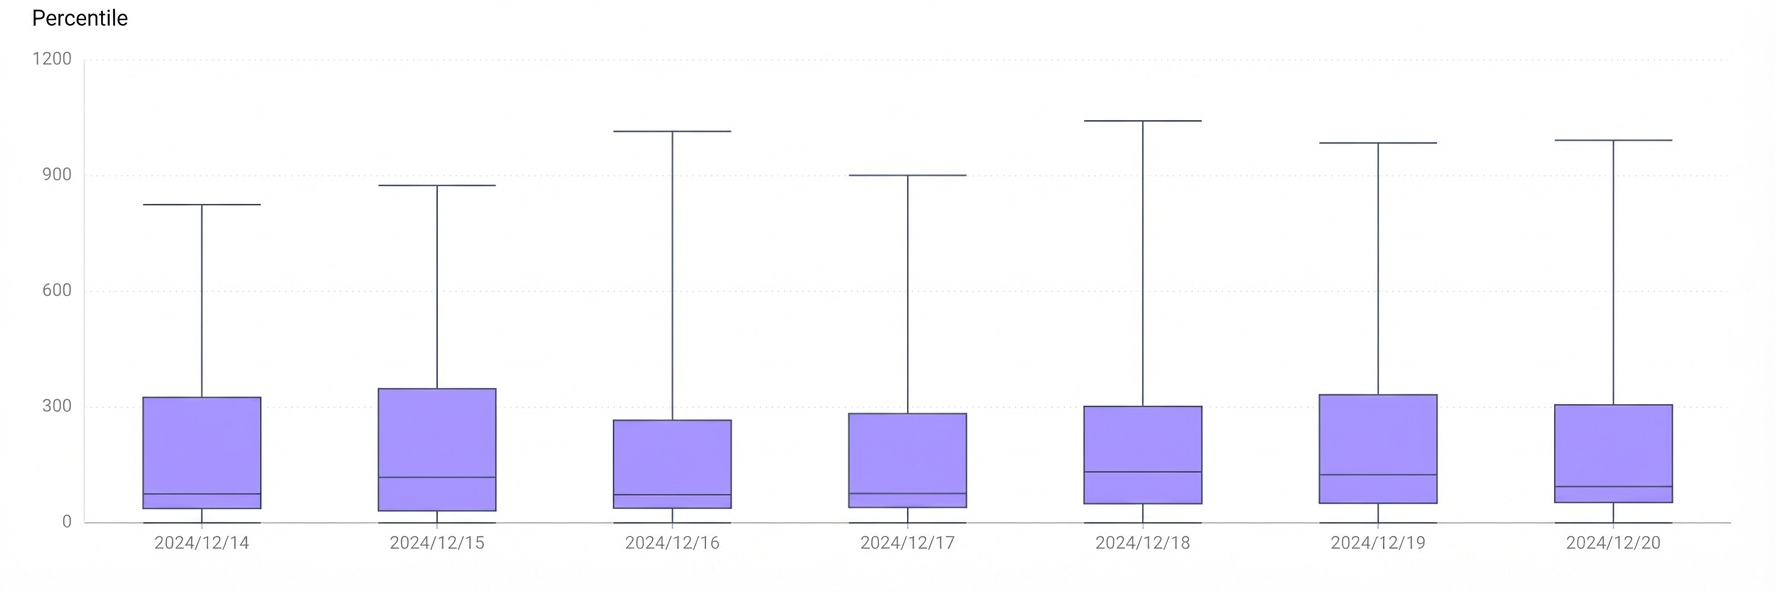
You can observe the overall loading time for all static resources that match the filter conditions. You can also use the distribution and percentile graphs to understand the overall time range. For information about how to read the percentile graph, see Percentile value description.
Loading trends
The Loading trends section shows trend graphs for loading errors and slow loads that match the filter conditions. You can use these graphs to view issue fluctuations and their impact.
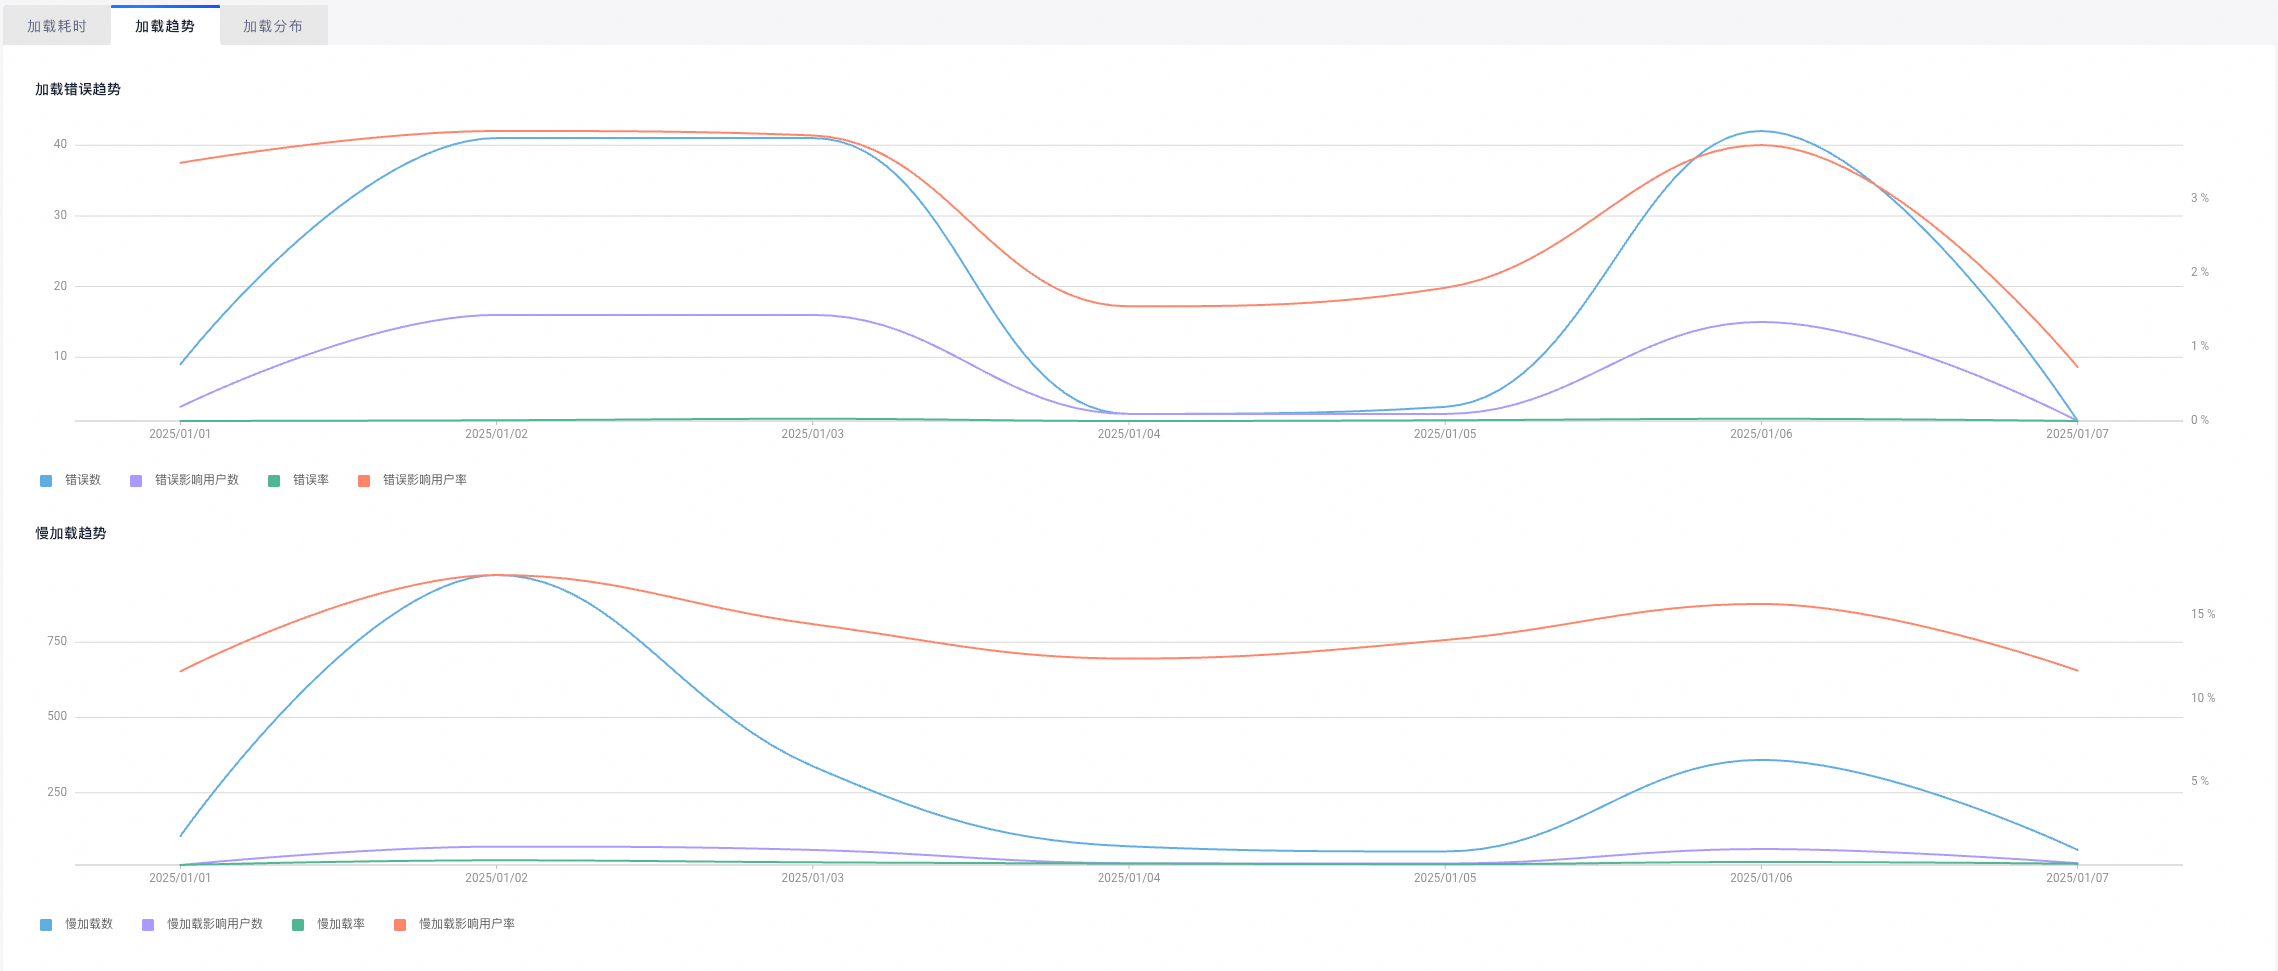
For metric definitions, see Metric definitions - Static resource metrics.
You must report the user_id field. Otherwise, the affected user count and affected user rate metrics cannot be calculated.
Loading distribution
Distribution Analysis supports multi-dimensional statistics, such as version of the browser, operating system version, and device model. You can use these statistics to observe the distribution of loading errors and slow loads and to locate problems.
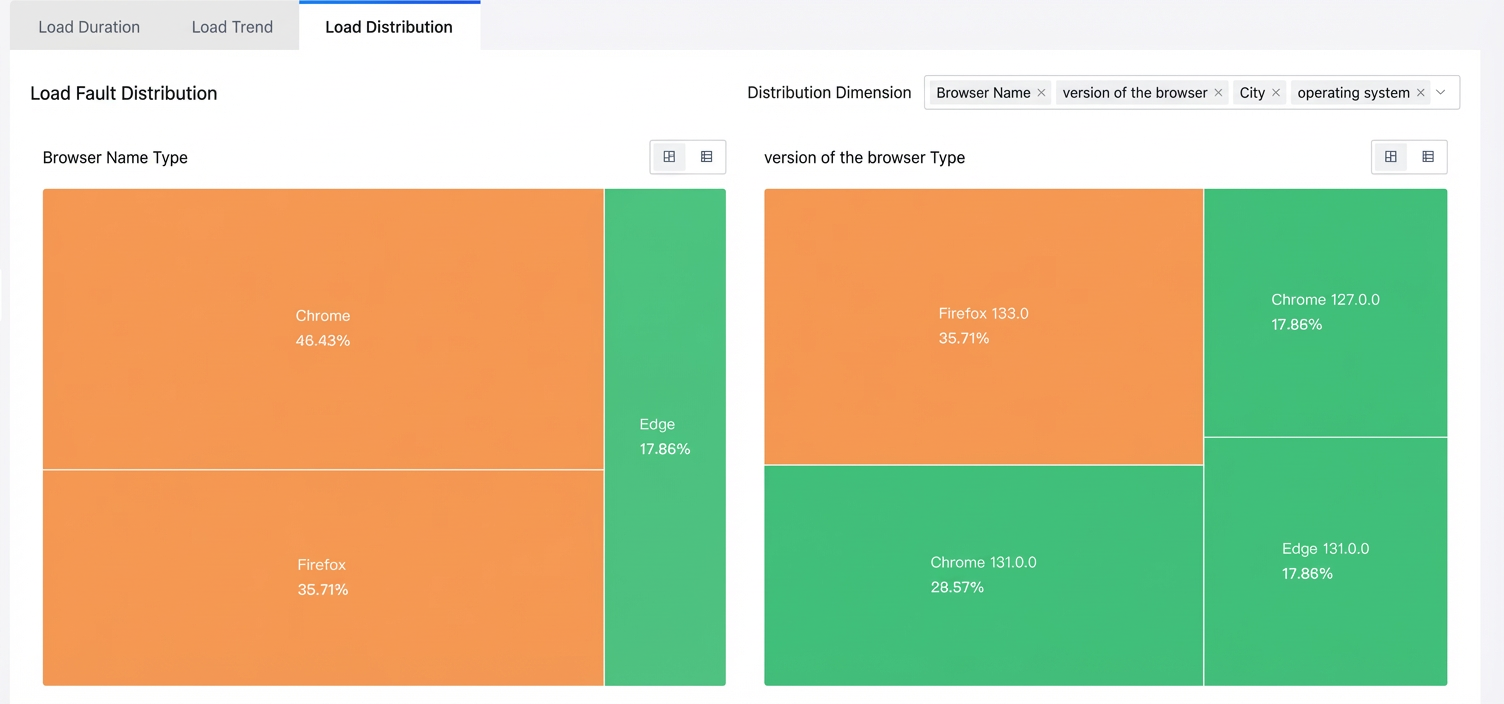
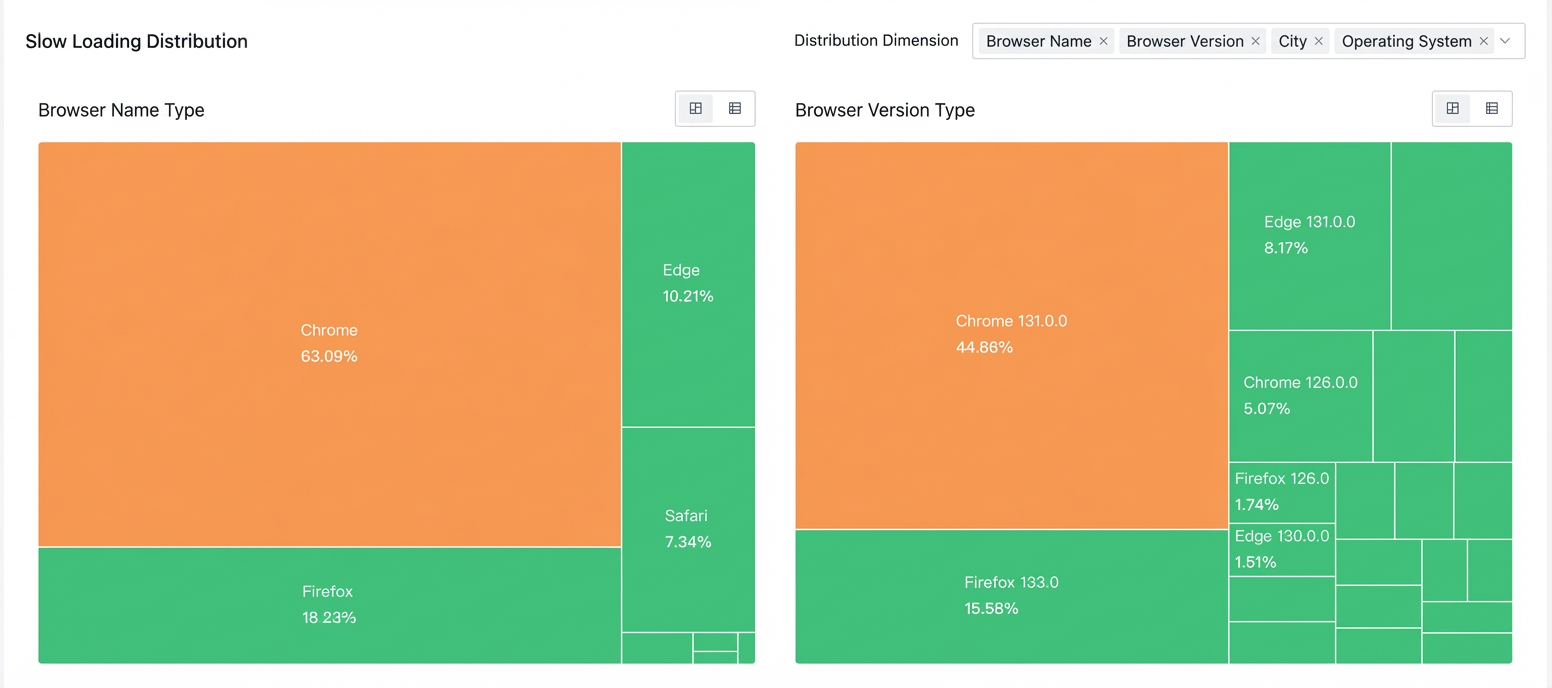
By default, the distribution of loading issues is shown across four dimensions: browser, system, device model, and city. You can click the Distribution Dimension button to select different dimensions to replace the default ones. You can select a minimum of one and a maximum of four dimensions.
You can click
 to switch the view between distribution ranking and list ranking.
 to switch the view between distribution ranking and list ranking.
Resource list
This section displays a dashboard of metrics by resource path that match the filter conditions. The metrics include path, load count, user count, error count, affected user count for errors, slow load rate, and affected user rate for slow loads.
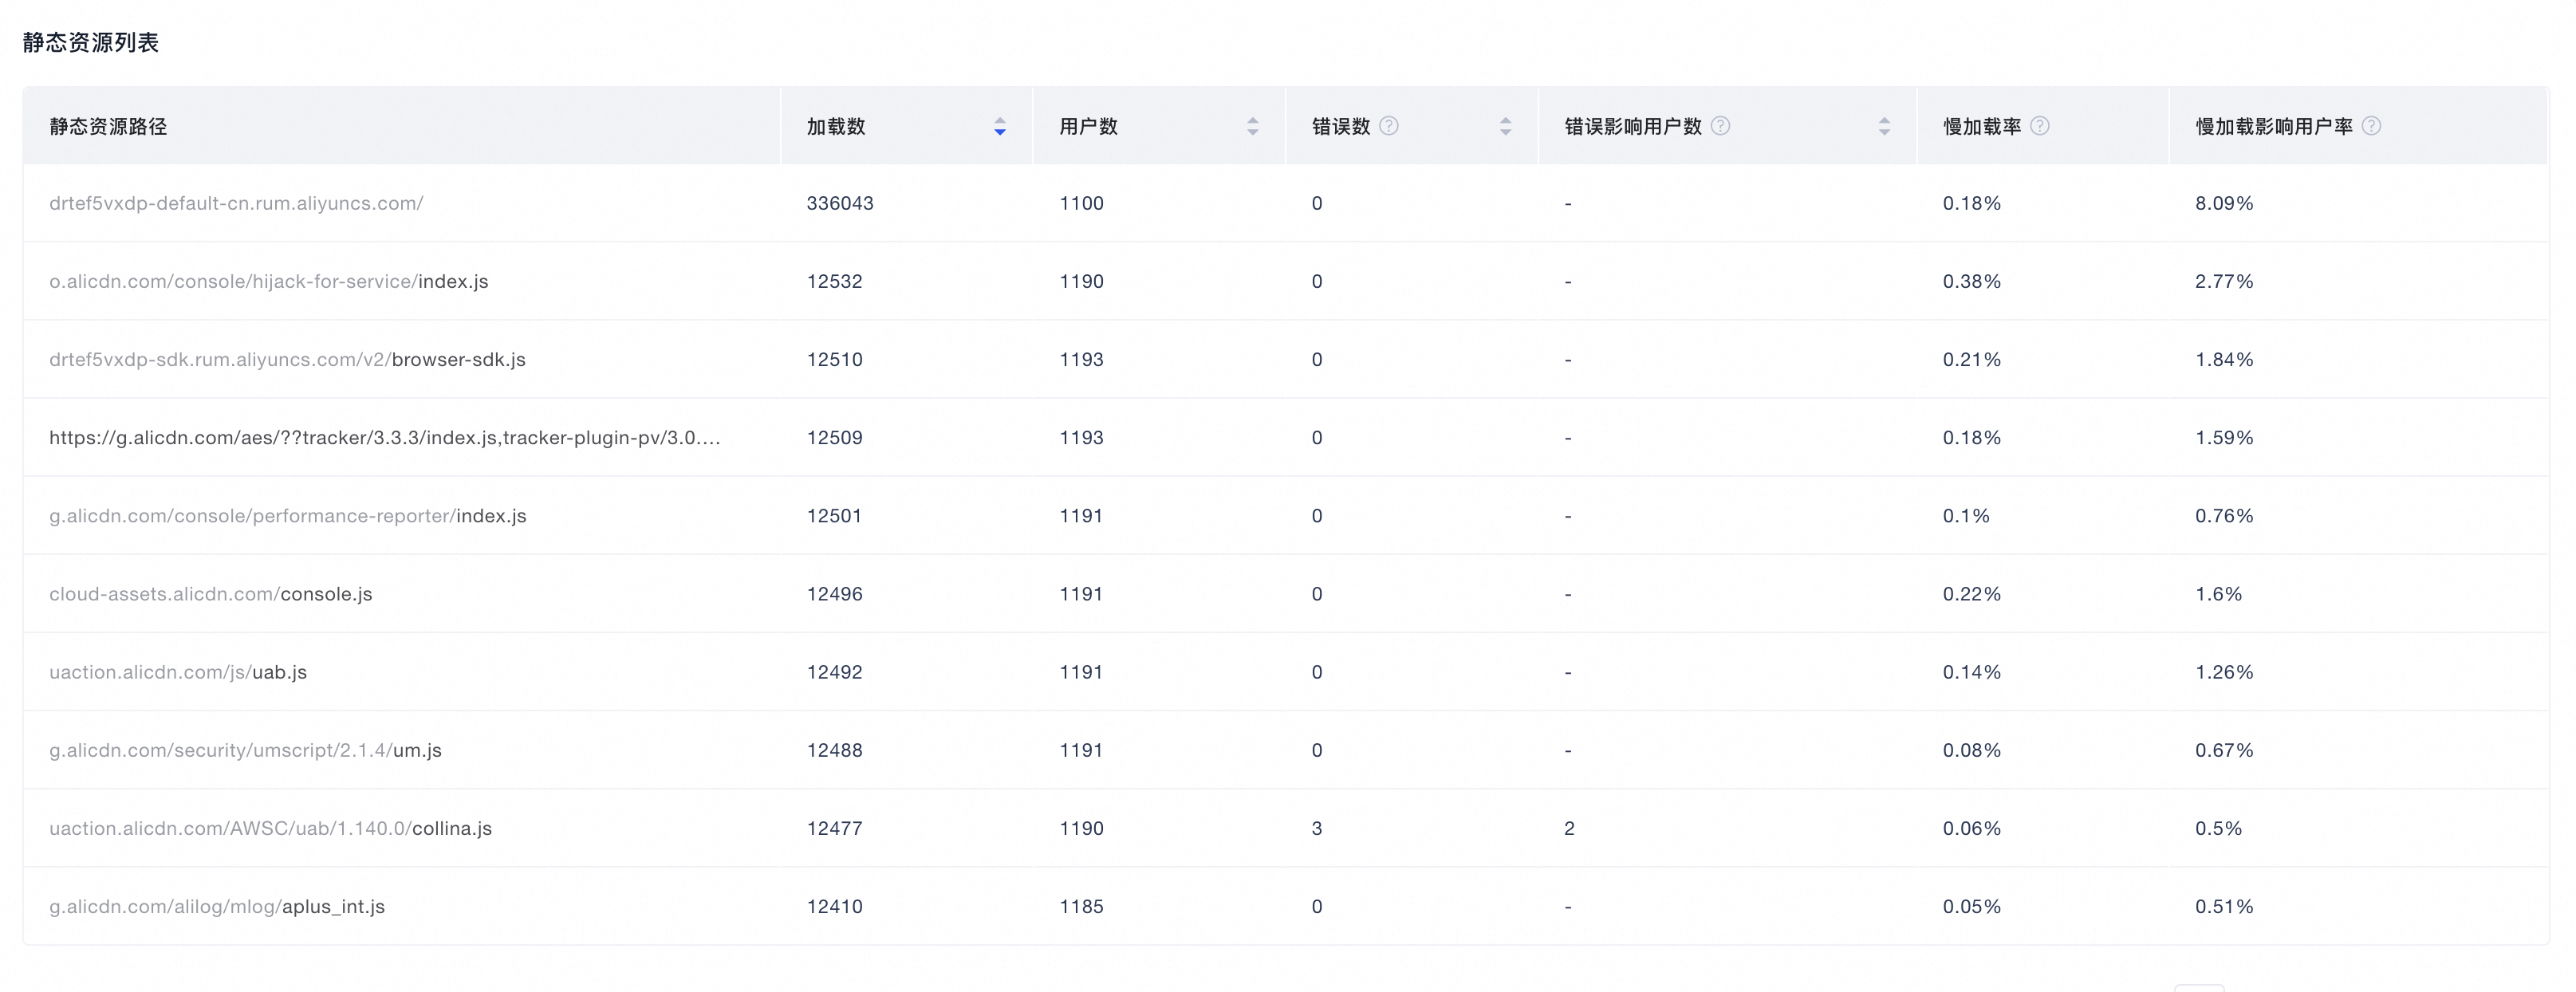
Sorting: You can sort the metrics. By default, they are sorted by load count in descending order.
View details: You can click a resource path to go to the detail analysis page for that resource.
Problem details
The static resource detail analysis lets you drill down into a specific resource path. This view provides basic information, loading process analysis, trend analysis, and distribution analysis for the path. It also provides detailed information from each client report.
Basic information
For metric definitions, see Metric definitions - Static resource metrics.
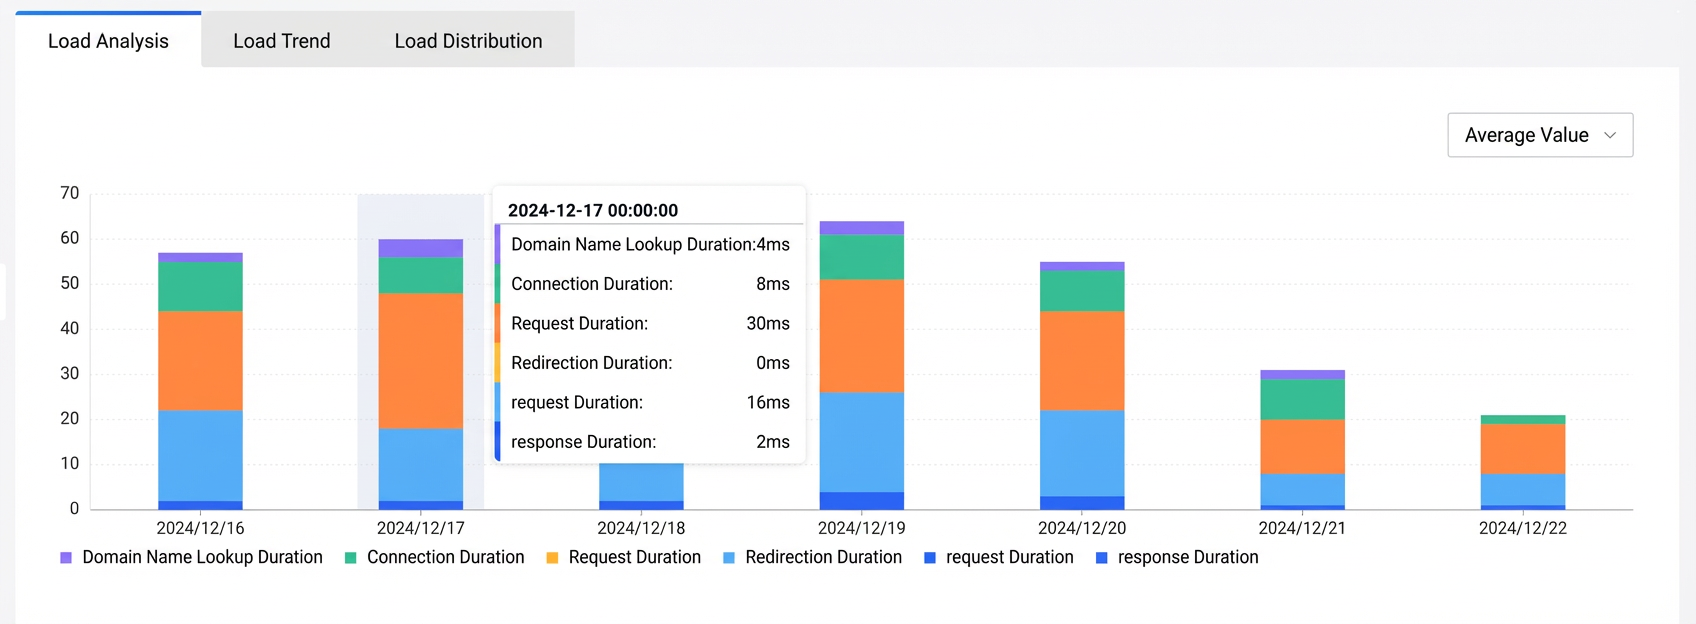
Loading analysis
This section provides change trends for the time spent in each stage of the resource loading process. This information is useful for development and operations.
Operation: You can switch between percentile values, such as the 50th, 75th, and 90th percentiles, and the average value.
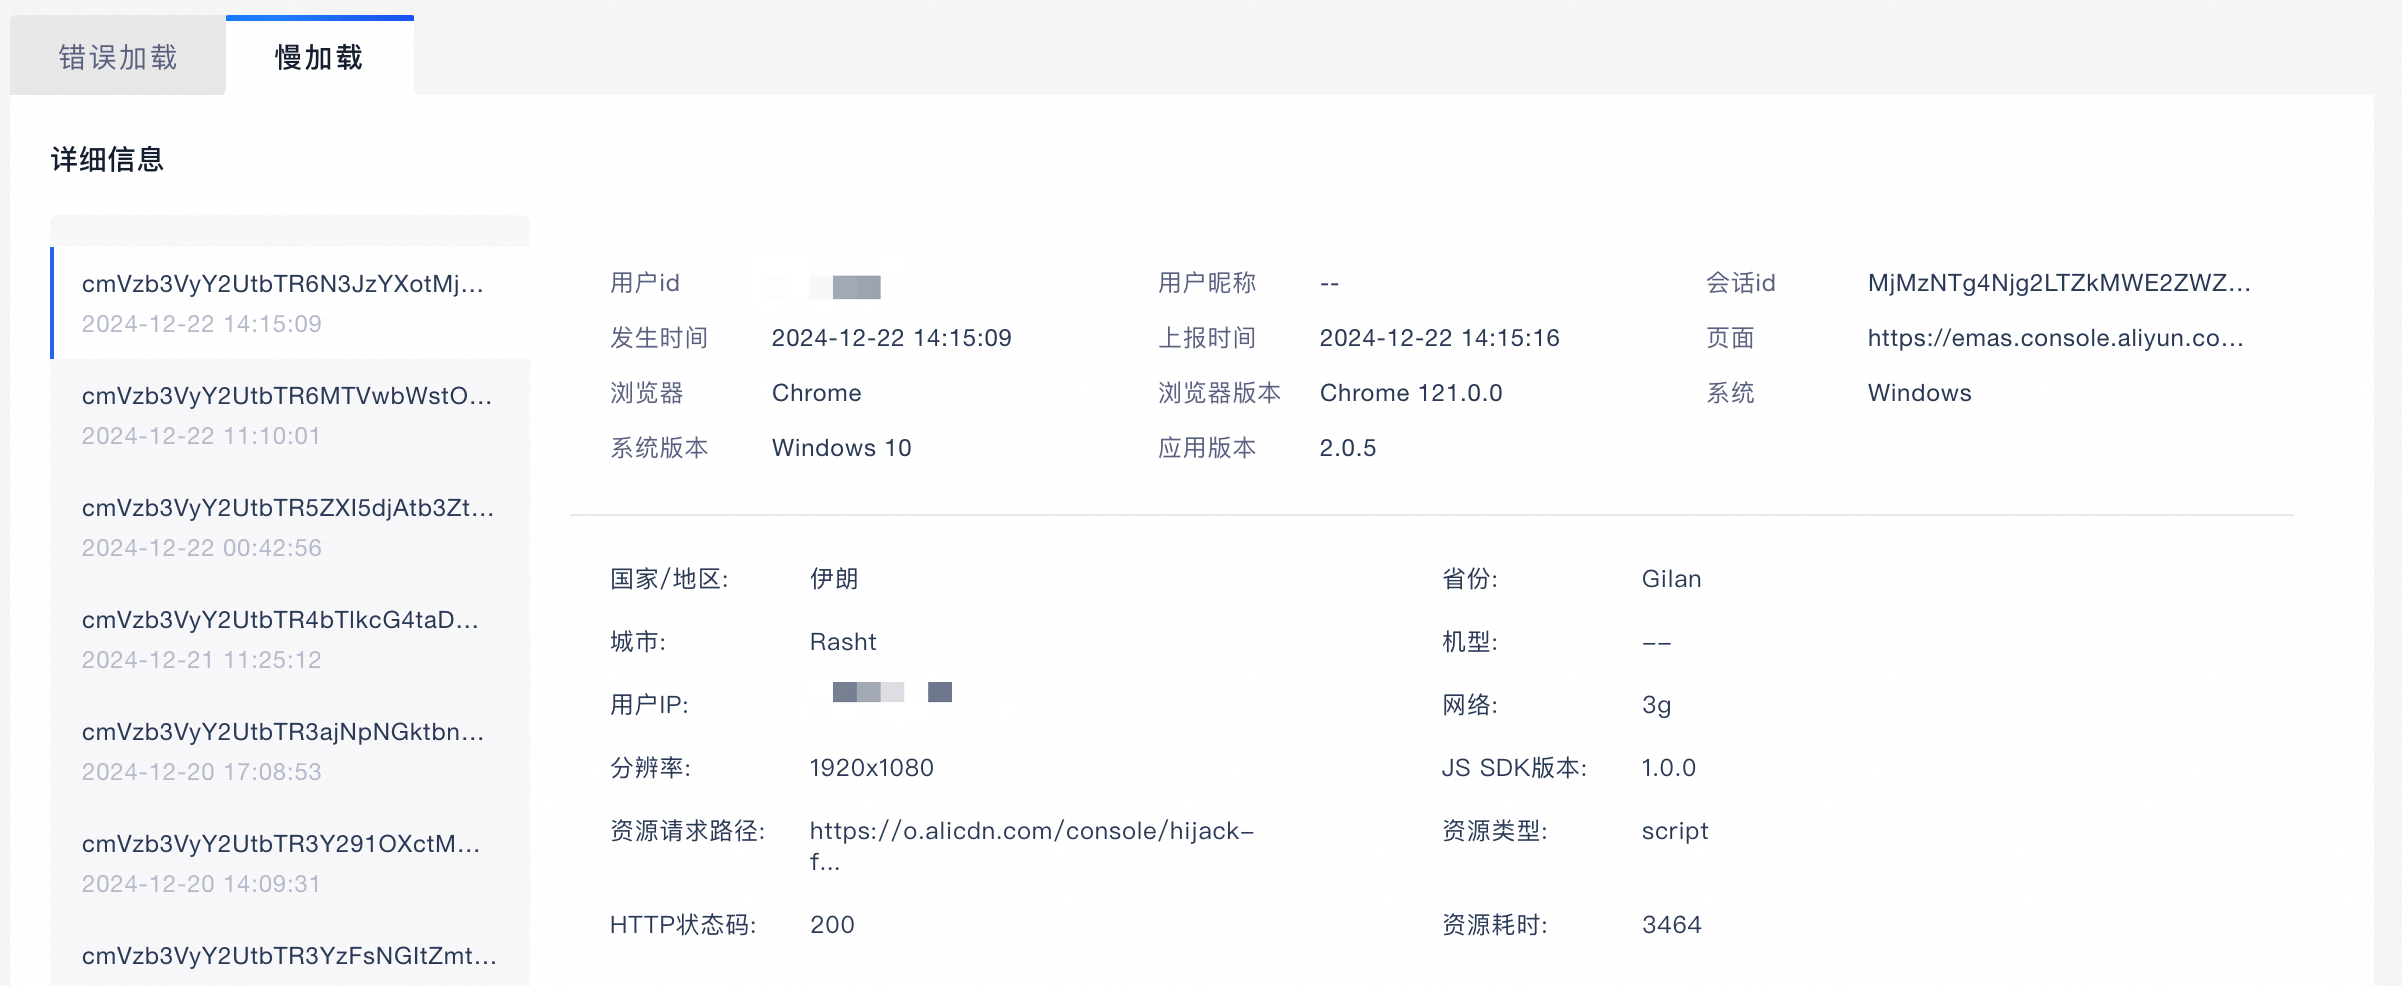
Detailed information
This section shows all client-reported instances for the same resource path, including loading errors and slow load issues. The instances are listed on the left in chronological order. You can click an instance to view its basic information and detailed reported fields on the right.
Basic information
This section shows the basic device information for each static resource. For more information, see Basic information.
Detailed information
This section shows the specific information for each static resource.
Parameter |
Description |
Country/Region |
The geographic location of the device, estimated from the IP address. |
Province |
The province where the device is located. |
City |
The city where the device is located. |
Device model |
The model identifier of the device. |
User IP |
The public IP address of the device. |
Resolution |
The resolution of the device. |
JS SDK version |
The version number of the SDK used. |
Resource request path |
URI parameter for a resource request |
Resource type |
The resource type parameter. |
HTTP status code |
The HTTP status code of the resource. |
Resource duration |
The resource duration parameter. |
Additional information
To control costs, you can flexibly configure sampling rules and the sample rate in Reporting Configuration > Static Resources.