This document describes EMAS Request Monitoring. This feature collects data on failed and slow requests to help you analyze request issues, optimize application performance, and improve overall stability.
Overview
Complex and variable network environments often cause request delays and errors, which negatively affect the user experience. The EMAS Request Monitoring feature captures and analyzes slow and failed requests in real-time. It helps developers quickly identify and resolve issues through comprehensive monitoring and log analysis, improving system stability and reliability.
This feature tracks page API requests in real-time to identify long response times and abnormal behavior, helping developers and O&M teams find and fix performance bottlenecks. Monitoring the success rate of API requests ensures stable API operation. This provides a high-quality user experience in various environments, reduces the impact of issues, improves response performance, and increases user satisfaction.
Preparations
Integrate the Application Performance Management (APM) SDK.
Turn on reporting for the request module. For more information, see Reporting Configuration.
Configure a slow request threshold baseline as needed. For more information, see Threshold Configuration.
Features
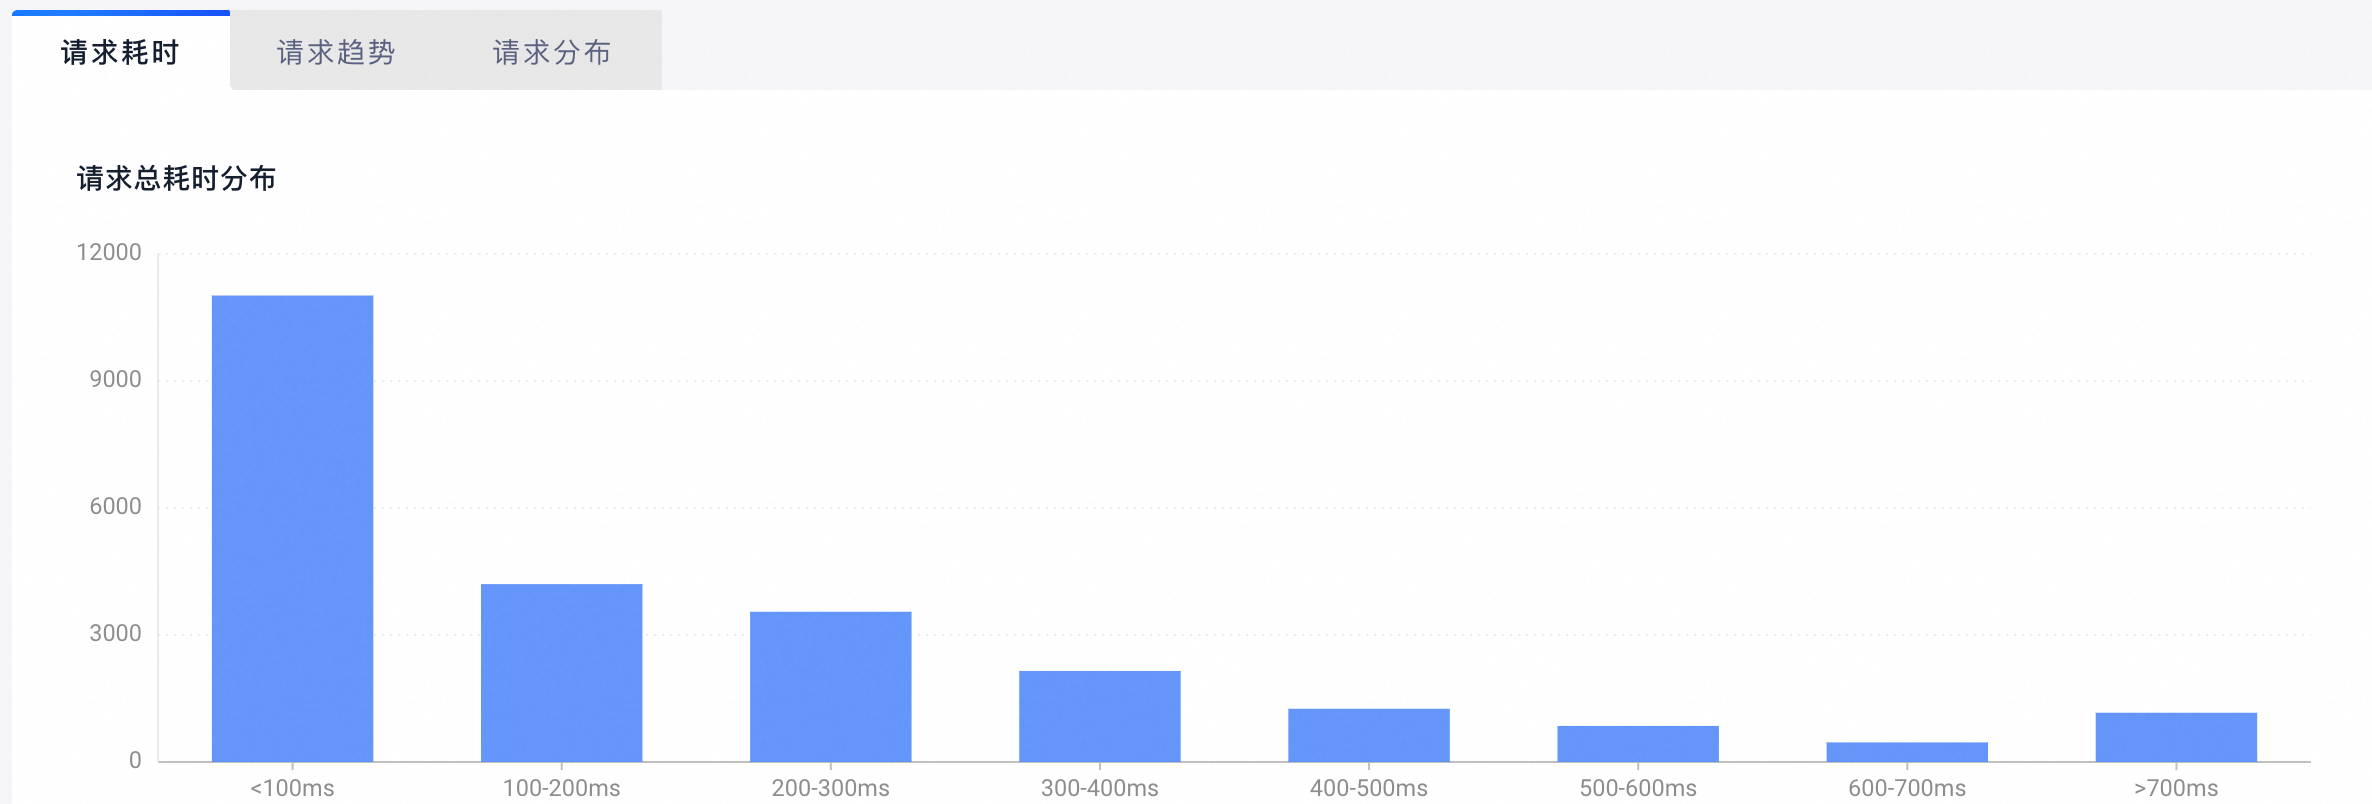
Request duration
You can view the overall duration of all requests that match the filter criteria. You can also use the duration distribution and percentile graphs to understand the overall duration range. For more information about how to read the percentile graph, see Percentile value description.
Request trends
The request trend graph shows trends for both failed and slow requests that match the filter criteria. You can use this graph to view issue fluctuations and their scope of impact.
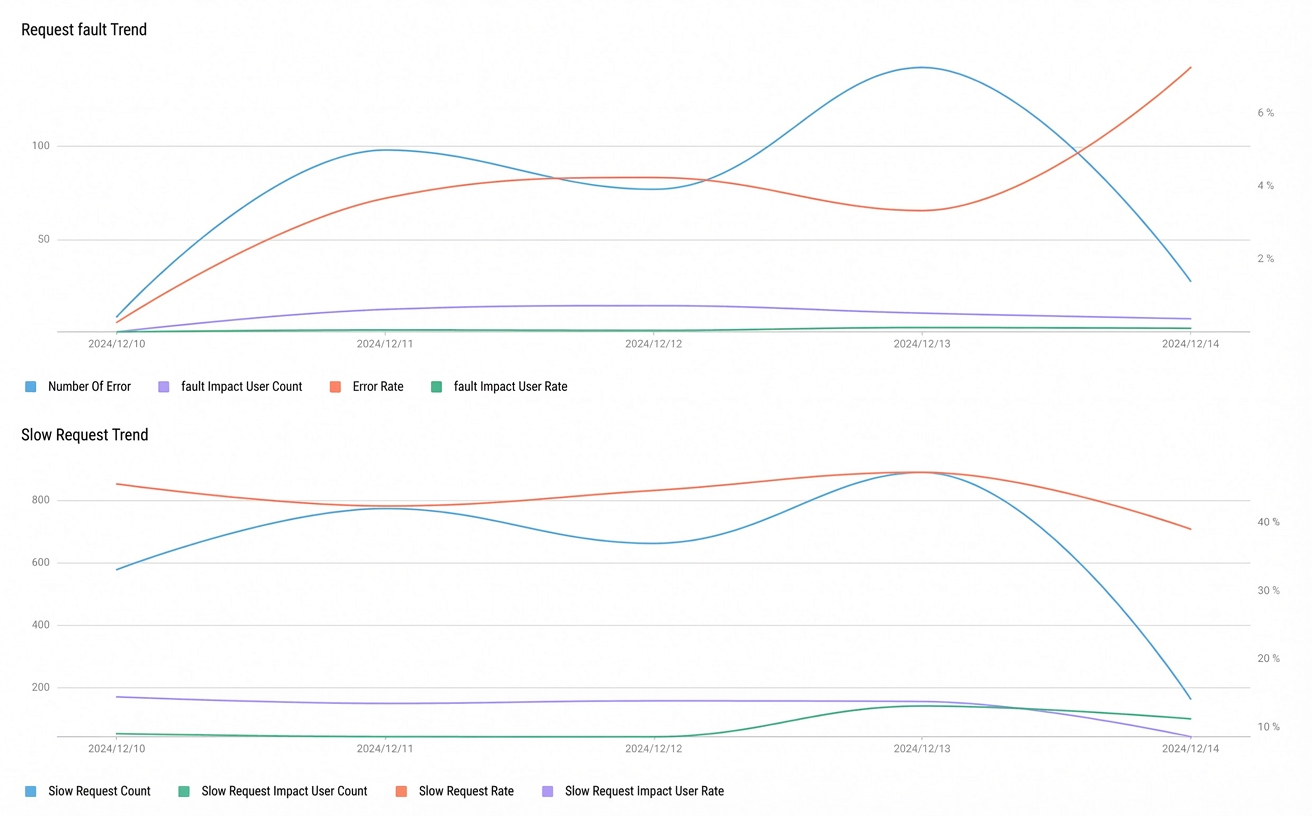
For metric definitions, see Metric definitions - Request metrics.
You must report the user_id field. Otherwise, the number of affected users and the affected user rate metrics cannot be calculated.
Request distribution
You can use distribution analysis to locate issues by viewing the distribution of failed and slow requests across multiple dimensions, such as browser version, operating system version, and device model.
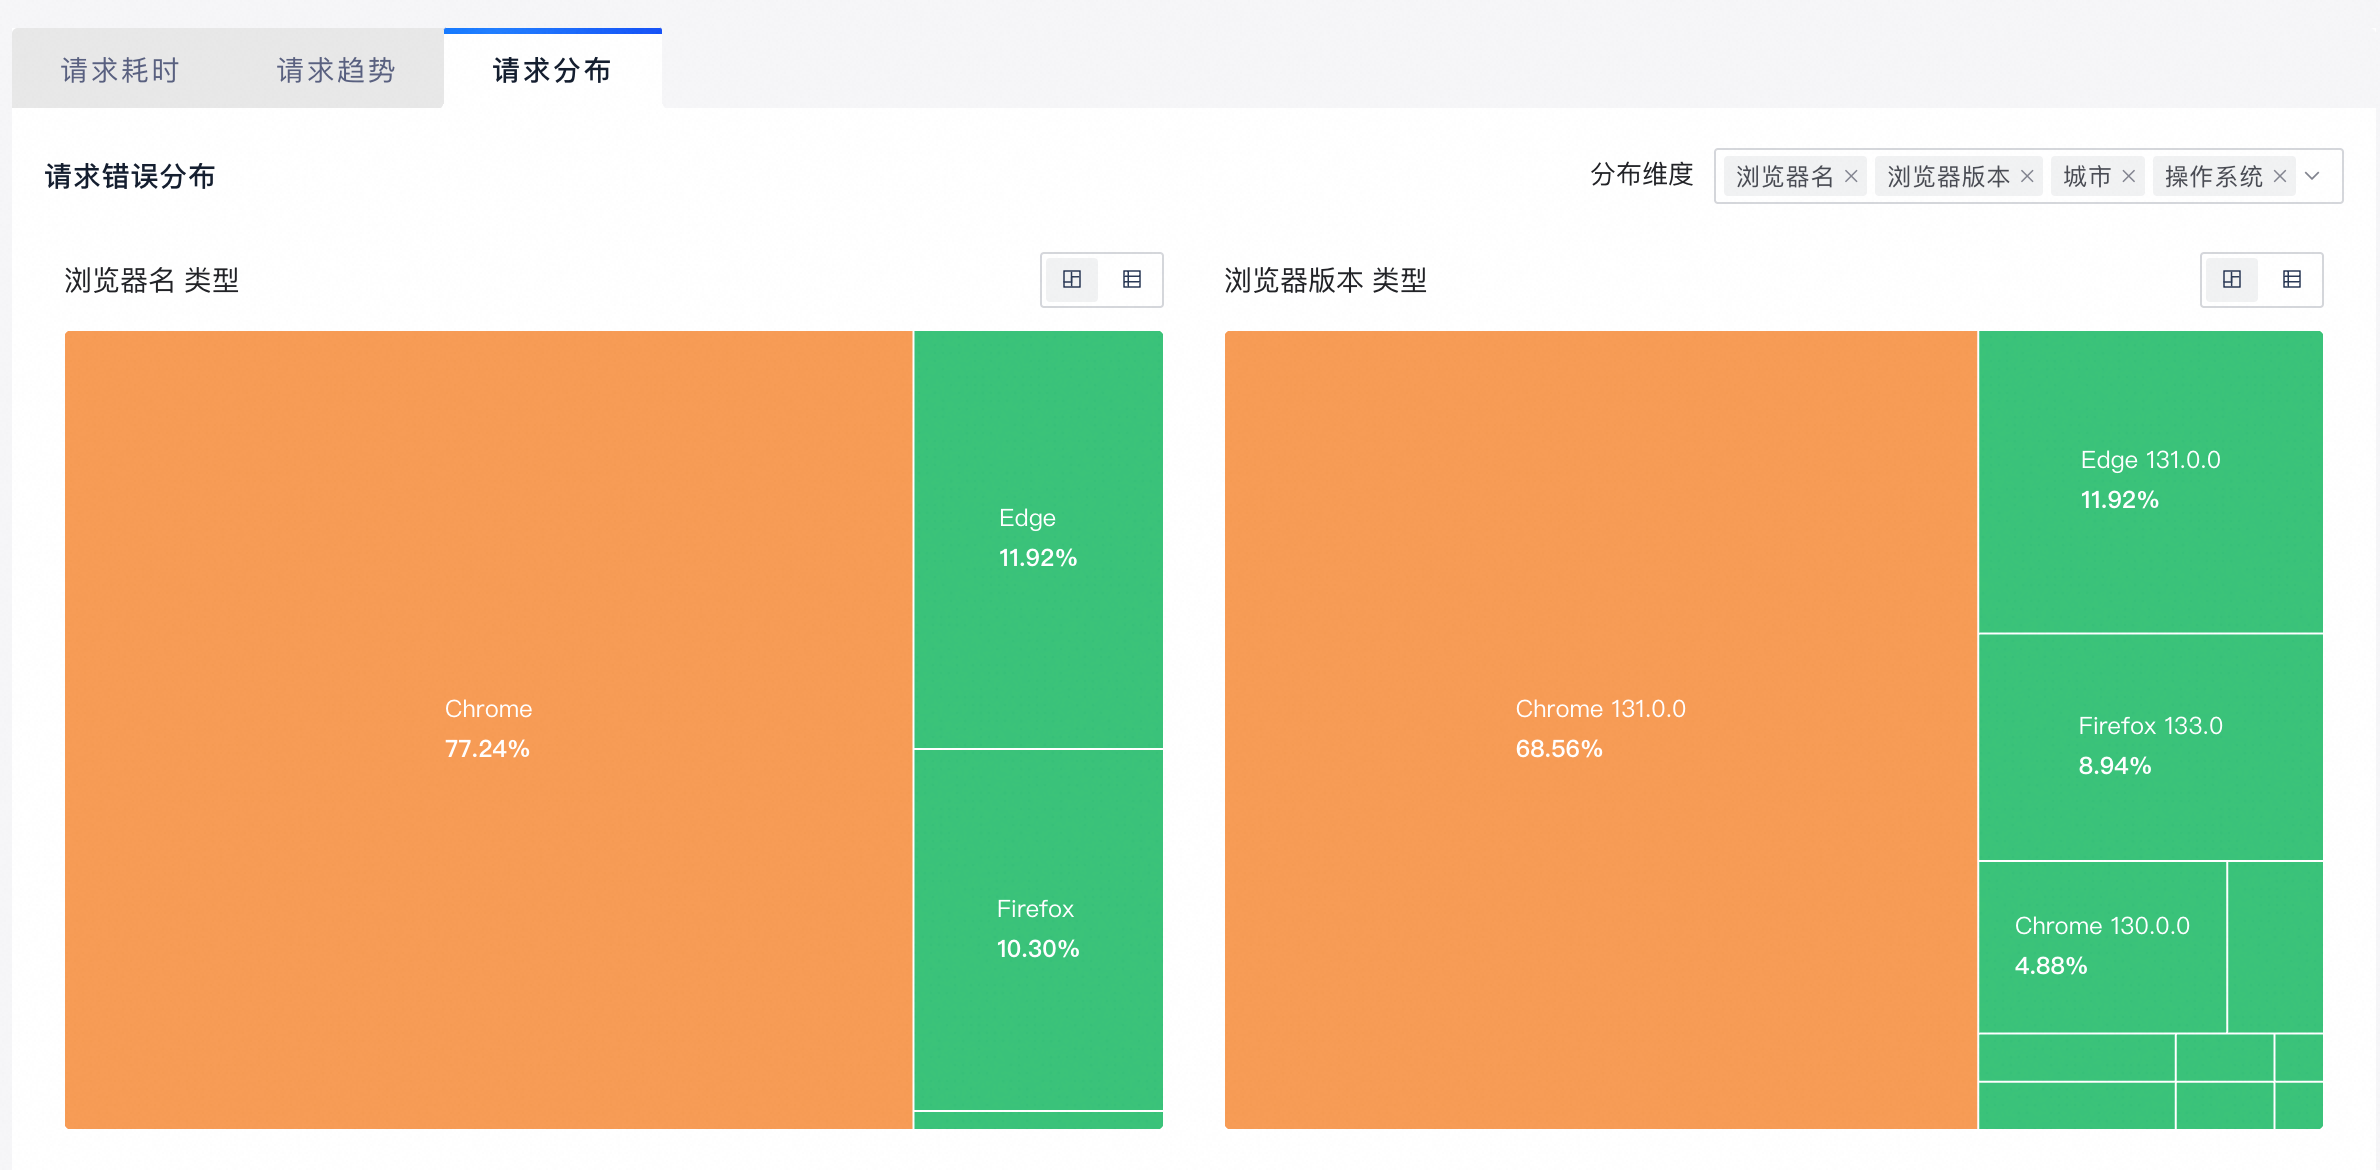
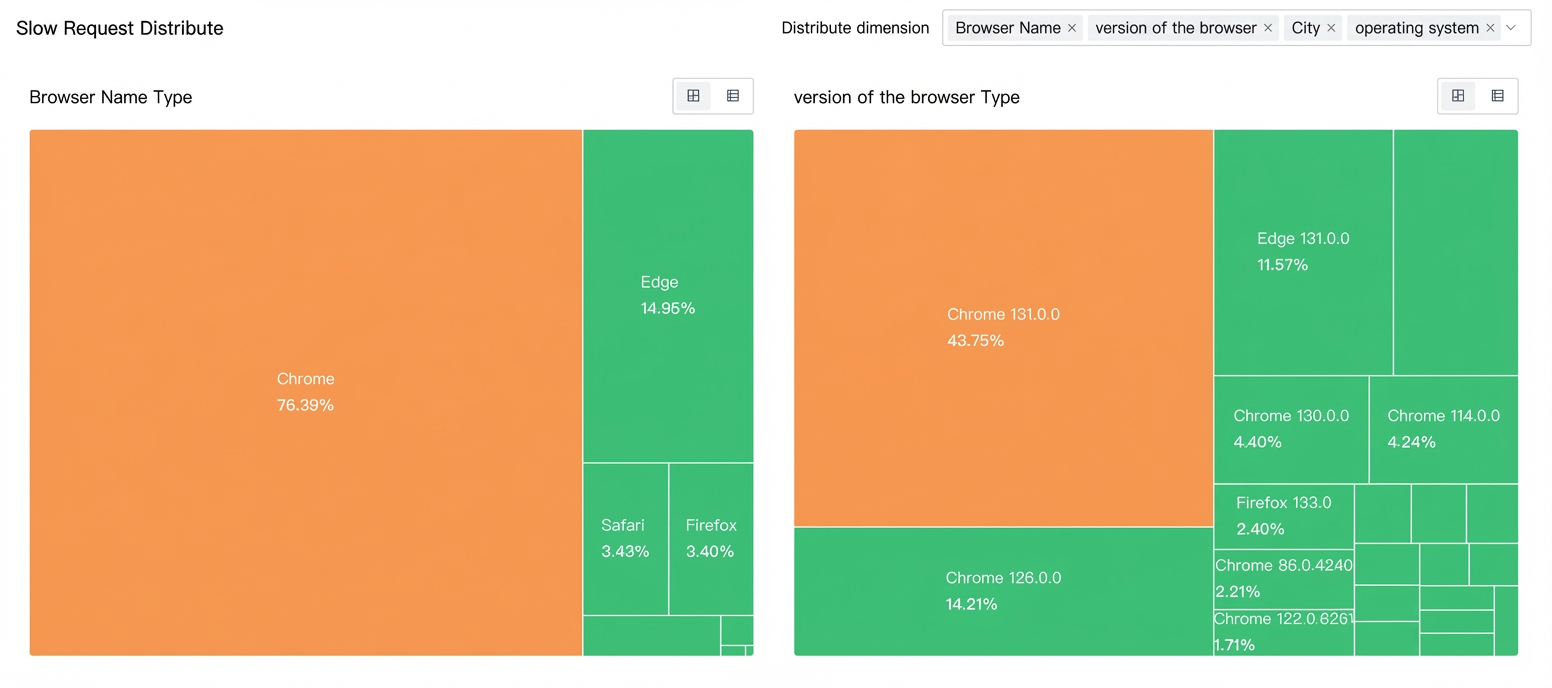
By default, the distribution of issues is displayed across four dimensions: browser, operating system, device model, and city. You can click the Distribution Dimension button and select dimensions from the drop-down list to replace the default ones. You can select a minimum of one and a maximum of four dimensions.
You can click
 to switch between the Distribution Ranking and List Ranking views.
Request list
The request list shows a summary of metrics for each request path that matches the filter criteria. The metrics include path, number of requests, number of users, number of errors, number of users affected by errors, slow request rate, and rate of users affected by slow requests.
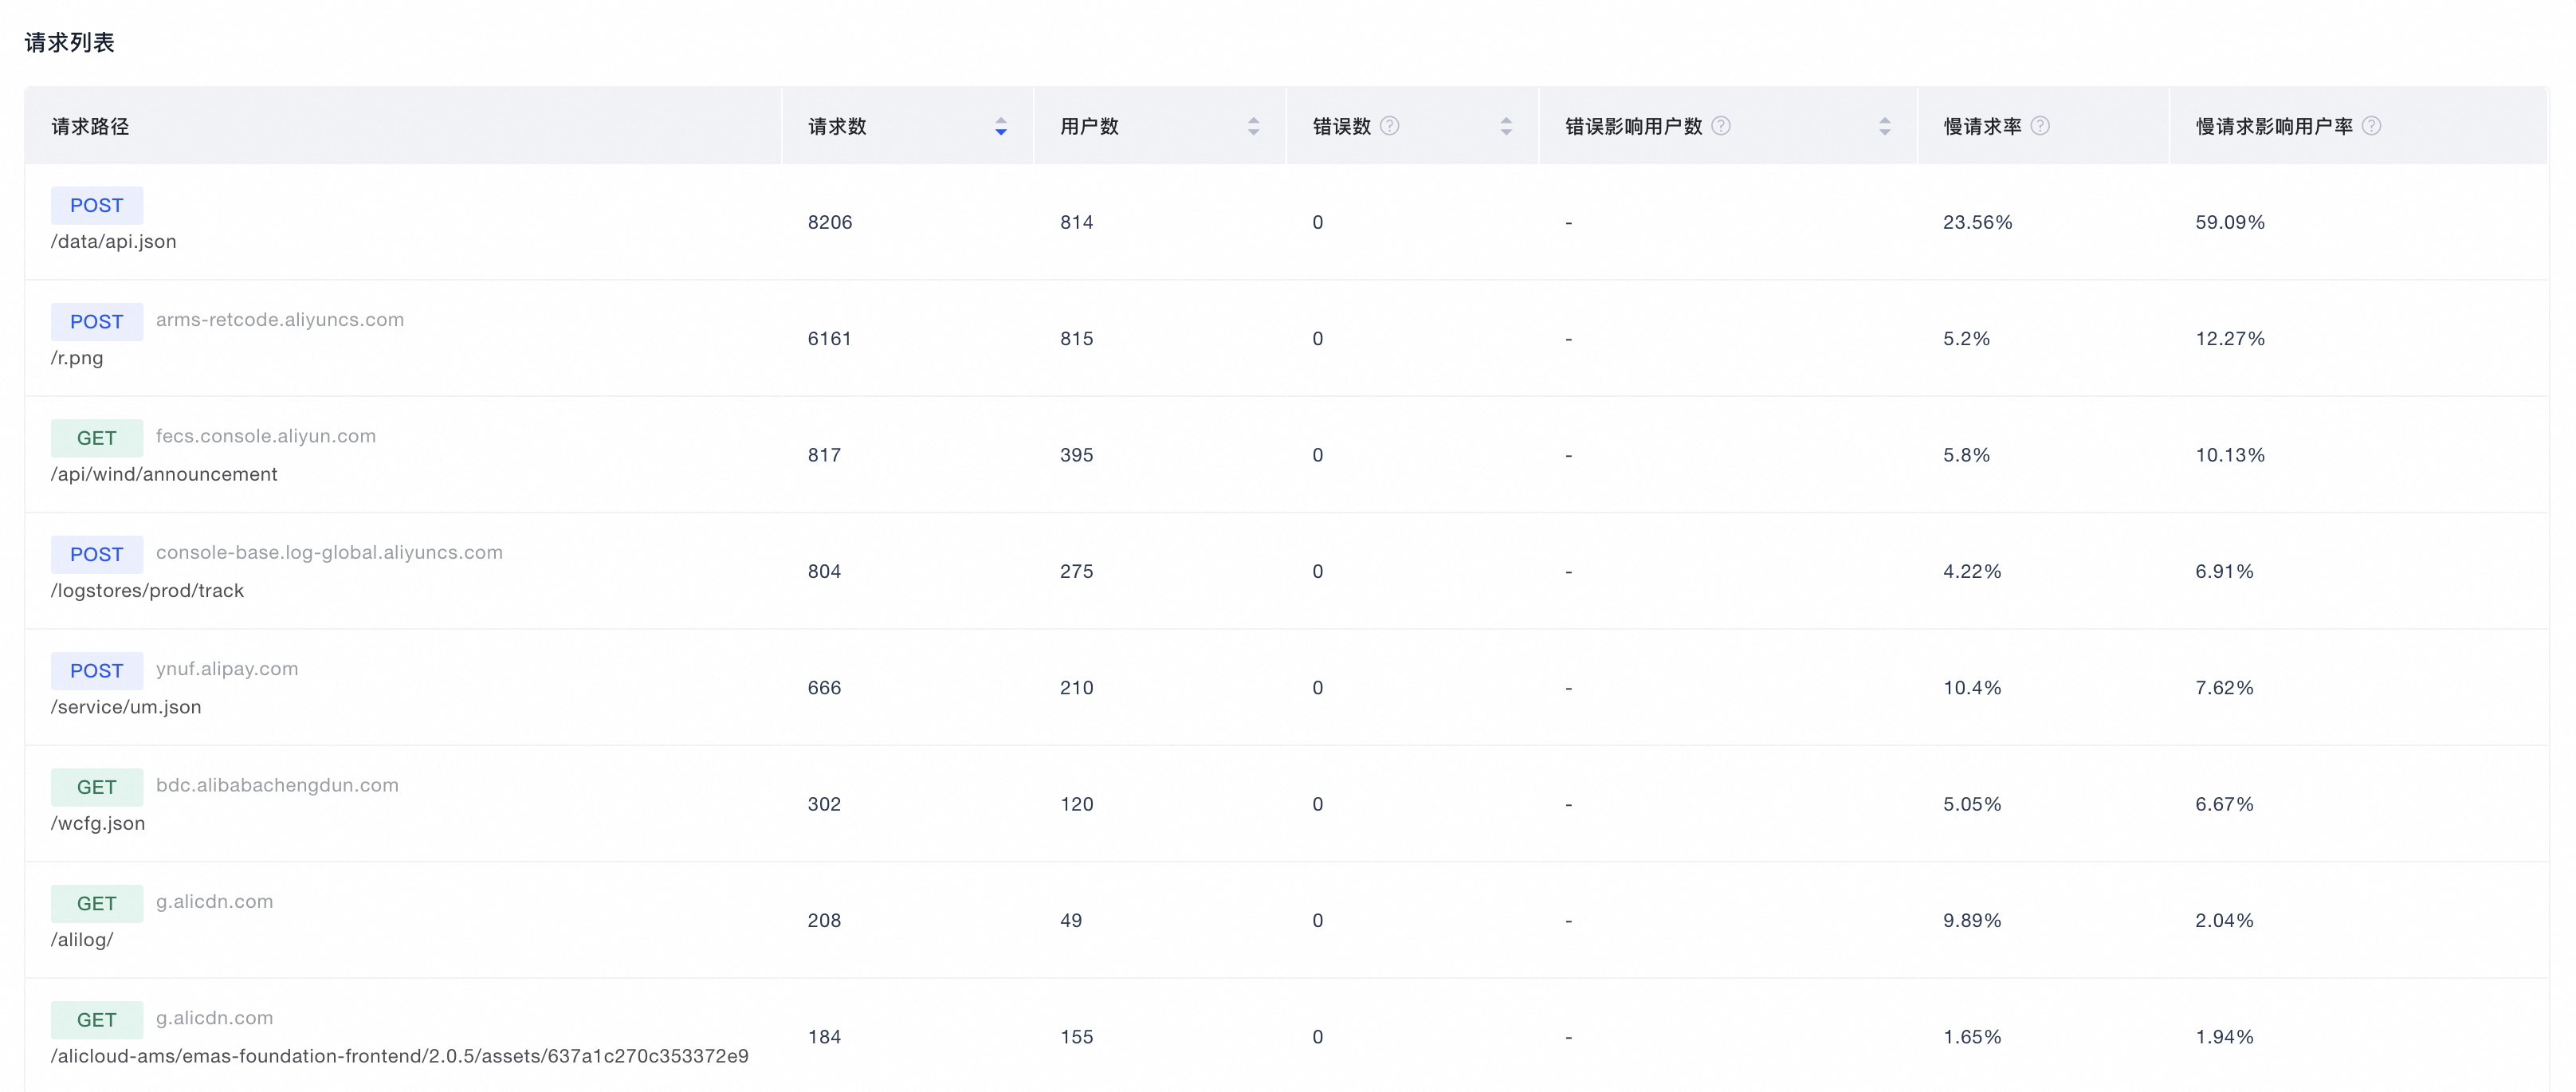
Sorting: You can sort the list by any of the metrics. By default, the list is sorted by the number of requests in descending order.
View details: You can click a request path to open its detailed analysis page.
Issue details
On the request details page, you can perform a detailed drill-down analysis for a specific request path. This page provides basic information, request process analysis, trend analysis, and distribution analysis. The page also shows detailed information for each report from the client.
Basic information
For metric definitions, see Metric definitions - Request metrics.
Detailed information
This section displays all client-reported instances for the same request path, including failed and slow requests. On the left, instances are listed chronologically. You can click an instance to view its basic information and detailed reported fields on the right.
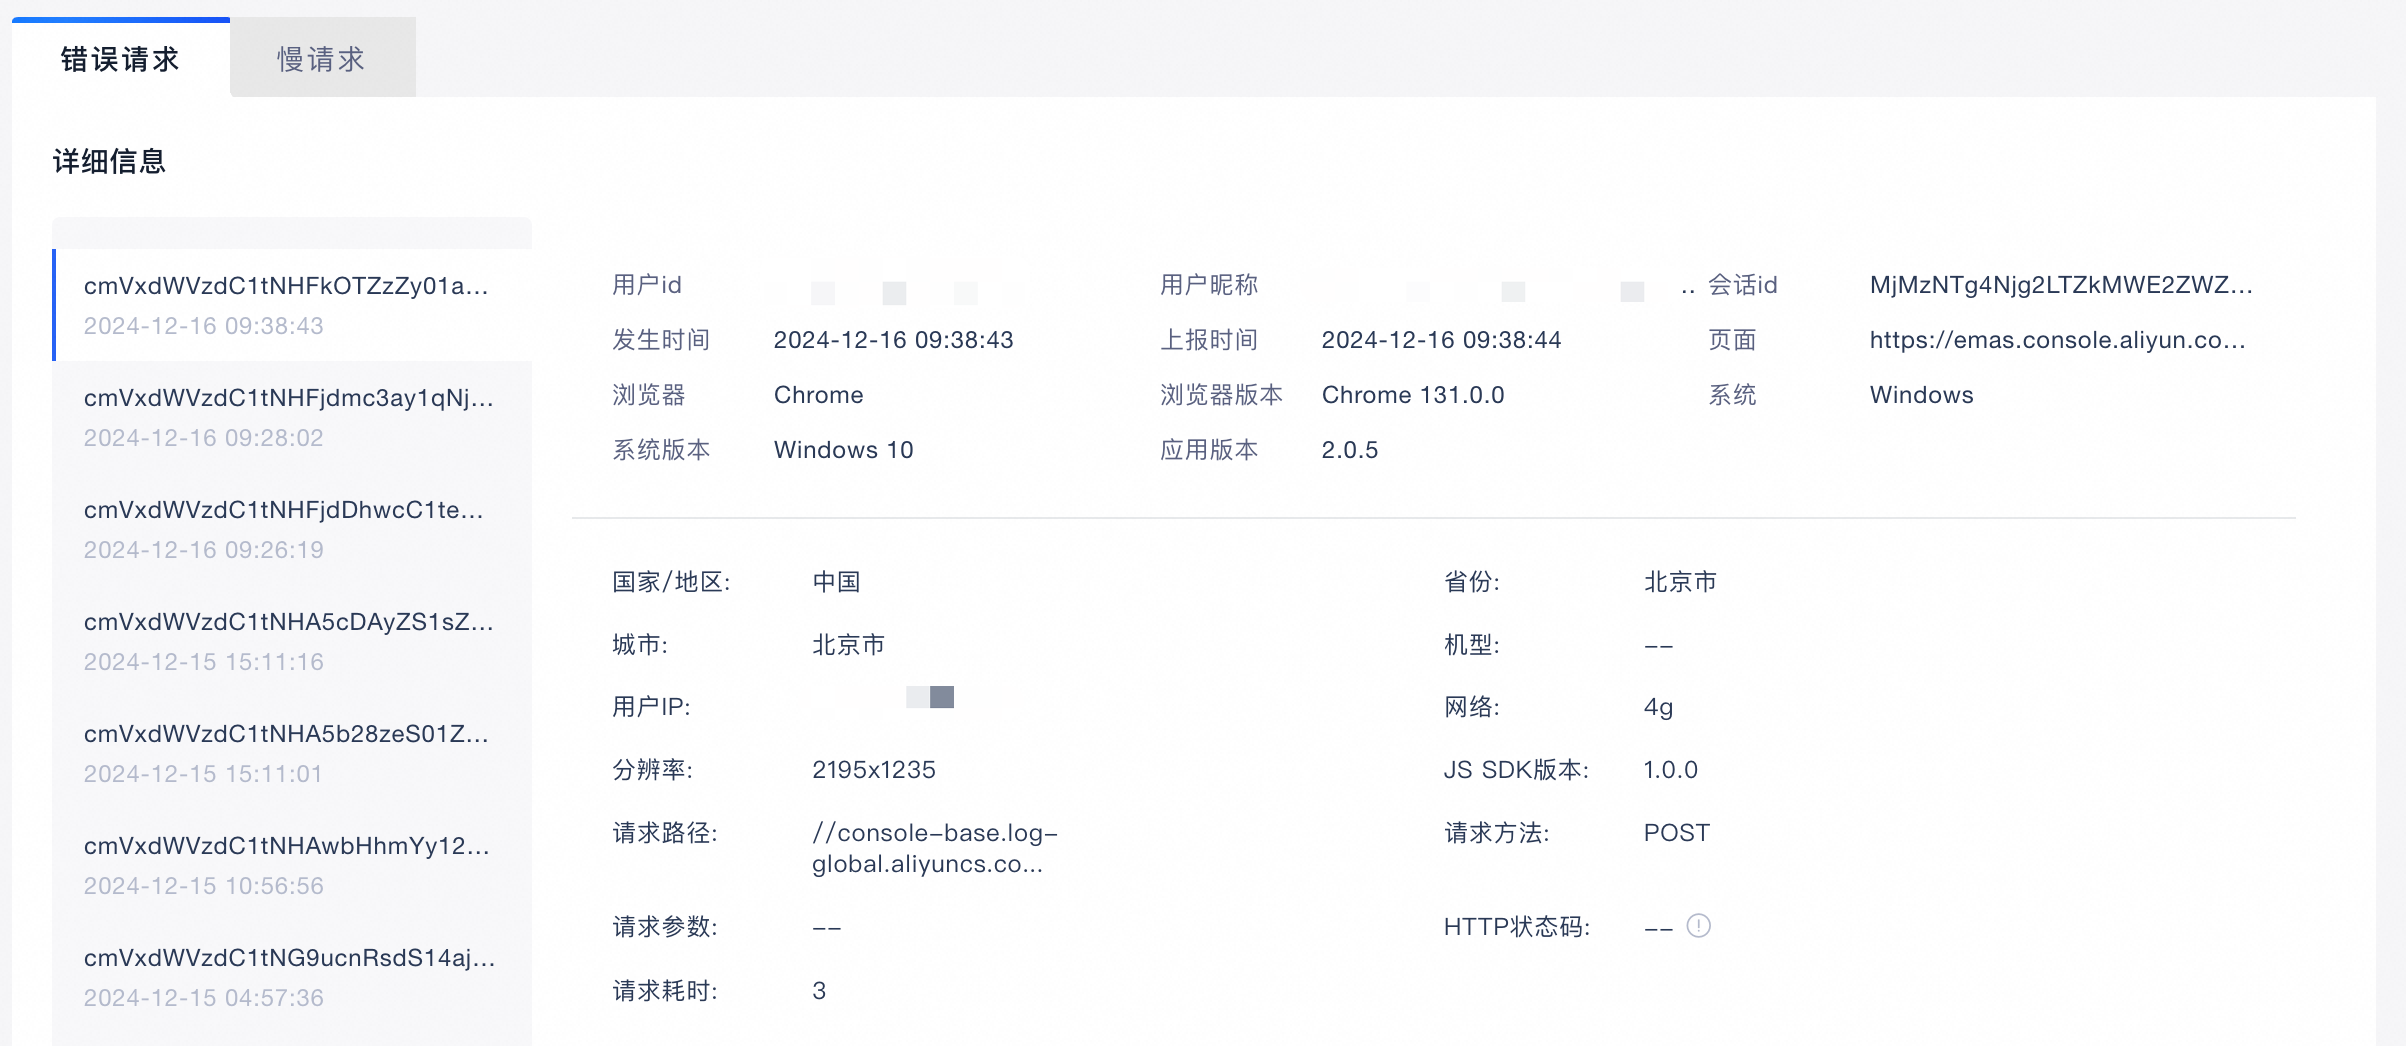
Basic information
The basic information section shows the basic device information for each request. For more information, see Basic information.
Current options
This section shows detailed information for each request.
Parameter |
Description |
Country/Region |
The geographic location of the device, estimated from the IP address. |
Province |
The province where the device is located. |
City |
The city where the device is located. |
Device model |
The model identifier of the device. |
User IP |
The public IP address of the device. |
Resolution |
The resolution of the device. |
JS SDK version |
The version number of the SDK used. |
Request path |
URI parameters |
Request method |
The method of the request. |
Request parameters |
The parameters in the request body. |
HTTP status code |
The HTTP status code of the request. |
Request duration |
Request duration |
Additional information
To control costs, you can configure sampling rules and the sample rate in Reporting Configuration > Request.