Asight Systems Quick Start
1. Overview
Asight Systems is a performance analysis suite for PPU programs. It traces various CPU and GPU events, displays them on a timeline, and helps you perform system-level analysis to identify performance bottlenecks. Asight Systems consists of two tools:
asys command-line tool: Runs on Linux to collect events from a target application and generate reports. It supports collecting various event types, such as HGGC, HGTX, and OSRT, along with their call stack information, and provides flexible methods for starting and stopping collection.
Asight Systems GUI: Displays reports on Windows and macOS. It provides multiple views to present data, such as TimelineView, EventsView, and FunctionTable, smoothly handles massive datasets, and is easy to use.
To use the Asight Systems suite:
Use the asys command-line tool to trace a target application and generate a report.
Open the report in the Asight Systems GUI for analysis.
2. Obtaining and Installing
The tool is pre-installed on official images.
2.1 Obtaining the asys CLI
Configure environment variables
Navigate to the PPU_SDK directory and run the following script to set the required environment variables:
source envsetup.shCheck the operating environment
After setting the environment variables, run the following command to verify that your environment supports asys tracing and sampling:
asys statusIf the command output indicates that the sampling environment check has passed, you can use asys to collect application trace data.
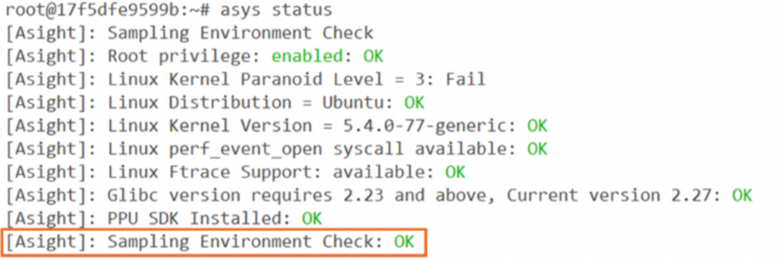
Tip: If some configuration checks fail, the asys command-line tool can still run, but certain features may be affected:
If the root privilege check fails, you cannot perform CPU sampling or collect call stacks.
If the perf_event_open syscall check fails, you cannot collect call stacks. If you are using docker, you can add the
--pid=host--privileged=trueparameters to the 'docker run' command to enable perf_event_open.If the Ftrace check fails, you cannot use CPU sampling. To enable Ftrace while using docker, you can add the
-v/sys/kernel/debug:/sys/kernel/debugparameter to the 'docker run' command to mount the Ftrace directory. Also, ensure the /sys/kernel/debug directory on the host machine is not empty.
2.2 Obtaining the Asight Systems GUI
The Asight Systems GUI installation package is released separately and supports the following operating system versions:
Windows 10, Windows 11
macOS 10.15 or later
Click the download link to go to the download page and select your required version. For Windows machines, download the .msi installer; for macOS machines, download the .dmg installer.
You need an account and password to download the software package. Contact your account manager (PDSA) to obtain them.
3. Quick Start
In this guide, the device that runs a PPU program is called the target machine, and the device used for viewing reports is the host machine. The workflow involves using the asys command-line tool on the target machine to collect a report, and then using the Asight Systems GUI on the host machine to open the report for analysis.
3.1 Collecting reports with asys
On the target machine, run the asys profile command to specify trace options, run an application, and generate a trace report. The syntax for the profile subcommand is: asys profile [option] <application> [applicationargs]
For example, to collect data for a target application named 'test', use the following command:
asys profile -o report testThe preceding command produces the following output and generates a file named report.asysrep in the same directory.
[Asight]:Profile executed.
[Asight]:Starttraceservice,thismaytakeawhile...
[Asight]:Startingtargetapp:./test
[Asight]:Targetapplicationpid:125290,pgrp:125290
[Asight]:Collectingdata...
[Asight]:Alltargetapplicationcreatedprocessesareterminated.
[Asight]:Tracewrittenintotheoutputfile:report.asysrep
The asys tool supports various trace options, such as hggc, hgtx, and acblas. It also supports collection control and an interactive collection mode. For more information, see Use the asys command-line tool to capture reports.
Tip: Keep report files under 200 MB. To reduce the report size, you can disable CPU sampling by specifying the asys '-s none' option (see CPU and thread activity tracing) or reduce the sampling duration by controlling the collection process (see Control the collection process).
3.2 Viewing reports
Reports collected by the asys command-line tool have the .asysrep file extension and can be viewed in the Asight Systems GUI. You can open a report file in the following ways:
From the main menu: Go to File > Open...
Drag and drop the file into the main Asight Systems GUI window.
From the context menu: Right-click a blank area in the Project Explorer and select Open...
From the GUI tool's command line, run a command such as
asys-ui report.asysrep.
Report files (.asysrep) are self-contained and can be shared with other users. However, the Asight Systems GUI version must be the same as or newer than the tool version used to collect the report. The GUI notifies you if you try to open a report collected with a newer command-line tool. For more details about the Asight Systems GUI, see Using the Asight Systems GUI to view reports.
3.3 Remote collection with the GUI
As an alternative to collecting reports on a target machine with the asys command-line tool, you can perform remote collection from the host machine via SSH.
3.3.1 Target machine prerequisites
Ensure that the target machine meets the following requirements:
PPU_SDK is installed.
The SSH service is enabled.
If using password authentication, ensure an SSH login password is set.
For information about installing the SSH service, see Install the SSH service.
3.3.2 Starting remote collection
In the menu bar, select Connection > Connect... to open the Connection Dialog, as shown in the following figure:
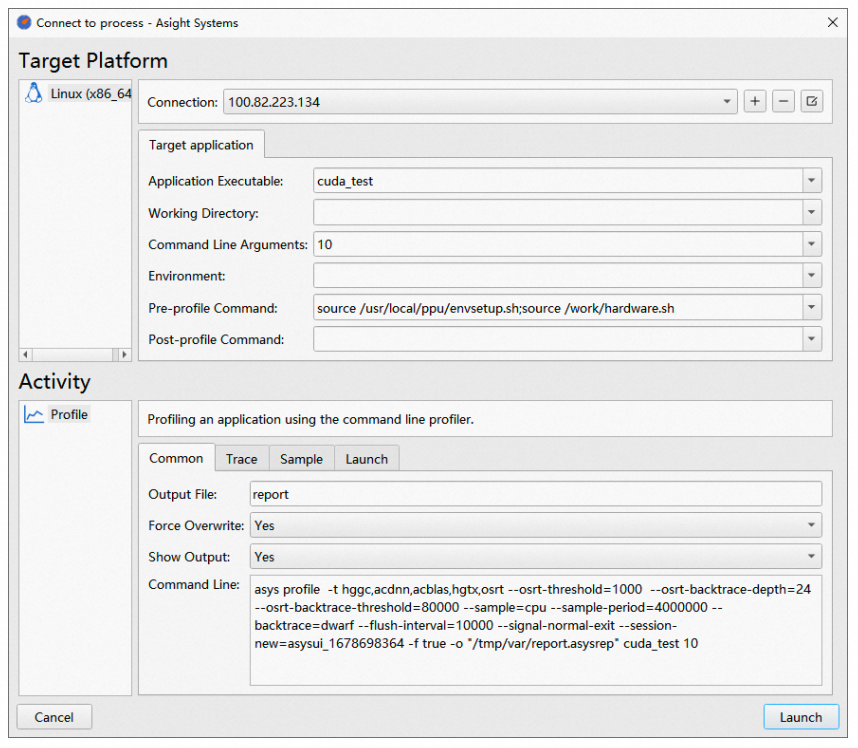
After configuring the target application, report name, and connection information, click the Launch button to start collection, as shown in the following figure:
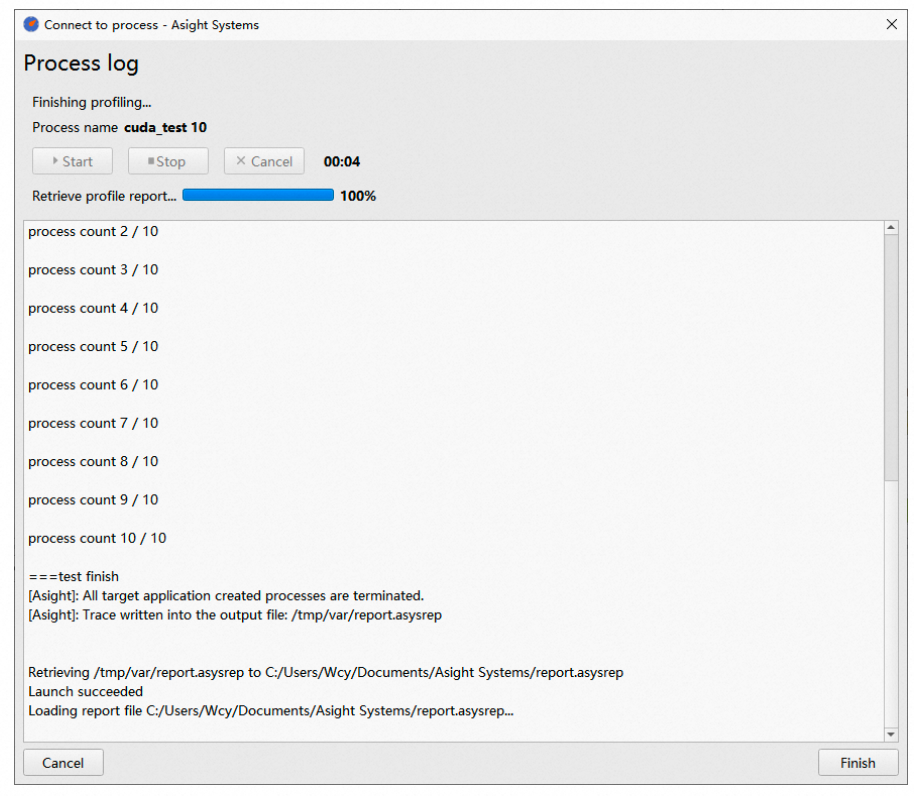
When collection is complete, the report automatically opens in the GUI. For more details about remote collection, see Connection Dialog.