Capture reports with the asys CLI
The Asight Systems command-line tool, asys, lets you capture performance analysis data from a target application and generate a report without a GUI. You can then copy the report to another system for GUI-based analysis.
asys provides the following functionality:
Capture trace information
Capture execution information for CUDA/cuDNN/cuBLAS/NVTX/OSRT APIs.
Capture kernel execution and memory operation information on PPU devices, and correlate CPU and PPU information.
Capture execution information for PCCL communication.
Capture call stacks for CUDA/OSRT APIs.
Capture CPU scheduling information and call stacks during CPU execution, and use them to calculate the execution time percentage for each function.
Capture memory usage information for both the PPU and the CPU.
Capture metrics such as network interface card throughput.
Control the collection process
Control the collection duration, delay the start of trace capture, and manually interrupt the collection process.
Specify the collection scope using NVTX ranges.
Specify the collection scope using the CUDA profiler API (cudaProfilerStart/Stop).
Trigger trace capture in loops and specify the number of iterations.
Automatically generate report names and use macros to compose them.
Customize the application runtime environment by configuring environment variables and controlling application output.
Capture trace information for daemon applications and specify how to wait for them to exit.
Enable long-duration capture by rotating report files.
Capture traces interactively
Independently control application startup and trace capture with the start, stop, launch, and shutdown subcommands.
Start and stop trace capture multiple times while an application is running.
Manage multiple concurrent collection processes and view a list of active sessions.
Attach to a running application to capture trace information with the attach subcommand.
Analyze data and perform post-processing
Generate grouped statistics for device memory usage.
Analyze PPU utilization.
To configure the asys environment, see Configure the asys command-line tool.
You can run the asys -h command to view help. asys supports multiple subcommands for various trace capture methods:
root@0b0f55fa89fd:~# asys -h

usage: asys [--version] [--help] <command> [<args>] [application] [<application args>]

The most commonly used asys commands are:
profile       Run an application and capture its profile into a asysrep file.
attach        Attach to process and capture its profile into a asysrep file.
launch        Launch an application ready to be profiled.
start         Start a profiling session.
stop          Stop a profiling session and capture its profile into a asysrep file.
cancel        Cancel a profiling session and discard any collected data.
shutdown      Disconnect launched processes from the profiler and shutdown the profiler.
sessions      List active sessions.
status        Provide current status of CLI or the collection environment.
export        Export asysrep file into another format.
stats         Generate statistics from an existing asysrep or SQLite file.
analyze       Identify optimization opportunities in a asysrep file.

Use 'asys --help <command> ' for more information about a specific command.
To view help for a specific subcommand, run asys <sub_command> -h. For example, to view help for the profile subcommand, run this command:
asys profile -hTo view your asys version, run this command:
asys -v1. Capture trace information
Use the asys profile command to specify trace items, run an application, and generate a trace report.
The profile subcommand uses the following syntax: asys profile [option] <application> [application args]
1.1 Specify trace items
Use the --trace or -t option to enable specific trace types (trace items). Separate multiple trace items with a ,. For example:
asys profile -t hggc,hgtx,acblas -o baseline python test_linear.py-t hggc,hgtx,acblasenables the hggc, hgtx, and acblas trace items.-o baselinesets the output report name (no file extension required).python test_linear.pyruns the application.
When the application finishes or you interrupt it with Ctrl + C, asys generates a trace report (such as baseline.asysrep) that you can view in Asight Systems.
2. Control the collection process
2.1 Control collection timing
Use the--delay or-y option to set a delay before trace collection begins. Use the--duration or-d option to set the collection duration. After the duration expires, asys stops the application and generates a report. For example:
asys profile -t hggc --delay 2 --duration 3 python test_linear.py--delay 2: Starts collection 2 seconds after the application launches.--duration 3: Sets the collection duration to 3 seconds, after which asys stops the application and generates a report.
The following figure illustrates the collection process.
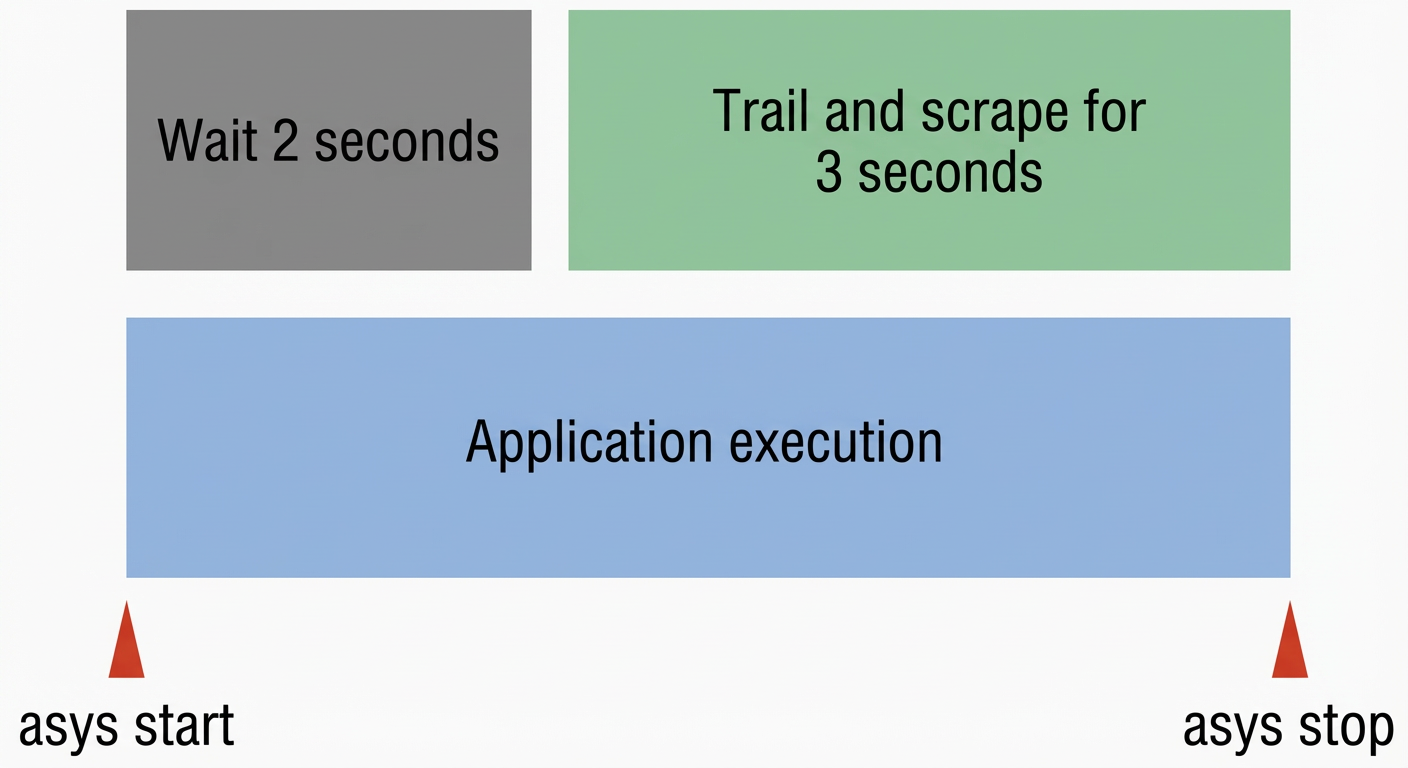
Tip: To keep the application running after the collection duration ends, use the--kill none option.
2.2 Limit the report file size
Use the--max-report-size option to set a maximum size for the asysrep report file in megabytes (MiB). asys stops the trace collection if the report file exceeds this limit. For example:
asys profile -t hggc --max-report-size 10 python test_linear.py--max-report-size 10: Sets the maximum report file size to 10 MiB. Collection stops if the report file exceeds this size.
Tips:
If you set both
--max-report-sizeand--duration, asys stops the trace collection whichever limit is reached first.When used with the
--trace-rotationoption, the--max-report-sizeoption limits the size of each report file during trace rotation.asys stops collection after the report reaches the size set by
--max-report-size. Because the stopping process itself can append additional trace data, the final report file might be slightly larger than the specified limit.
2.3 Event-triggered trace collection
To precisely control the trace capture range, you can insert specific events into your application and use them to trigger the start and end of trace collection in asys.
asys supports two event trigger methods, specified with the--capture-range or-c option. The available triggers are described below:
Value | Description |
hggcProfilerApi | Starts on Ends on |
hgtx | Starts and ends based on an HGTX or NVTX range. |
none | Default. Does not use an event trigger. |
For example, to usehggcProfilerApi as the event trigger for a specific code range, insert thecudaProfilerStart() andcudaProfilerStop() API calls into your application code.
cudaProfilerStart(); // profile start
DoProcess();
cudaProfilerStop(); // profile stop
DoOtherProcess();
asys profile -t hggc -c hggcProfilerApi cuda_test-c hggcProfilerApi: Starts trace collection oncudaProfilerStartand stops oncudaProfilerStop. The application then terminates. In this example, asys captures a trace only during the execution ofDoProcess().
Tip: If the application calls a start function (e.g., hggcProfilerStart) multiple times before calling a stop function (e.g., hggcProfilerStop), asys uses the first start call and the first stop call to define the collection range.
For example, to usehgtx as the event trigger for a specific code range, insert an NVTX range named DoProcess into your application code.
for (int index = 0; index < 5; ++index) {
    nvtxRangePushA("DoProcess"); // start
    DoProcess();
    nvtxRangePop(); // stop
}
asys profile -t hggc,hgtx -c hgtx -p DoProcess cuda_test-c hgtx: Specifies HGTX/NVTX as the event trigger source.-p DoProcess: Specifies the HGTX/NVTX range name isDoProcesswithin the default domain. Trace collection starts when theDoProcessrange begins, stops when it ends, and then the application terminates.
When using HGTX/NVTX as the event trigger source, the--hgtx-capture or-p option supports multiple patterns for matching the domain and range:
Value | Description |
range@domain | Matches a range with a specific |
range | Matches a range with a specific |
range@* | Matches a range with a specific |
Whether the trigger method ishggcProfilerApi orhgtx, asys supports triggering collection multiple times (generating a report for each trigger). You can also control the behavior after an end event using the--capture-range-end option:
Value | Behavior |
none | Ignores the end event. After being triggered, collection continues until the application exits or is interrupted by |
stop | Stops trace collection after this end event. The application continues to run, and subsequent trigger events are ignored. |
stop-shutdown | Default. Stops trace collection and terminates the application after this end event. |
repeat[:N] | Repeats event-triggered trace collection up to N times. After N collections are complete, the application continues running, but subsequent triggers are ignored. If N is omitted (e.g., |
repeat-shutdown:N | Repeats event-triggered trace collection N times and then terminates the application. |
The following example repeats trace collection twice, generates two reports, and then terminates the application:
asys profile -t hggc,hgtx -c hgtx -p DoProcess --capture-range-end repeat-shutdown:2 cuda_test-c hgtx: Specifies HGTX/NVTX as the event trigger source.-p DoProcess: Specifies the HGTX/NVTX range name, which isDoProcessin this example.--capture-range-end repeat-shutdown:2: Repeats the trace collection twice and then terminates the application.
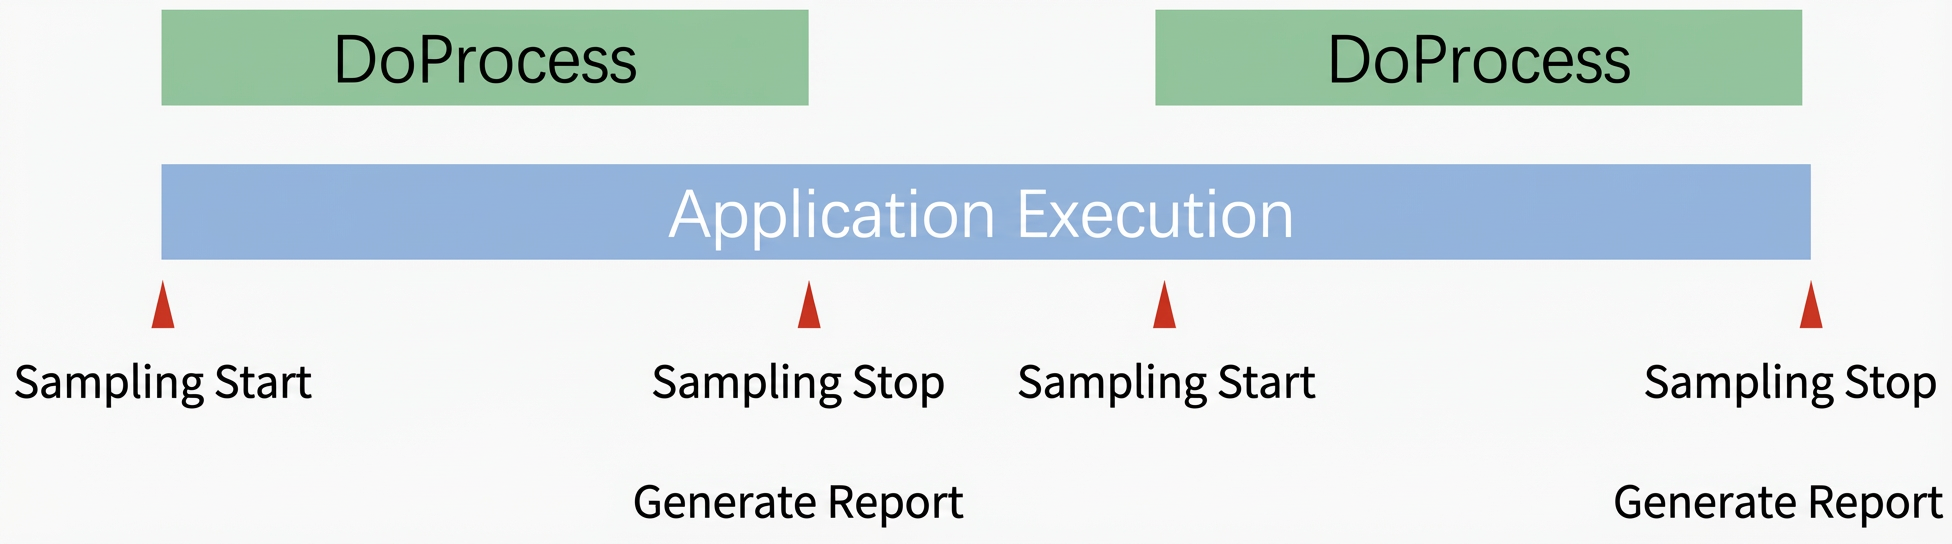
Tip: When--capture-range-end is set torepeat[:N] orrepeat-shutdown:N, if the interval between a stop event and the next start event is very short:
asys might miss the start event and begin collection only upon detecting a subsequent one.
Initial trace data from other concurrently traced processes might be lost.
2.4 Trace rotation for long-running collection
For long-running trace collections, asys supports trace rotation. Enable it by using the--trace-rotation option in combination with the--duration option:
At each interval defined by
--duration, asys generates a report file and begins a new trace collection cycle.Use the
--trace-rotationoption to specify the number of recent report files to keep. asys automatically deletes older files.You can use
--outputto specify a report name template where the %t parameter records the trace start time to avoid duplicate report filenames.
For example, to generate a report file every 30 seconds and keep the three most recent files:
asys profile -t hggc --duration 30 --trace-rotation 3 --output test_report_%t cuda_test--duration 30: Specifies a collection duration of 30 seconds for each cycle.--trace-rotation 3: Keeps the 3 most recent report files.--output test_report_%t: Specifies the report name template, where asys replaces%twith the trace start time. For example, a generated filename could betest_report_08_09_33.asysrep.
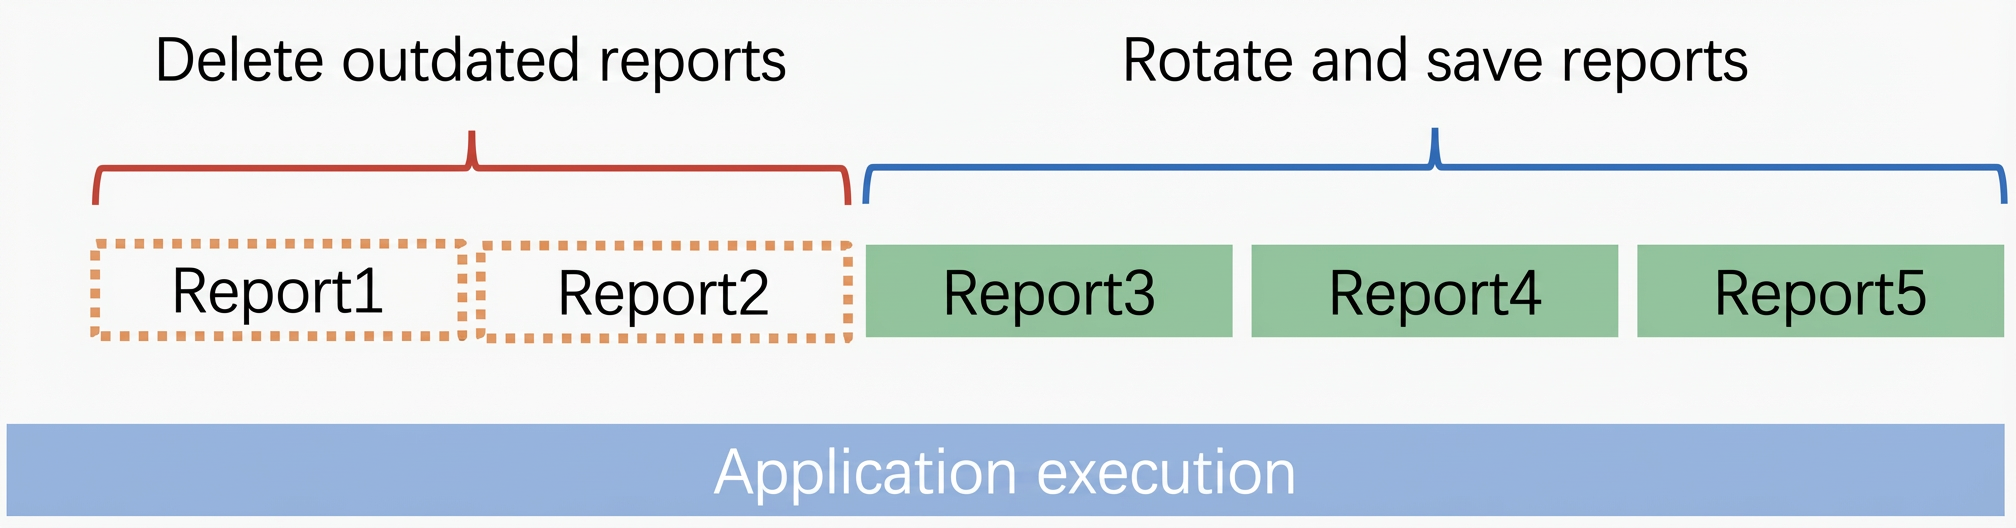
Tips:
The
--trace-rotationoption cannot be used with the--capture-rangeoption.A short gap, during which no data is collected, exists between trace collection cycles.
asys collects trace data continuously until the application terminates. To stop both the application and the trace collection, press
Ctrl + C.
2.5 Specify a report name
Use the--output or-o option to specify a report name (the .asysrep suffix is added automatically). Use the--force-overwrite true or-f true option to allow overwriting a file with the same name. When using the-o option, asys replaces any macro variables in the name with their corresponding values. The following macro variables are supported in the filename:
Macro variable | Replacement value |
%q{ENV} | Value of the "ENV" environment variable. |
%h | The hostname. |
%p | The process ID (PID) of the application. |
%i | A unique index number within the directory to prevent filename conflicts. |
%t | The trace start time, in |
For example:
asys profile -t hggc -o report_%q{HGGC_DRIVER_CANDIDATE}_%i python test_linear.py-o report_%q{HGGC_DRIVER_CANDIDATE}_%i: In this example, the final report file is namedreport_UMD_2.asysrep.asys replaces
%q{HGGC_DRIVER_CANDIDATE}with the value of theHGGC_DRIVER_CANDIDATEenvironment variable.%iis replaced with an index that ensures the filename is unique within the directory.
Tip: The default value for the-o option isreport%i. This prevents accidental overwriting of existing reports when the-o option is not used.
2.6 Customize the application runtime environment
asys allows you to configure the runtime environment for your application:
Use the--env-var or-e option to set environment variables for the application's execution. Separate multiple variables with a comma (,).
Use the--inherit-environment false or-n false option to prevent the application from inheriting system environment variables.
Use the--show-output false or-w false option to suppress the application's console output.
For example:
asys profile -e ENABLE_DEBUG=1,LOG_LEVEL=DEBUG -n false -w false python test_linear.py-e ENABLE_DEBUG=1,LOG_LEVEL=DEBUG: Sets the ENABLE_DEBUG and LOG_LEVEL environment variables for the application.-n false: Prevents the application from inheriting system environment variables.-w false: Suppresses the application's console output.
2.7 Wait for application termination
You can control when asys considers the application to be terminated. By default, asys waits for the main process and all its children to terminate. For example, with an application running as a daemon process, asys waits for the background daemon to exit before stopping trace collection. Use the--wait option to specify the termination condition:
Value | Termination condition |
primary | asys waits for the application's primary process (the initial process) to terminate. |
all | Default. asys waits for all application processes, including re-parented processes, to terminate. |
2.8 System-wide trace collection
By default, asys collects trace data from the application process tree (the root process and all its descendants). If other background applications on the system contend for CPU resources and affect your application's performance, analyzing only the process tree trace might be insufficient to diagnose the issue. To analyze the impact of background applications, you can perform a system-wide trace to collect data from all processes on the operating system.
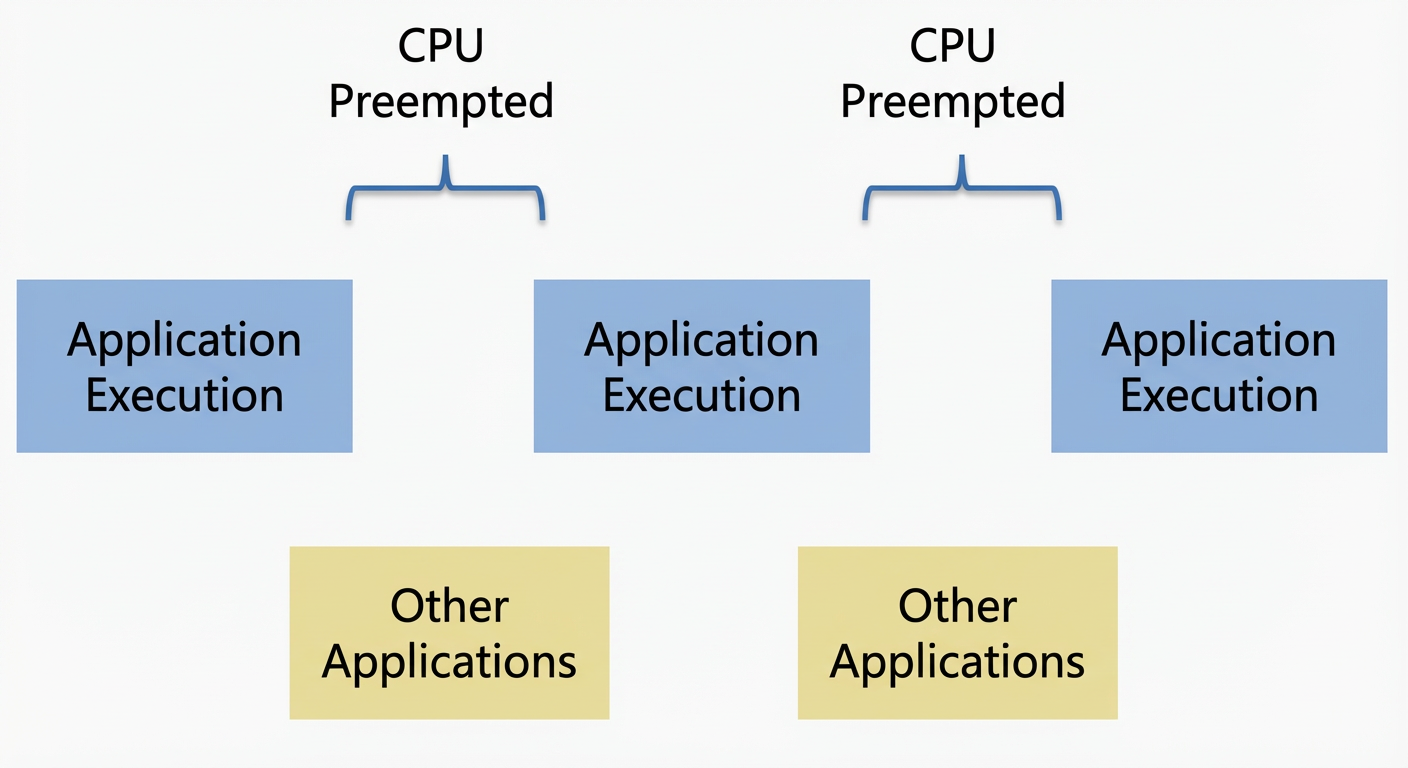
Use the--sample or-s option to enable system-wide trace collection. For example:
asys profile -s system-wide -t hggc python test_linear.py-s system-wide: Collects CPU scheduling trace data from all processes on the system.
You can also perform a system-wide trace without specifying a target application. In this mode, application-specific collection options are unavailable. For example:
asys profile -s system-wide --ppu-metrics-device all --nic-metrics true-s system-wide: Collects CPU scheduling trace data from all processes on the system.--ppu-metrics-device all: Enables metrics sampling for all PPU devices.--nic-metrics true: Collects NIC metrics.
asys provides both system-level and application-level collection options, marked as System scope and Application scope in the help information. The-s option controls the scope of CPU scheduling collection, letting you switch between a system-wide trace (system-wide) and an application-level trace (process-tree). For more details on collection scopes, runasys profile -h.
3. Interactive tracing
In addition to usingasys profile for trace collection, asys supports separate commands to launch an application, start and stop trace collection, and shut it down. This provides flexible control over the tracing process.
3.1 Interactive commands
asys provides the following subcommands to control a tracing session. The options for these subcommands are similar to those for asys profile. To view help information, runasys <subcommand> -h:
asys subcommand | Function |
launch |
|
start |
|
stop |
|
cancel |
|
shutdown |
|
sessions |
|
You can combine these subcommands to flexibly control the timing of application execution and trace collection.
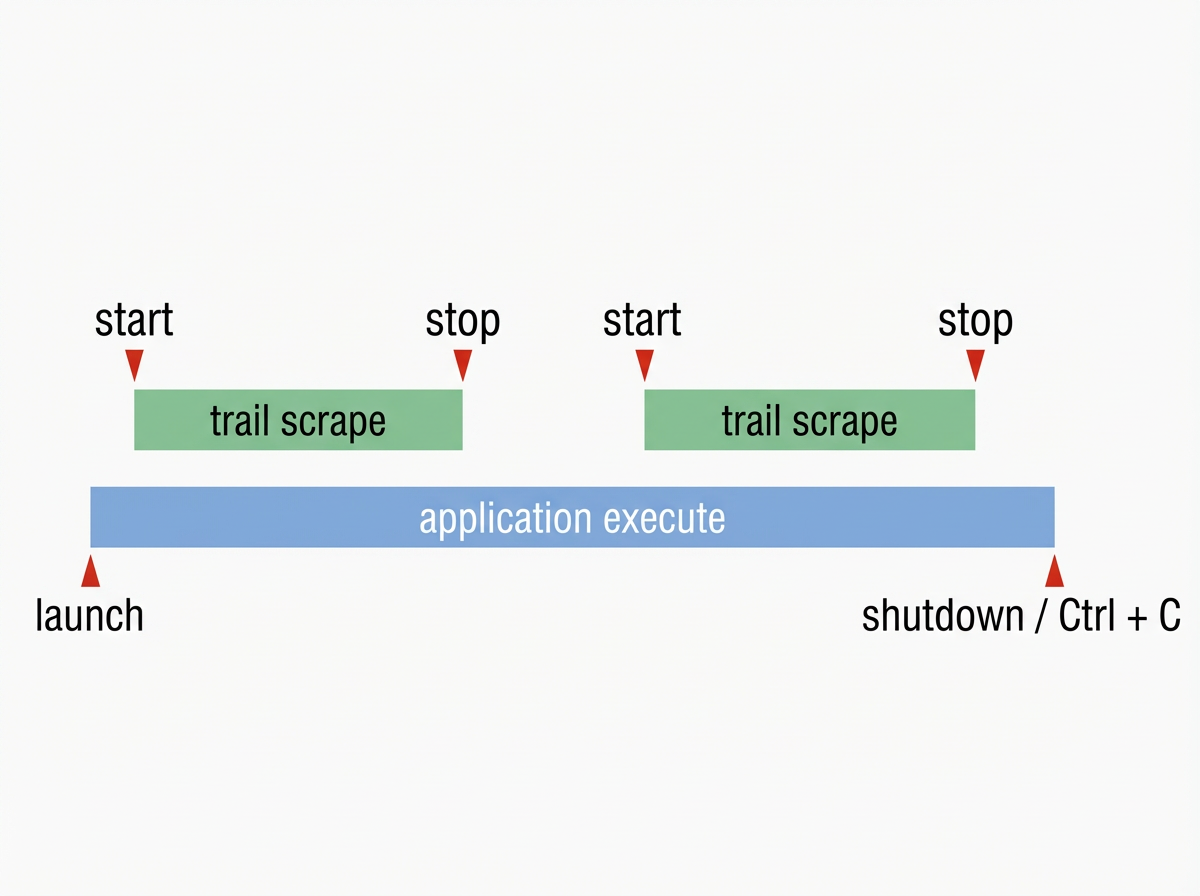
Example: Launch an application, perform two separate trace collections, and then shut down the application:
asys launch -t hggc cuda_test
asys start -o test_report1
asys stop
asys start -o test_report2
asys stop
asys shutdown
asys launch ...launches the application.asys start ...starts a trace collection and specifies the report file.asys stopstops trace collection without stopping the application. You can later runasys start ...to start a new round of trace collection.asys shutdownterminates the application.
Example: Start trace collection with an event trigger condition and then launch the application:
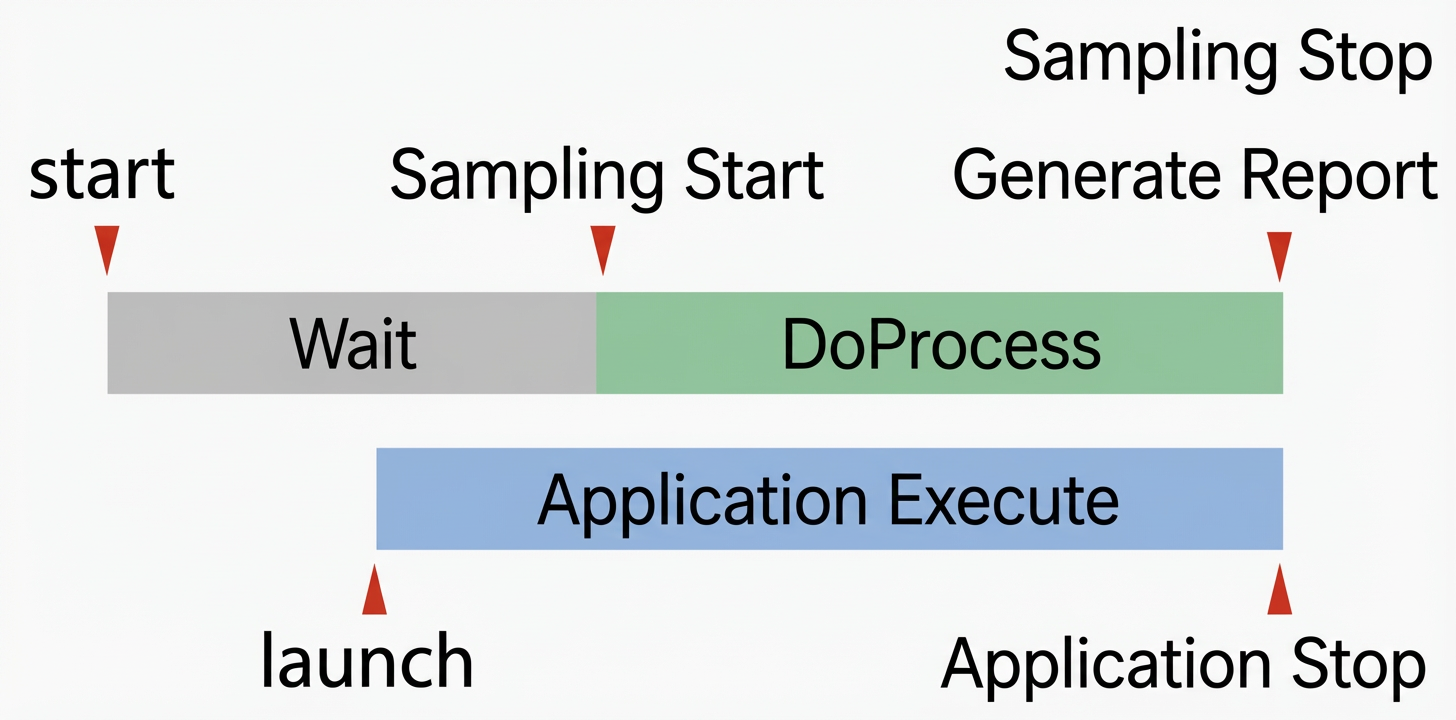
asys start -o test_report -c hgtx -p DoProcess
asys launch -t hggc,hgtx cuda_test
asys start ...arms the trace collection and sets the event trigger condition with the-cand-poptions.asys launch ...launches the application. Sinceasys starthas already armed the collection, monitoring for the trigger event starts when the application launches. Data recording begins only when the specified event trigger condition is met.
3.2 Concurrent tracing sessions
asys lets you run multiple tracing sessions concurrently, for example, multiple asys profile or asys launch / start sequences. Each tracing session corresponds to a session, which has a unique session name and session ID. You can use options to create a new session or associate a command with an existing one.
Session option | Function |
--session-new |
|
--session |
|
For example, run asys launch to create a session, and then run asys start to connect to that session and begin trace collection within it.
asys launch -t hggc --session-new test cuda_test
asys start --session test
--session-new testcreates a session namedtest.--session testassociates the command with the session namedtest.
To view the list of current tracing sessions:
asys sessions list
The ID column shows the session ID for each session. You can use this ID with the --session option to specify a session.
If you omit a session option, the default session names are as follows:
For the
asys profilesubcommand, the session name isprofile-<pid>-<application>.For the
asys launch / start / stop / cancel / shutdownsubcommands, the session name is[default].
Tip: Multiple asys profile commands can run concurrently by default because their session names are unique. However, only one interactive session with the default name can exist at a time.
4. Attach trace collection (Beta)
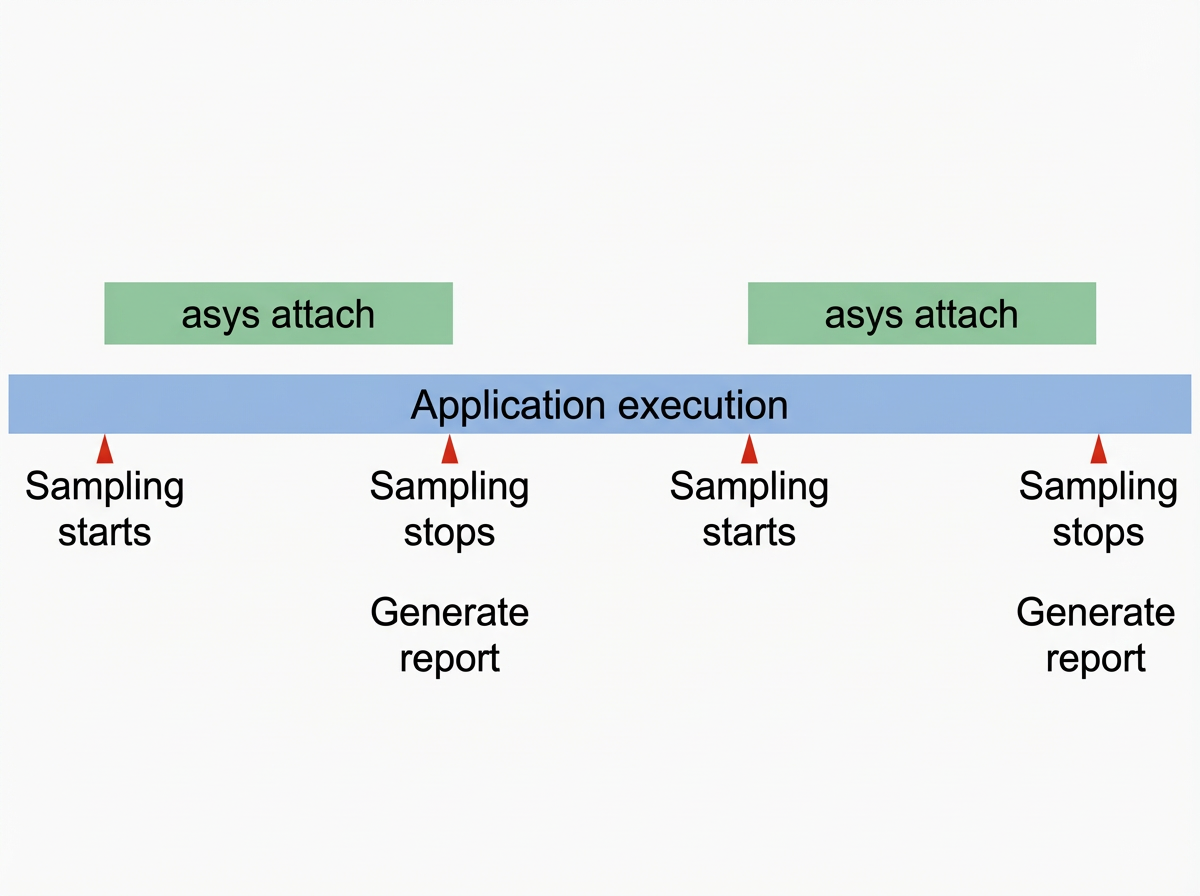
You can use asys to collect trace data by attaching to a running application, even if you did not use asys to launch it. The asys attach command lets you attach to multiple application processes simultaneously and collect data from the same application repeatedly. After collection, the application continues to run without interruption.
4.1 Attach trace collection
The following example shows how to use asys attach to collect traces by attaching to multiple application processes:
asys attach -t hggc -f true -o attach_report 94644,94923-t hggc: Collects HGGC-related traces.-f true: Overwrites an existing report file with the same name.-o attach_report: Specifies the report name asattach_report.94644,94923: Attaches to the processes with PIDs 94644 and 94923 simultaneously. Separate multiple PIDs with a comma (,).
After you run asys attach, it begins collecting trace data. You can either press Ctrl + C to stop the collection and generate a report, or use the --duration option to specify a collection duration. For example:
asys attach -t hggc --duration 10 94644,94923 --duration 10: Collects data for 10 seconds, stops tracing, and generates a report. The application continues to run, unaffected.
asys attach lets you repeatedly collect trace data from an application without stopping it. After collection, the performance impact is minimal, and the tool does not affect the application's operation.
4.2 Supported features
The trace collection features supported by asys attach are similar to those of asys profile. You can run asys attach -h to view the supported features.
The following table describes the data collected for each trace item supported by the -t option:
Trace item | Description |
hggc | Execution time and call stack information for HGGC runtime/driver APIs Execution time and call stack information for CUDA runtime/driver APIs PPU execution information: kernel, memcpy, and memset Correlation between HGGC/CUDA APIs and PPU execution |
pccl | Execution time for each stage of the PCCL communication process |
Other trace collection features supported by asys attach include:
Collects CPU execution information with
--sampleand call stacks with--backtrace.Collects Python call stacks with
--python-sampling.Collects Python function data with
--python-functions-trace.Collects Python backtraces for HGGC APIs with
--python-backtrace.Collects system memory usage with
--host-memory-sampling.Collects device runtime metrics with
--ppu-metrics-device.Collects network interface card runtime metrics with
--nic-metrics.Collects HGGC call stacks with
--hggcbacktrace.Collects device memory and pinned memory usage with
--hggc-memory-usage.
4.3 Notes and limitations
When using asys attach for trace collection, note the following:
asys attachruns only on x86_64 and Arm instruction sets.Attaching to an application with
asys attachmay cause a deadlock.Do not use different release versions of
asys attachon the same application process.
The limitations of asys attach are as follows:
Does not currently support collecting trace data for HGTX, ACDNN, ACBLAS, OSRT, or Video.
Does not support collecting trace data for legacy HGGC graphs that were instantiated before attaching.
Does not support attaching to a process that already uses the HGPTI library.