Page Analysis lets you query metrics for your mobile app pages, such as loading time, slow loading, scroll frame rate, jank, and frozen frames. This helps you determine whether a page issue is caused by slow loading or by scrolling jank.
Key concepts
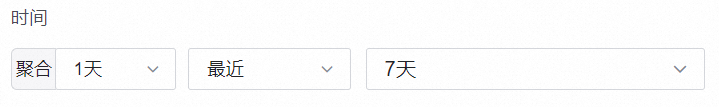
Aggregated data is displayed for a specific time period at 1-minute, 5-minute, 1-hour, or 1-day intervals.
For example, if you select a 1-day aggregation period, data from the last 7 days is displayed.
By default, for 1-minute and 5-minute aggregation periods, data from the last 15 minutes is displayed.
By default, for a 1-hour aggregation period, data from the last 24 hours is displayed.
By default, for a 1-day aggregation period, data from the last 7 days is displayed.
View data analysis
Learn how to view data in Page Analysis.
Log in to the EMAS console. Find and click your project to open the EMAS Overview page.
In the top navigation bar, select DevOps Tools.
In the left-side navigation pane, choose Performance Analysis > Page Analysis.
Configure the filter criteria, and then click Query. For more filter options, see More Searches. The following example is based on a 1-day aggregation period for the last 7 days.
View the Page Overview & Slow Pages and Page Scrolling tabs.
Tab | Description |
Page Overview | Displays the slow loading rate, FPS, jank rate, and an overview of the page list. |
Slow Pages | Displays slow loading trends, distribution, and details. You can also modify the slow loading threshold. |
Page Scrolling | Displays FPS smoothness analysis, jank, frozen frames, and more. |