Page scrolling
This topic explains the charts for analyzing page scrolling performance. Use these charts to monitor metrics like fps smoothness, fps quantile, janky frame rate, and frozen frames to evaluate your app's performance.
Page scrolling
To ensure consistent performance evaluation across devices with different refresh rates, such as 90 Hz and 120 Hz, EMAS Mobile Monitor normalizes frame rates from both Android and iOS to a standard 60 Hz baseline.
Page scrolling analysis also lets you monitor the janky frame rate and the number of frozen frames. The janky frame rate measures scrolling stutter, while the frozen frames metric counts severe frame drops.
Metric | Description |
FPS | The normalized frame rate, converted to a 60 Hz baseline. |
Janky frame | A frame is janky if it meets both of the following conditions: ① The frame time is more than twice the average of the previous three frames. ② The frame time is greater than the duration of two film frames (83.33 ms). |
Janky frame rate | Android: The number of janky frames divided by the total number of frames. iOS: The total time of janky frames divided by the total scrolling duration. |
Frozen frames | The number of frames that take longer than 700 ms to render. |
FPS smoothness distribution
This chart shows the distribution of page scrolling frame rates for the selected filters.
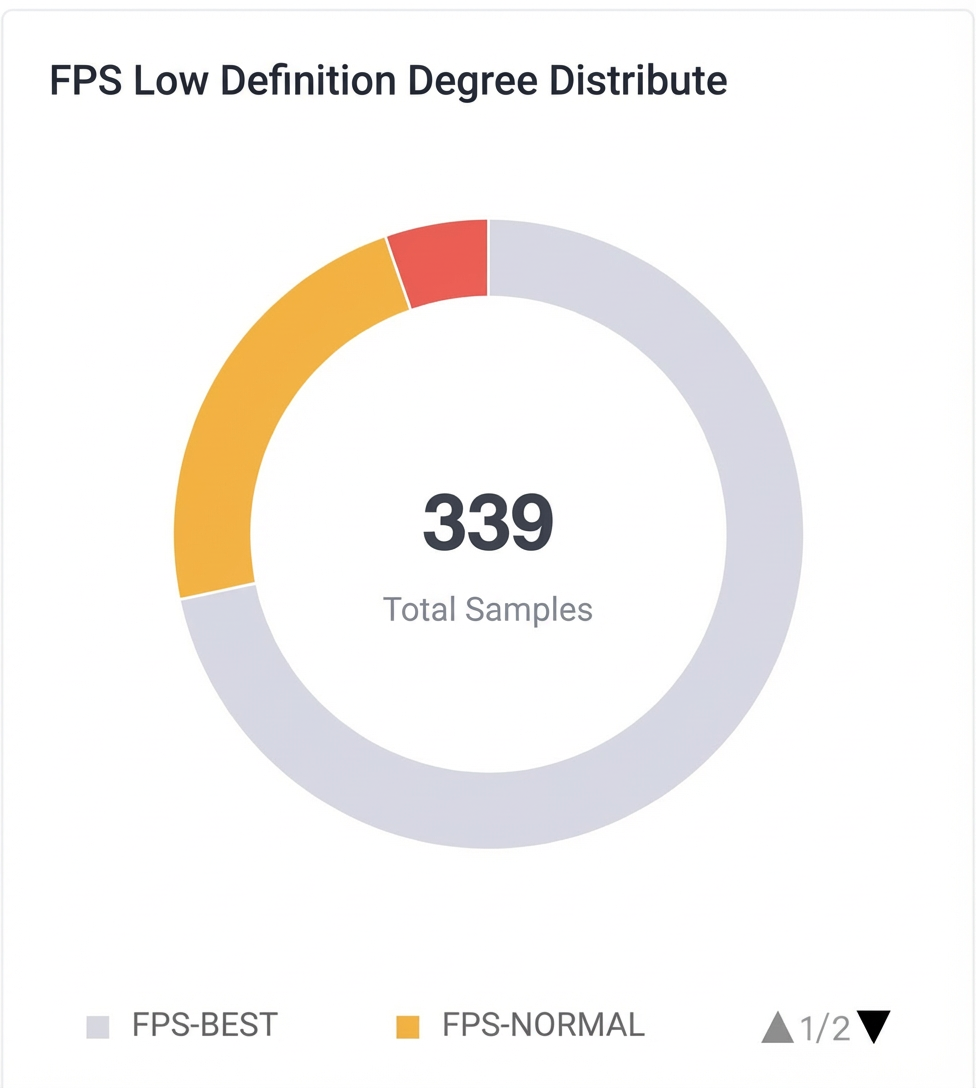
Metric | Description |
FPS-BEST | FPS is greater than 50. |
FPS-NORMAL | FPS is greater than 30 and less than 50. |
FPS-BAD | FPS is less than 30. |
FPS quantile
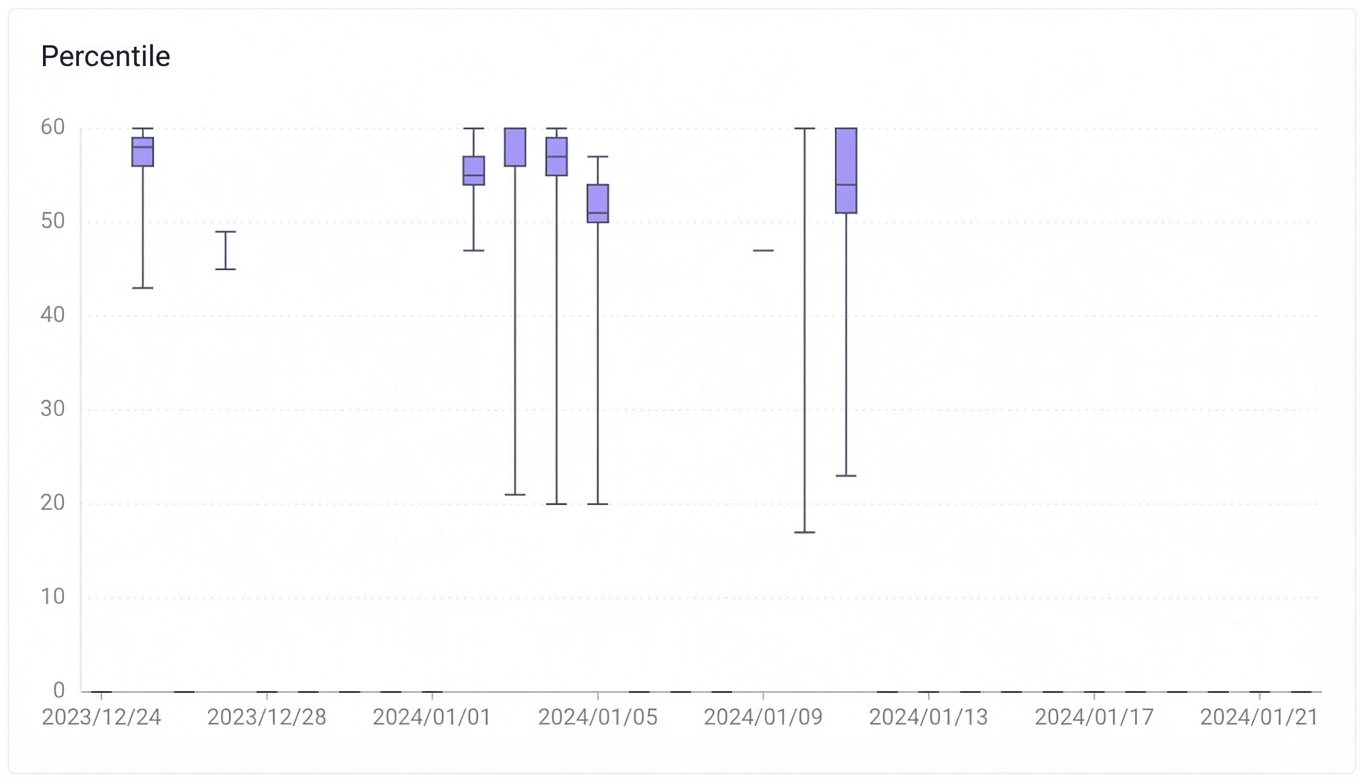
This box plot shows a detailed breakdown of quantiles for the selected filters.
Scrolling trends
Use the trend chart to observe the number of frozen frames and the janky frame rate over time.
Details
View details for individual cases identified by the page analysis.