Page overview and slow pages
This topic describes the charts available on the page overview and slow pages dashboards. Use the page overview dashboard to monitor the overall health of your pages. Use the slow pages dashboard to analyze page samples that exceed the slow load threshold.
Page overview
Metric | Description |
Slow load rate |
|
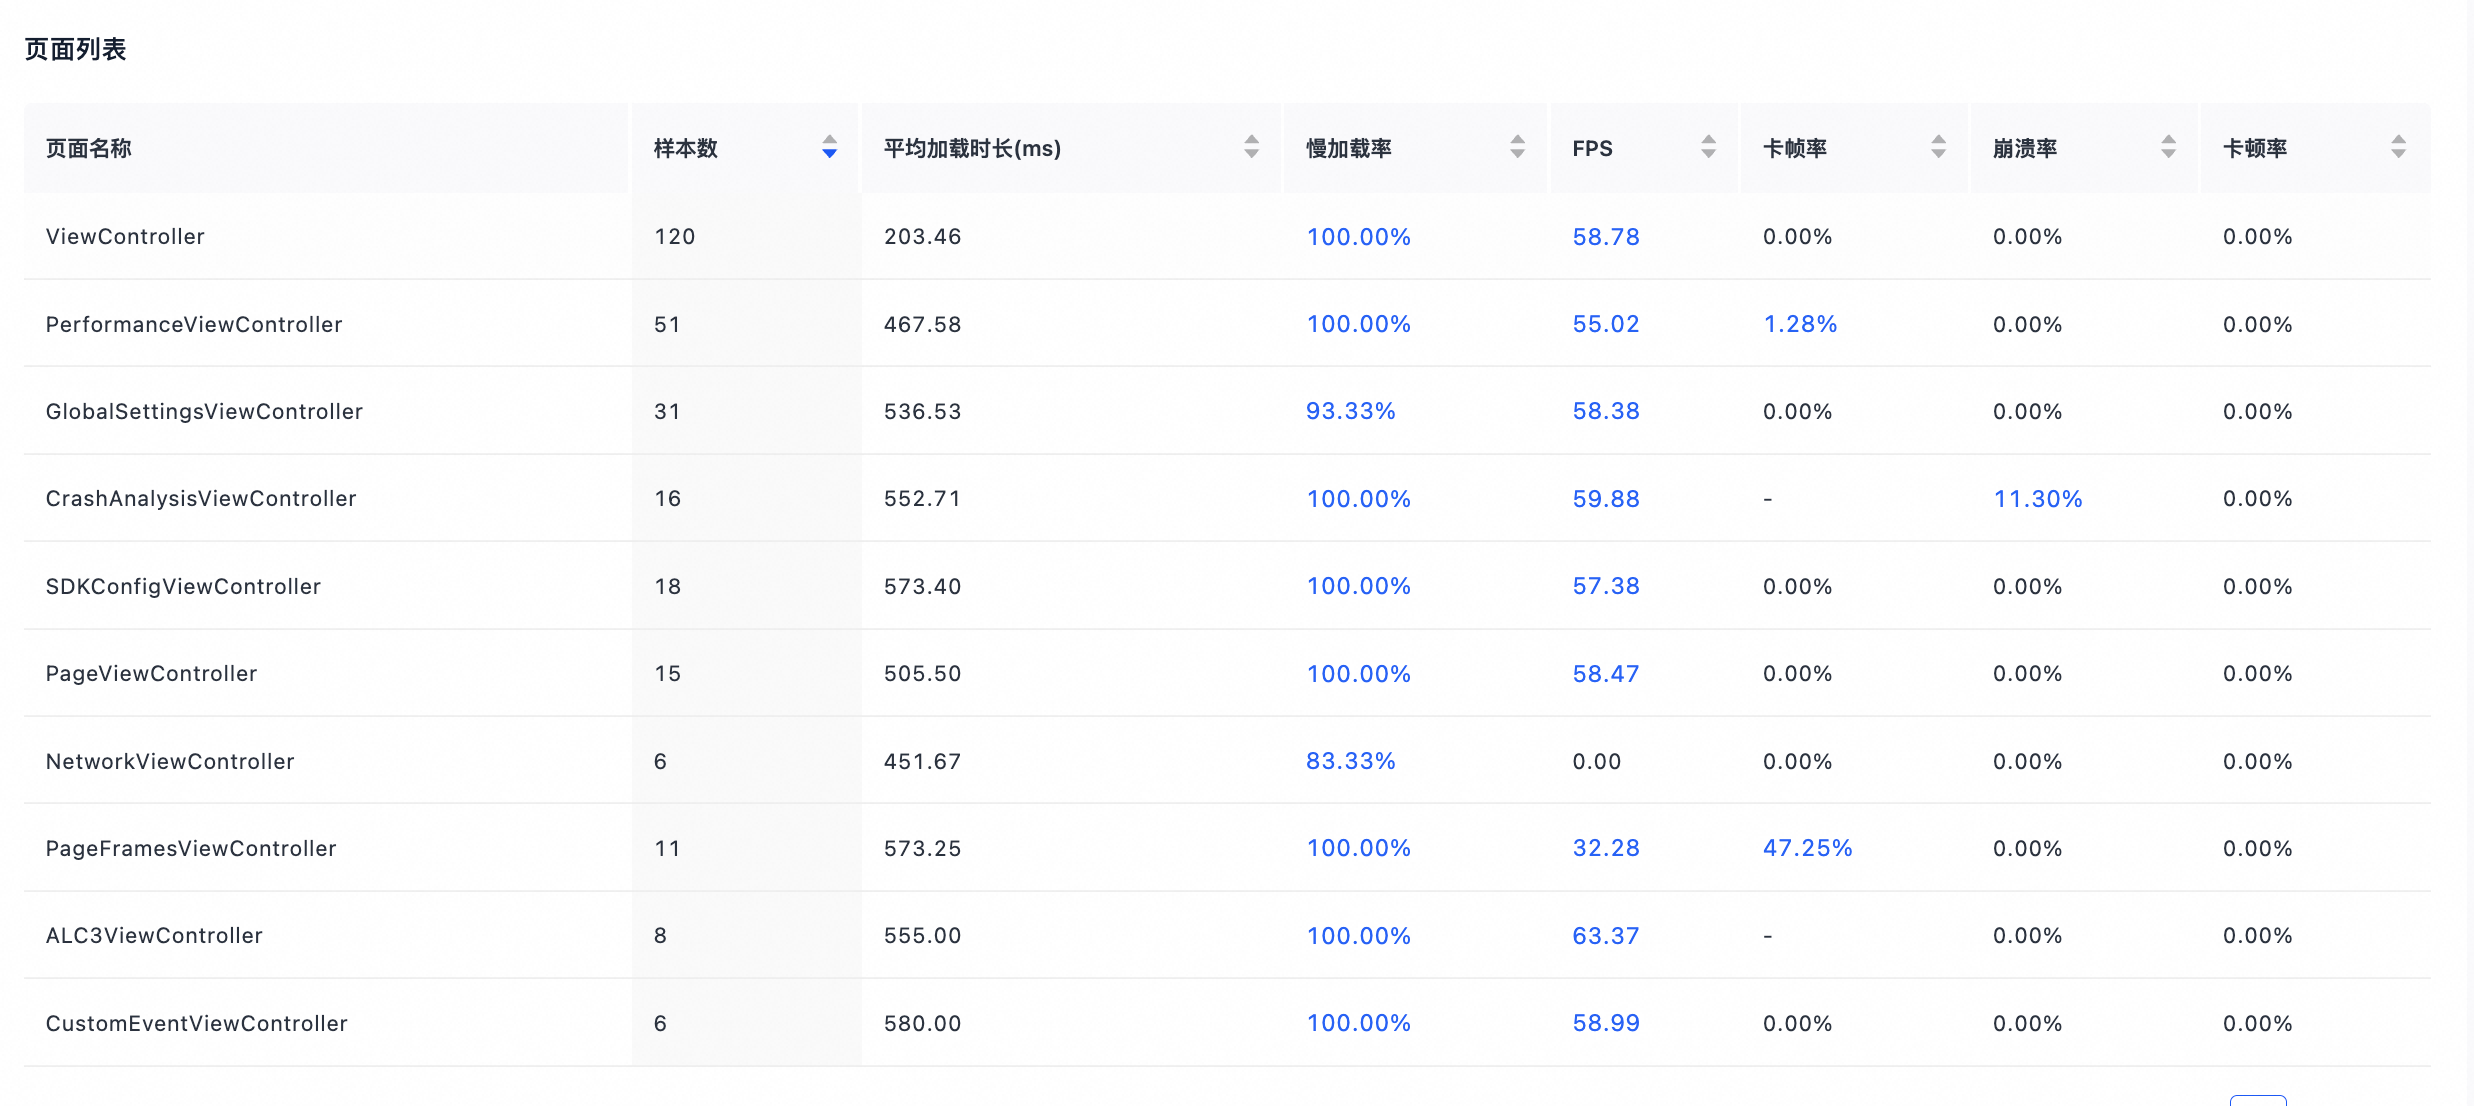
FPS | Frame rate during page scrolling, normalized to a 60 Hz baseline. |
Jank rate | iOS: Total jank duration / Total scrolling duration. Android: Jank frame count / Total frame count. |
Page list
Slow pages
Use the slow pages tab to view pages with load times that exceed the slow load threshold. Based on your selected filters, this tab displays the slow load trend, slow load distribution, and slow load details.
Slow load trend and distribution
The default slow load threshold is 3000 ms. To change this value, click the Edit icon next to the threshold.
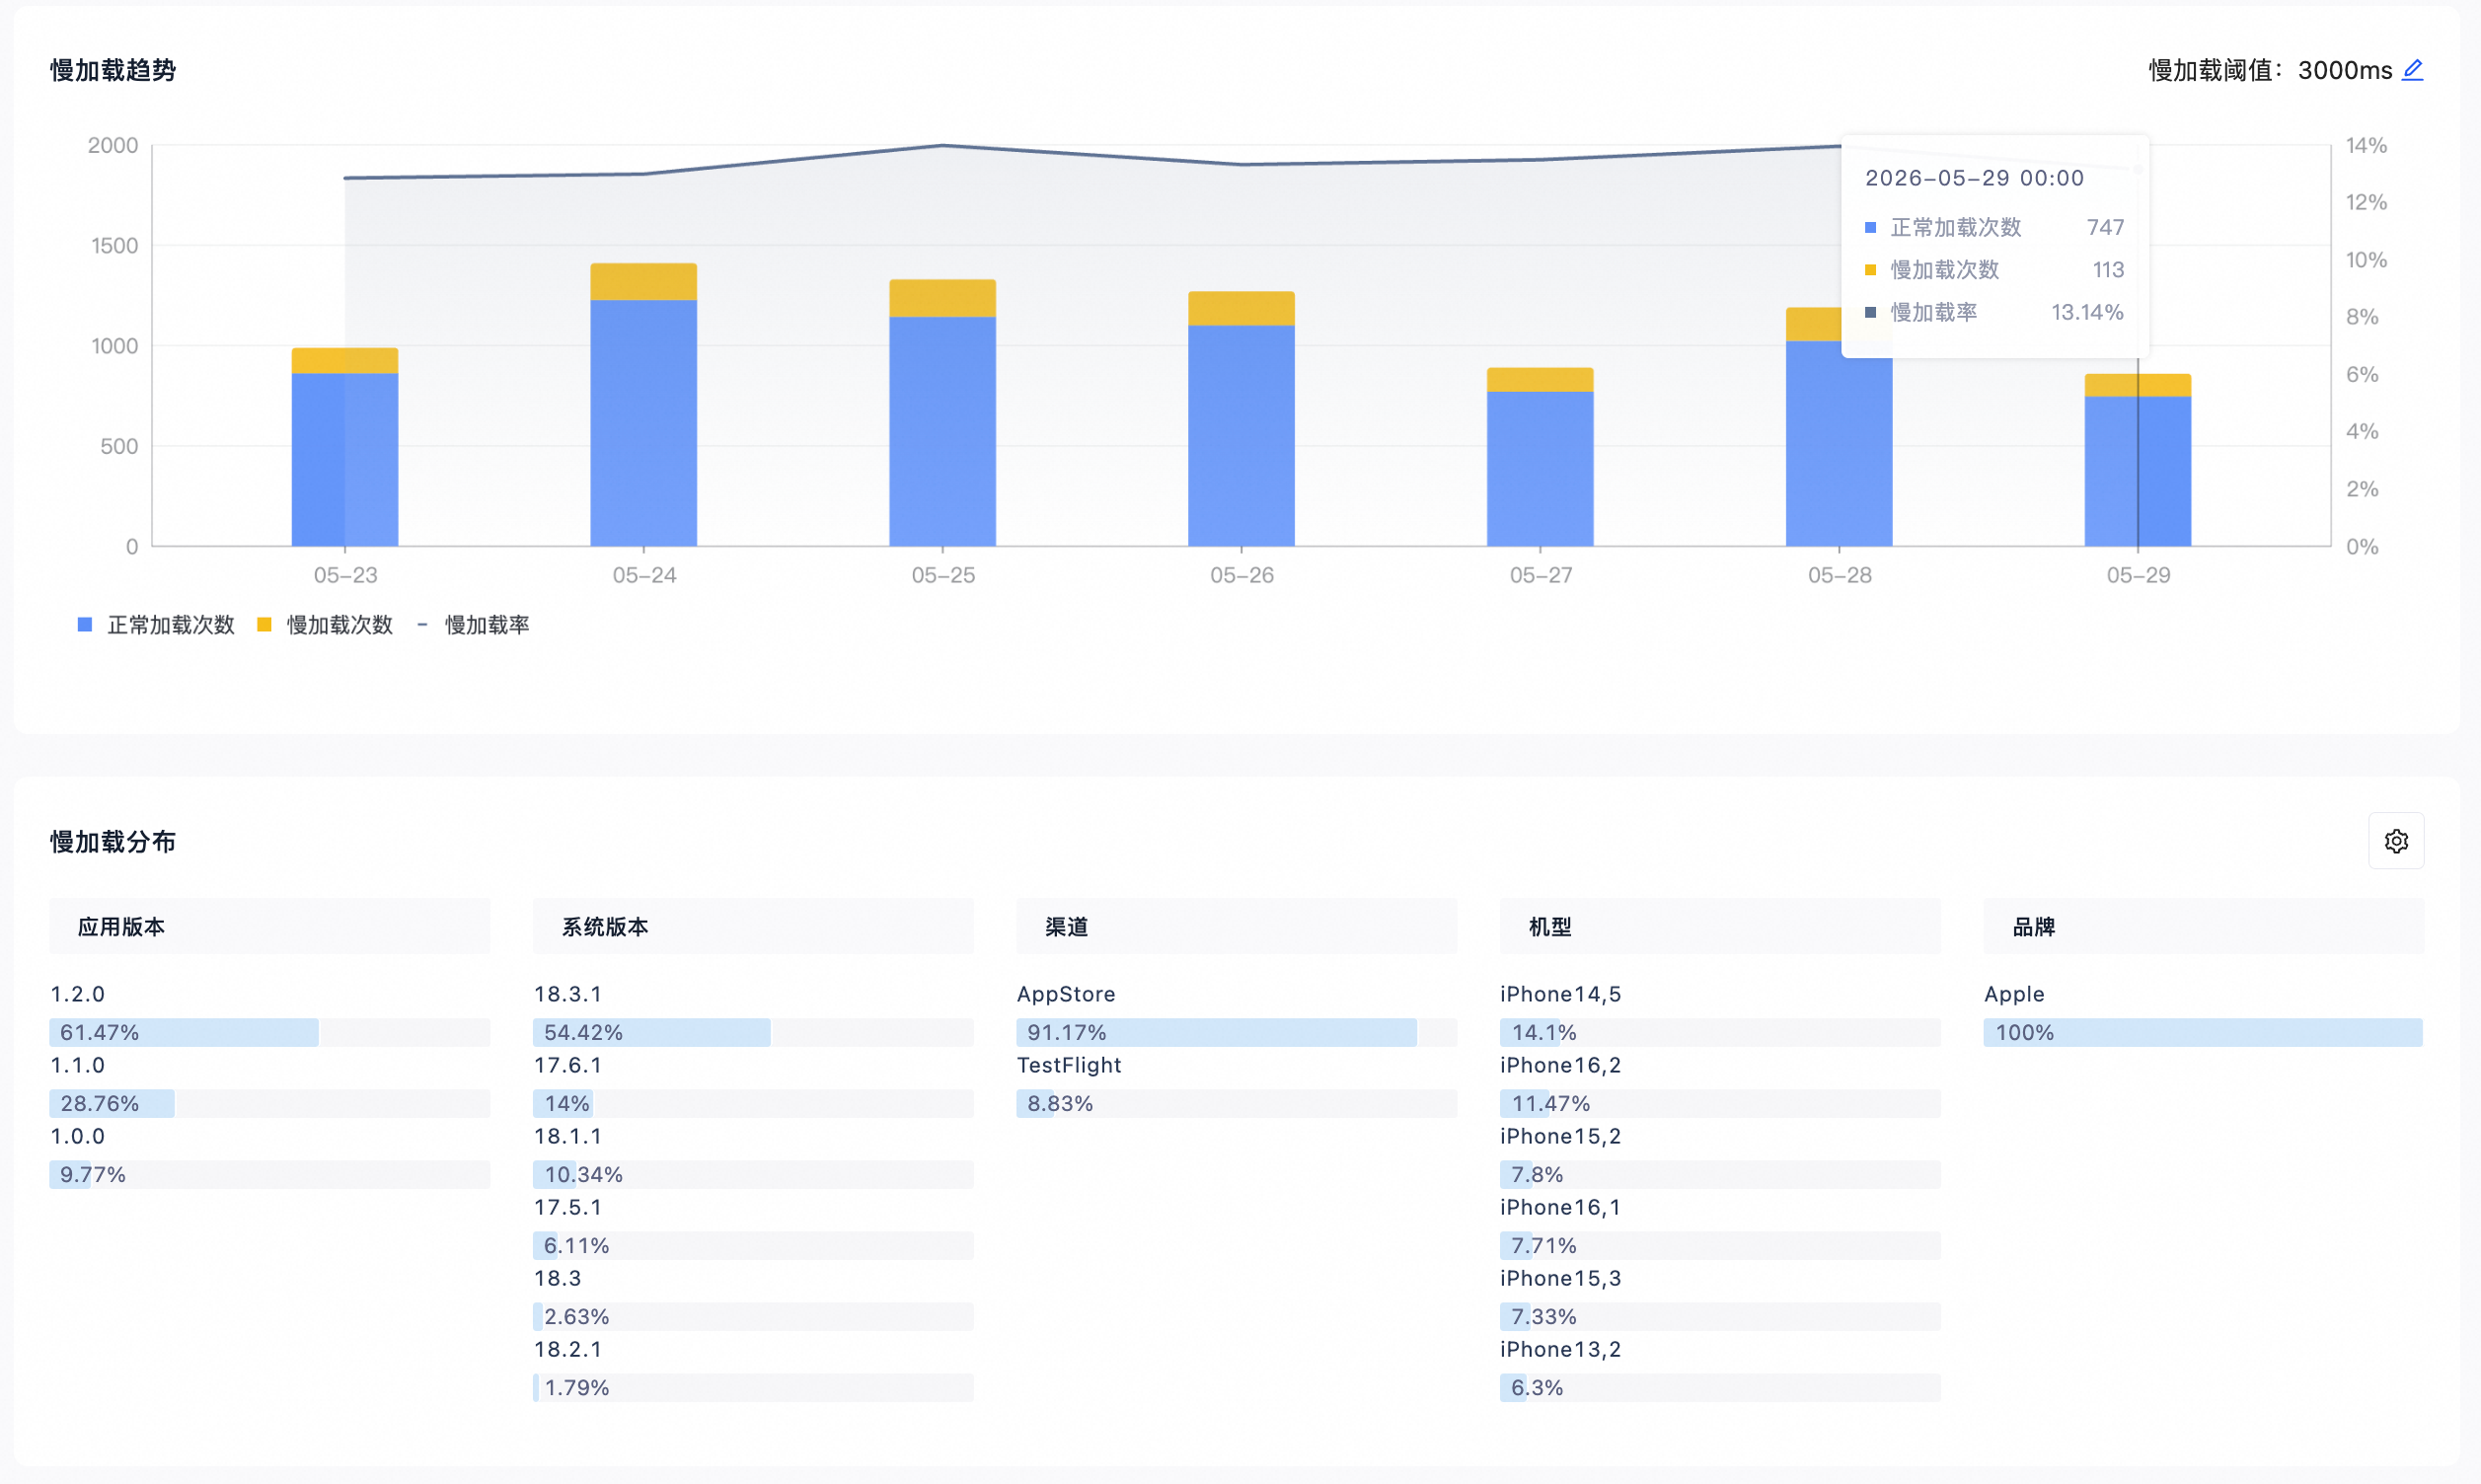
Parameter | Description |
Normal load count | Number of page load samples not exceeding the |
Slow load count | Number of page load samples exceeding the |
Slow load rate |
|
Slow load details
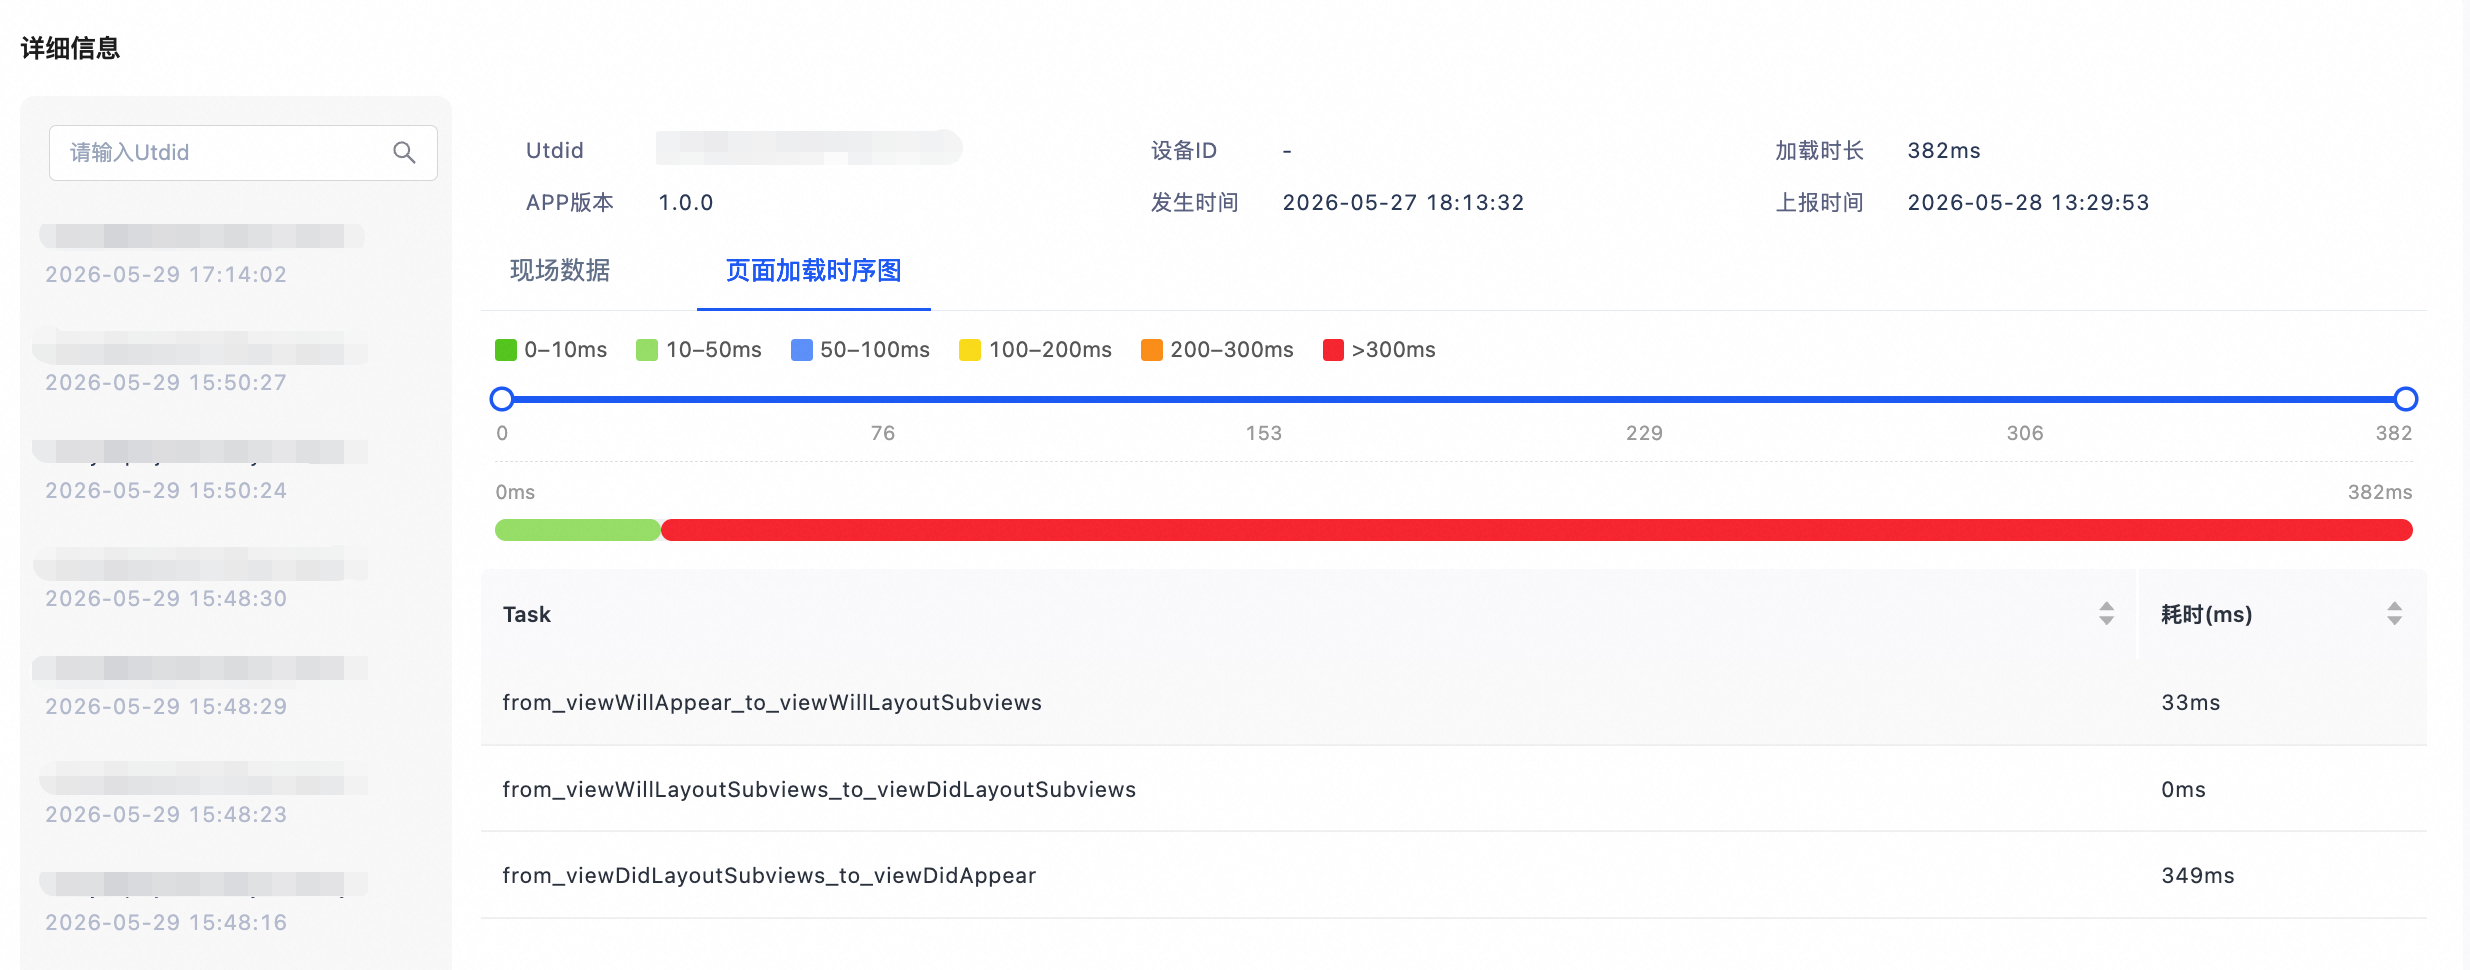
The slow load details page displays the slow load trend and slow load distribution for a specific page to help you understand the context of slow loads.
The page load timeline chart shows the duration of default page breakdown phases and any configured custom phases. Hover over a phase block to view the Phase Name, Duration, and Start/End Time.