View HTTP/network errors
This topic describes how to view HTTP/network errors.
Error analysis
View error trends
A line chart shows the error trends based on the filter criteria.
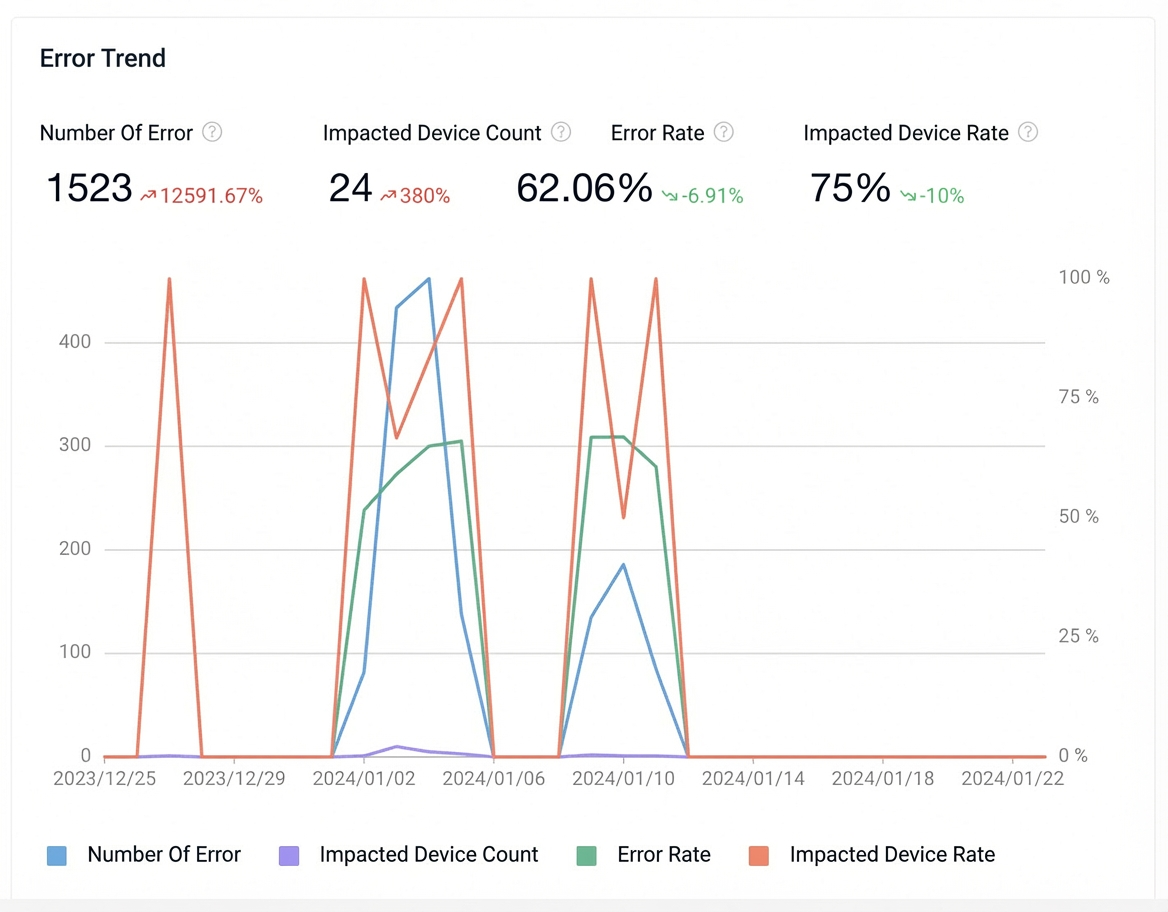
Metric |
Description |
Error count |
The total number of errors that occurred within the specified time granularity. |
Affected device count |
The number of unique devices that experienced errors within the specified time granularity. |
Error rate |
Error rate = Number of errors that meet the filter criteria / Total number of network requests that meet the filter criteria. |
Affected device rate |
Affected device rate = Number of affected devices that meet the filter criteria / Number of unique devices with network requests that meet the filter criteria. |
View error codes
A line chart shows the trend of error codes based on the filter criteria.
View error distribution
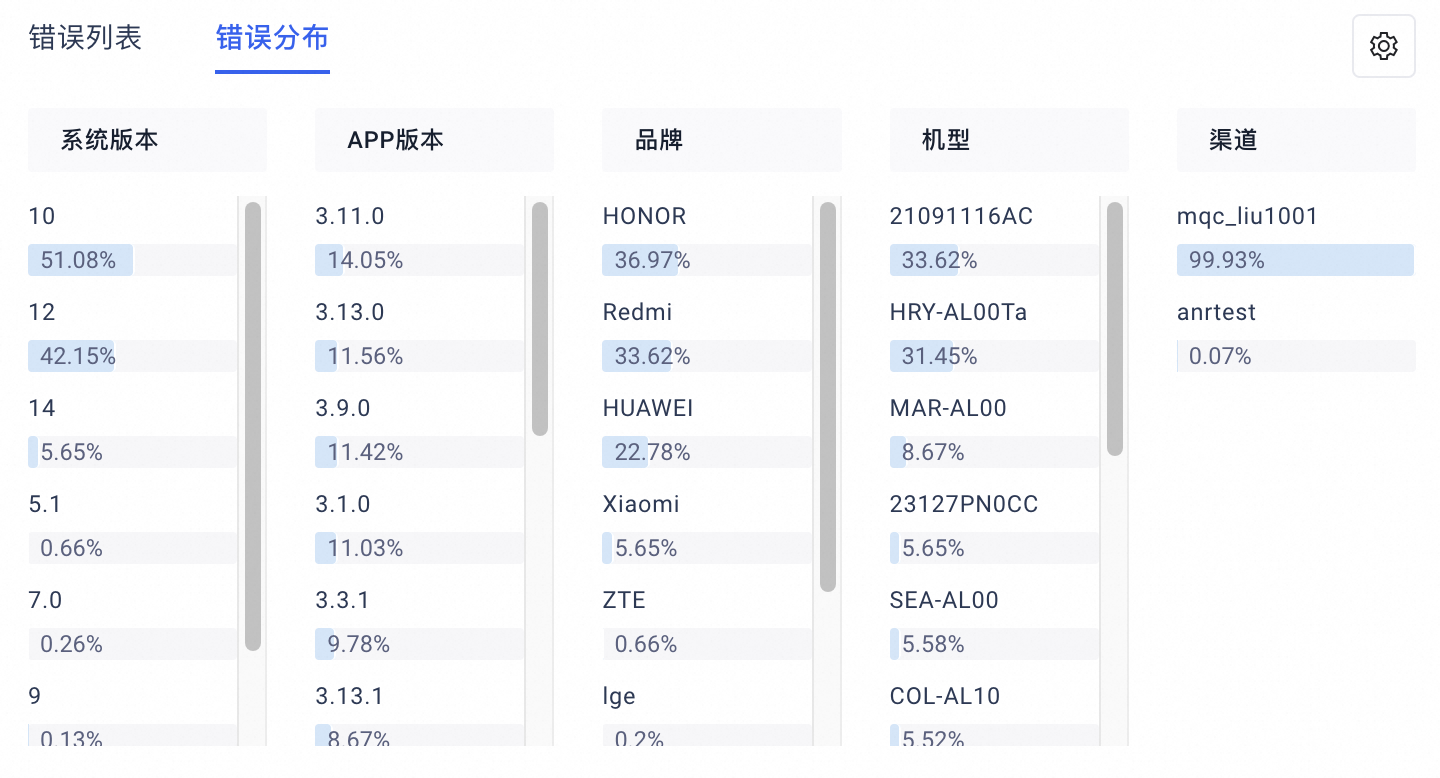
The error distribution is displayed based on the filter criteria.
Select the desired Search filter options, such as OS version, App version, Brand, Model, Channel, and City.
NoteA minimum of one metric is displayed in the legend. By default, five metrics are displayed.
Parameter |
Description |
OS version |
OS version percentage = (Filtered OS version count / Total OS version count) × 100% |
App version |
App version percentage = (Filtered app version count / Total app version count) × 100% |
Brand |
Brand percentage = (Filtered brand count / Total brand count) × 100% |
Device model |
Device model percentage = (Filtered device model count / Total device model count) × 100% |
Channel |
Channel percentage = (Filtered channel count / Total channel count) × 100% |
City |
City percentage = (Filtered city count / Total city count) × 100% |
View the error list
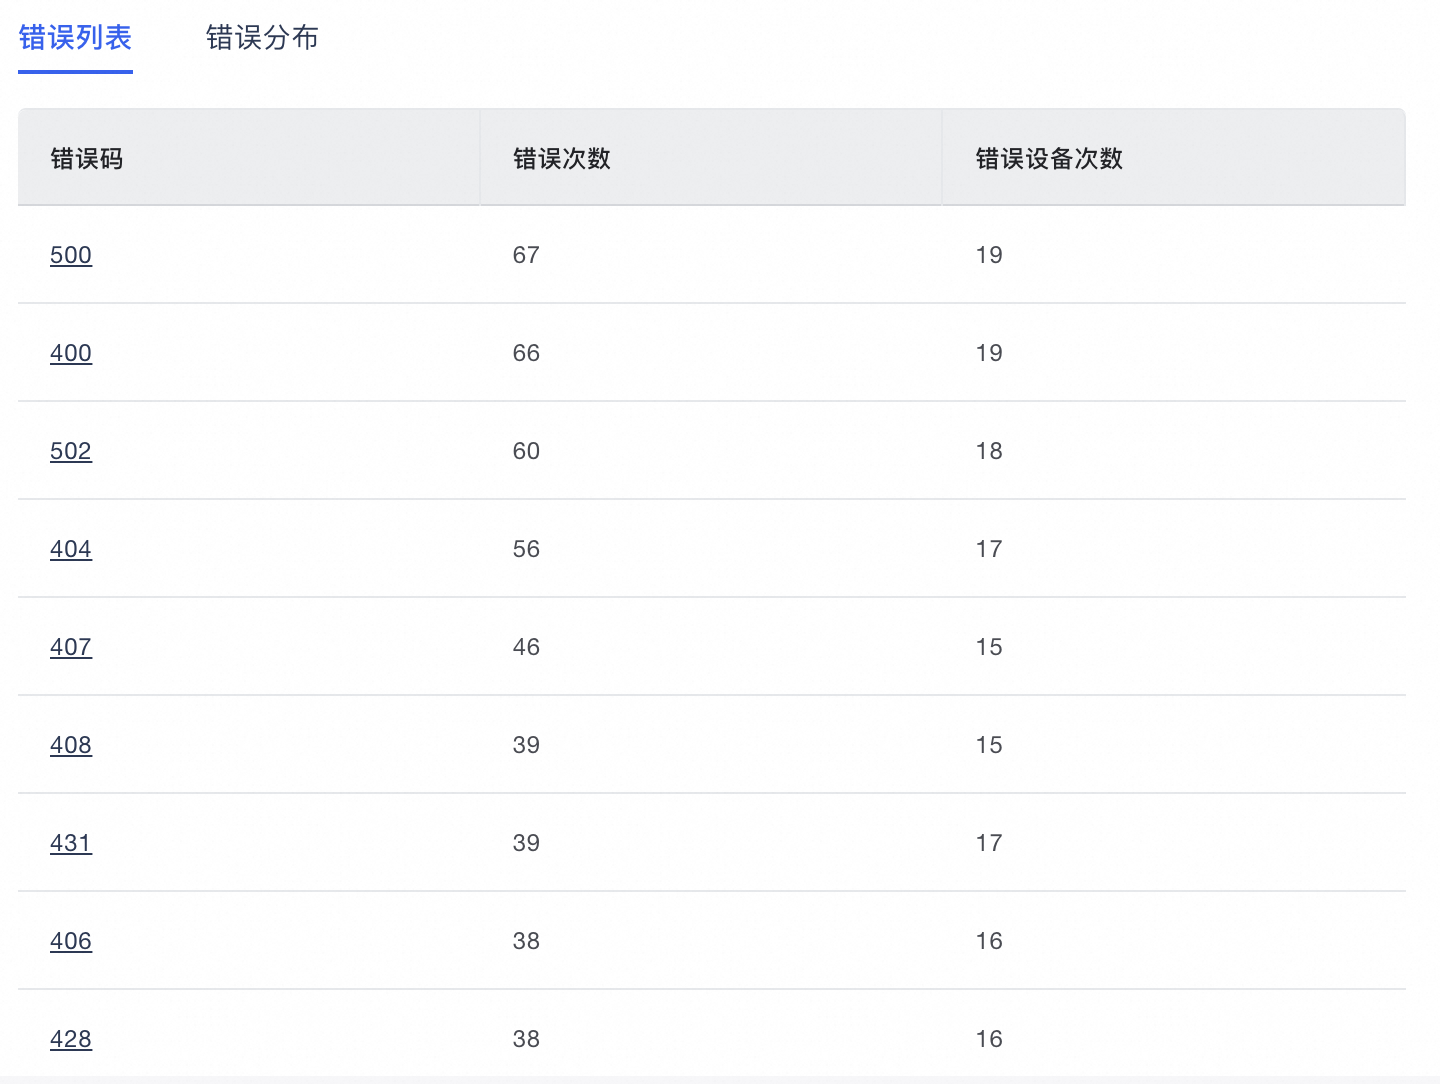
The list displays data aggregated by page based on the filter criteria. The data includes error codes, error counts, and the number of affected devices.
Metric |
Description |
Error code |
Click an error code to go to the Error Details page for more information. |
Error count |
The number of error samples. |
Number of device faults |
The number of unique devices that experienced errors. |
Error details
Basic information
The aggregation details show data for a specific time period. The data is aggregated by a time dimension of 1 minute, 5 minutes, 1 hour, or 1 day.
For example, if the aggregation dimension is 1 day, data from the last 7 days is displayed.
By default, for 1-minute and 5-minute granularities, data from the last 15 minutes is displayed.
By default, for a 1-hour granularity, data from the last 24 hours is displayed.
By default, for a 1-day granularity, data from the last 7 days is displayed.
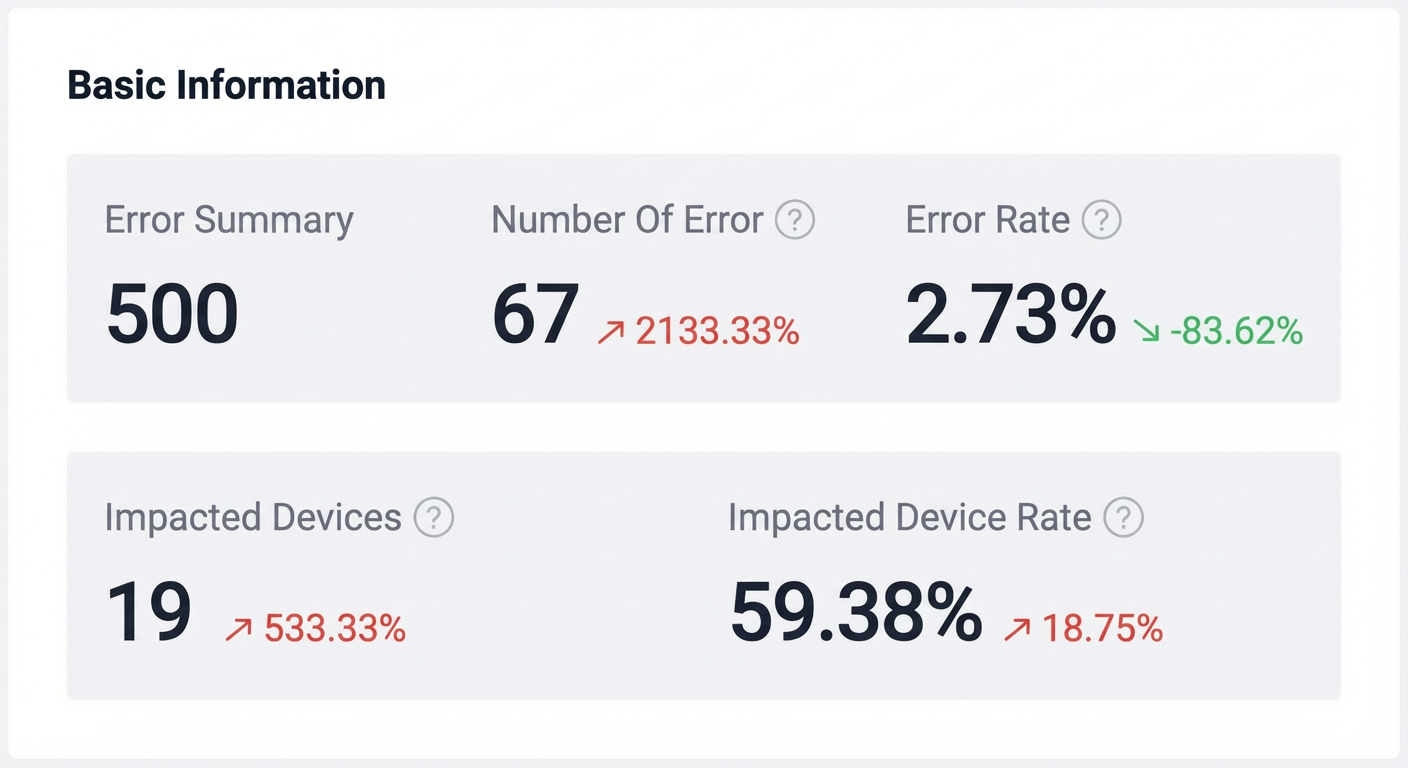
Parameter |
Description |
Error summary |
The error code. |
Error count |
The total number of errors that occurred within the selected time period. |
Error rate |
Error rate = Number of errors that meet the filter criteria / Total number of requests that meet the filter criteria. |
Affected device count |
The number of affected devices that meet the filter criteria. |
Affected device rate |
Affected device rate = Number of affected devices that meet the filter criteria / Number of devices that launched the application and meet the filter criteria. |
View error trends
A line chart shows the error trends based on the filter criteria.
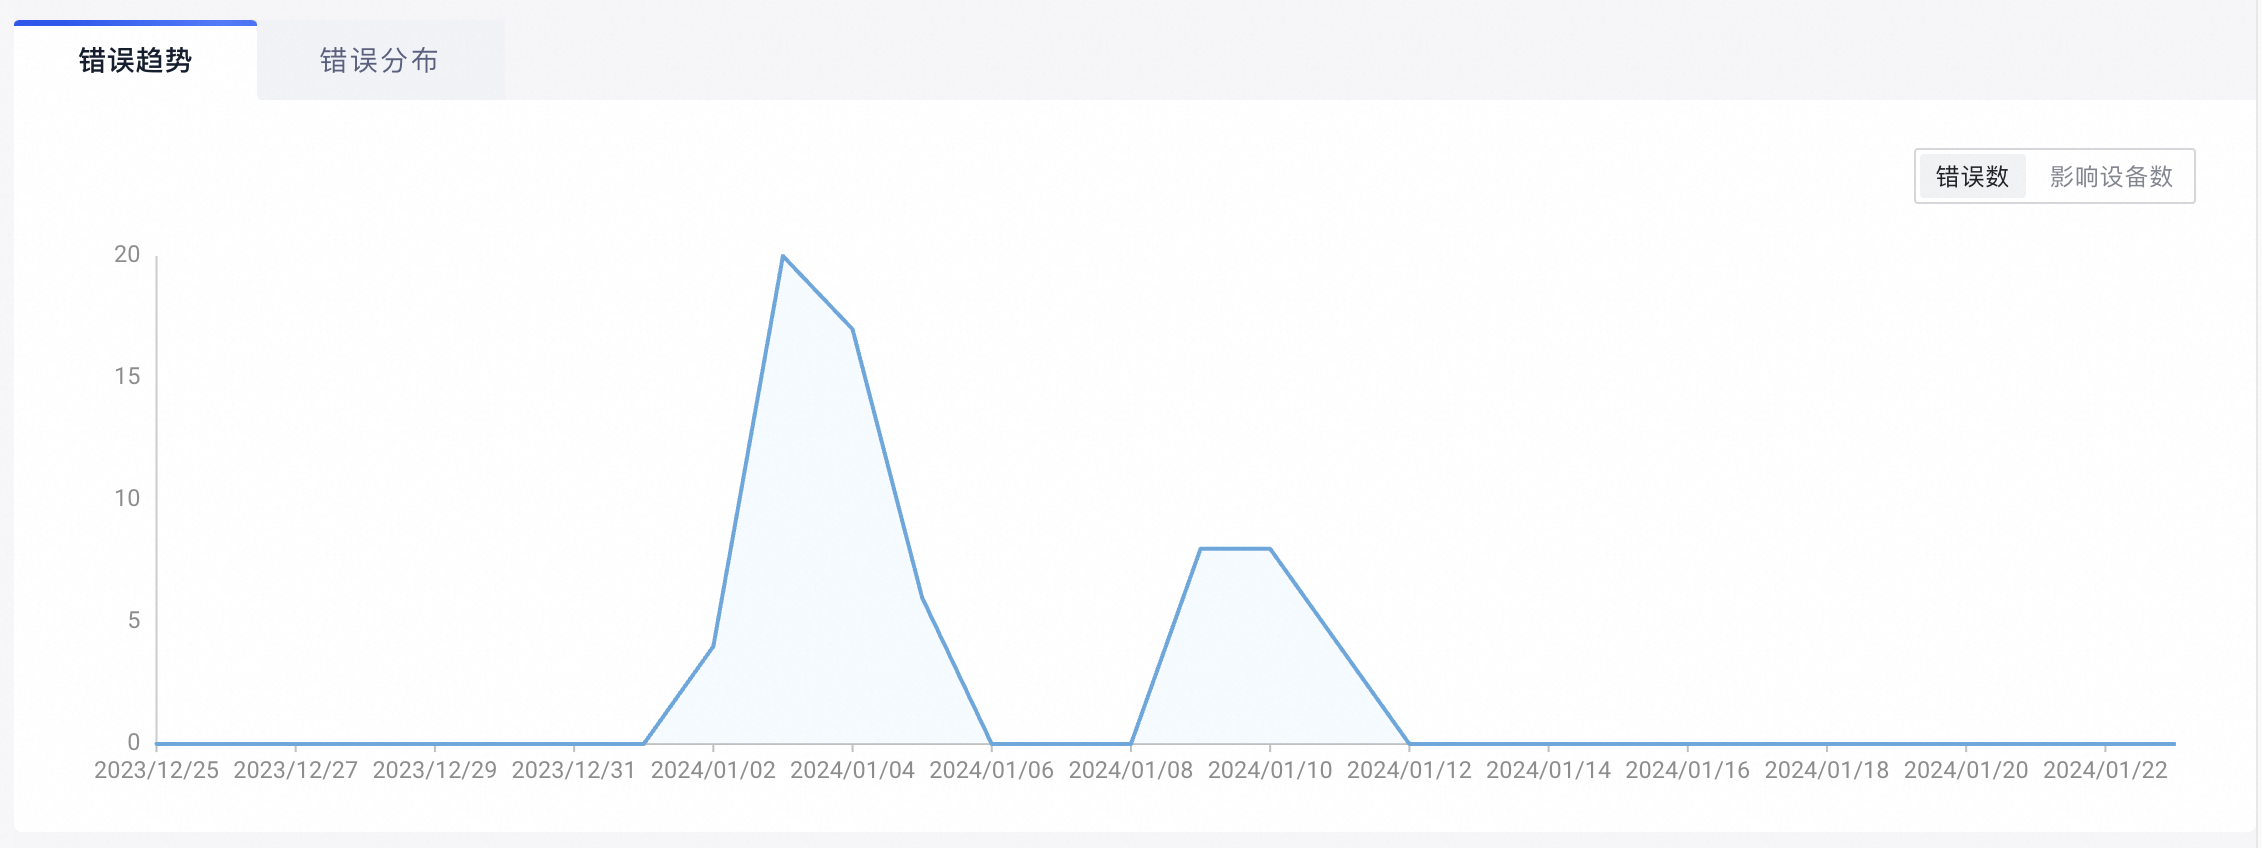
Metric |
Description |
Error count |
The total number of errors that occurred within the selected time period. |
Affected device count |
The number of affected devices that meet the filter criteria. |
View error distribution
The error distribution is displayed based on the filter criteria.
Select the desired Search filter options, such as OS version, App version, Brand, Model, Channel, and City.
NoteA minimum of one metric is displayed in the legend. By default, five metrics are displayed.
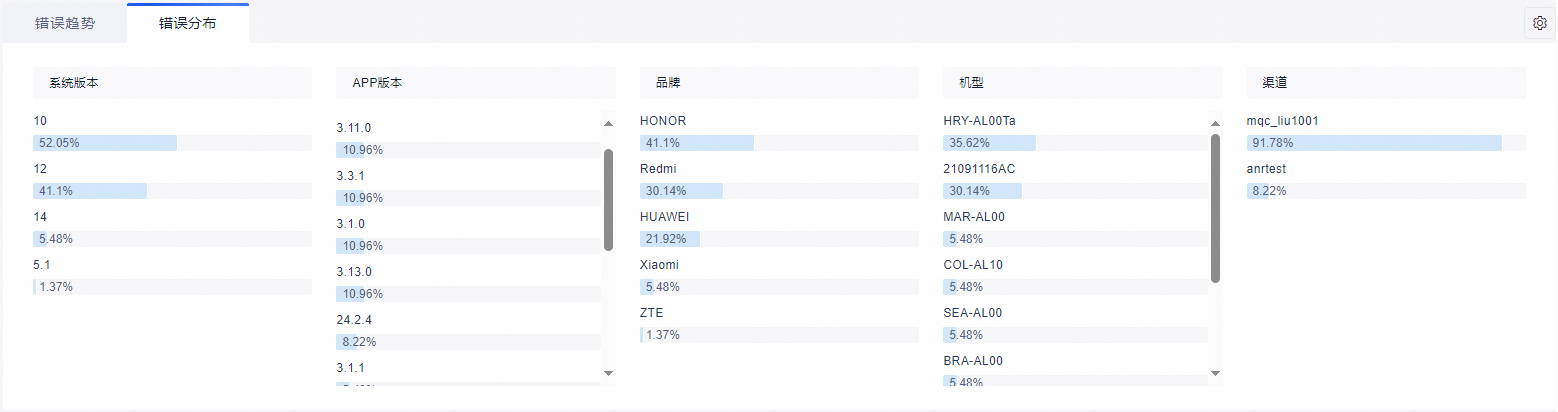
Metric |
Description |
System version |
Percentage of system versions = (Number of filtered system versions / Total number of system versions) × 100% |
Application version |
Percentage of application versions = (Number of filtered application versions / Total number of application versions) × 100% |
Brand |
Percentage of brands = (Number of filtered brands / Total number of brands) × 100% |
Device model |
Percentage of device models = (Number of filtered device models / Total number of device models) × 100% |
Channel |
Percentage of channels = (Number of filtered channels / Total number of channels) × 100% |
City |
Percentage of cities = (Number of filtered cities / Total number of cities) × 100% |
View detailed information
On the details page, all error instances for the same error code are displayed on the left. Click an instance to view its related information on the right, such as Current options, Request header, Response header, and Error stack.
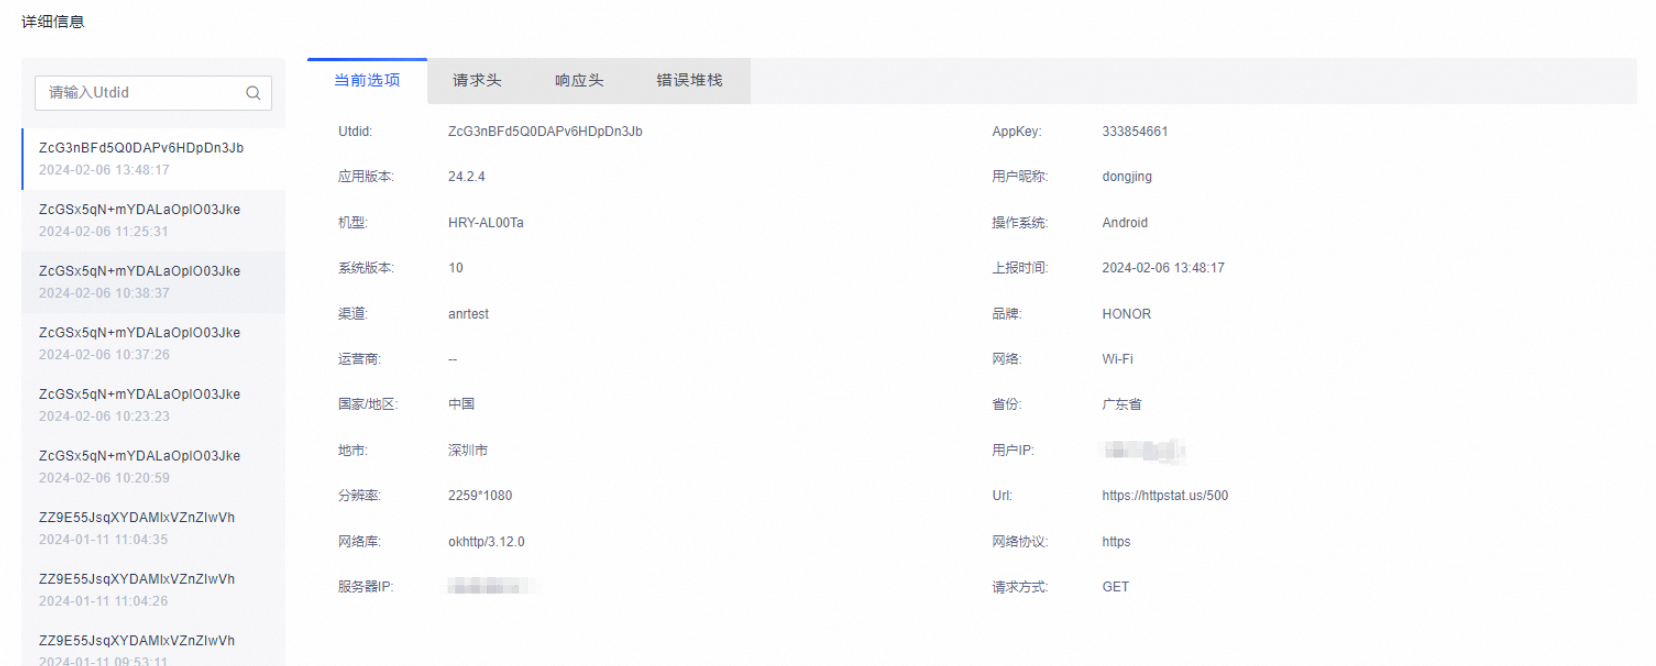
Current options
The Current options tab displays basic information about the error.
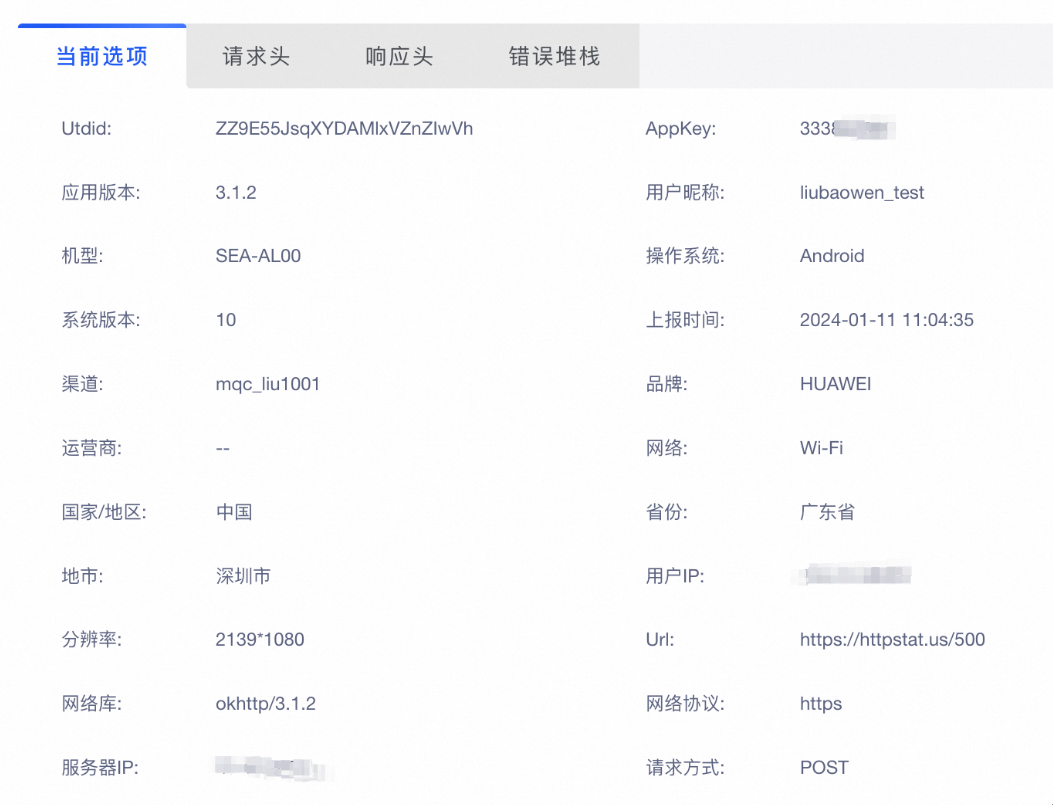
Parameter |
Description |
Utdid |
The unique ID of the device. |
appKey |
The AppKey used to access App Performance Analytics. |
App version |
The app version passed when accessing App Performance Analytics. |
User nickname |
The user nickname passed when accessing App Performance Analytics. |
Model |
The model identifier of the device where the network request occurred. |
Operating system |
The operating system of the device when the network request occurred. |
Operating Version |
The operating system version of the device when the network request occurred. |
Report time |
The time the error was reported. This is the server-side time. |
Channel |
The channel identifier passed when accessing App Performance Analytics. |
Brand |
The brand of the device where the error occurred. |
Carrier/Network |
The carrier and network information for the device when the network request occurred. |
Country/Region |
The geographical location of the device when the network error occurred, estimated based on the IP address. |
Province/City |
The province and city where the device was located when the network request occurred. |
User IP |
The public IP address of the device when the network request occurred. |
Resolution |
The screen resolution of the device where the network request occurred. |
Url |
The specific URL accessed by the network request. |
Network library |
The network library used to initiate the network request. |
Network protocol |
The HTTP protocol. |
Server IP |
The destination IP address of the network request. |
Request method |
The HTTP request method. |
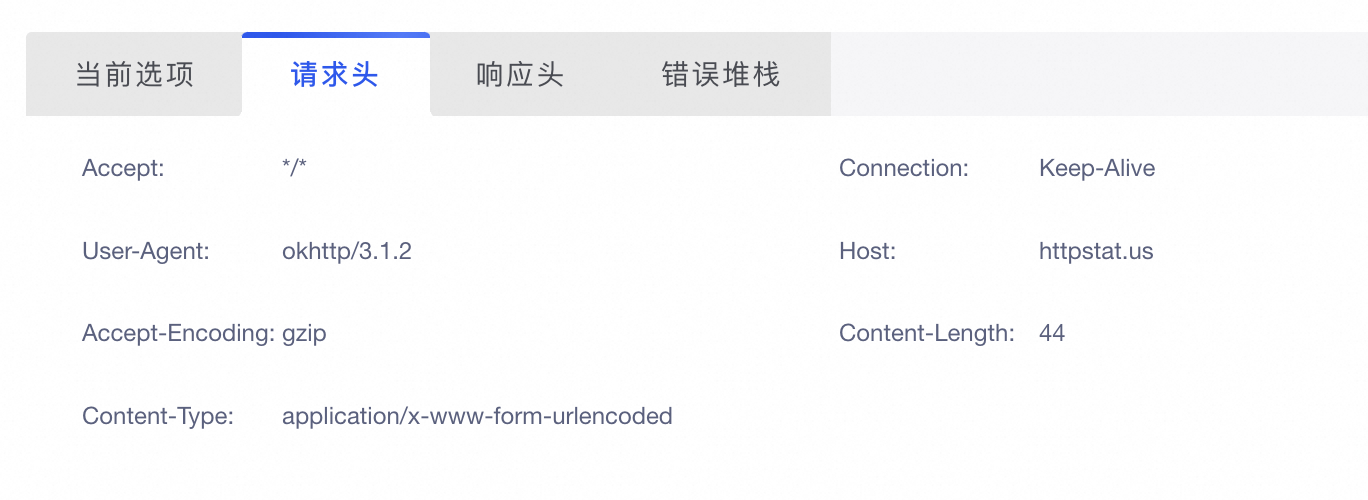
View the request header
This tab displays the request header of the network request.
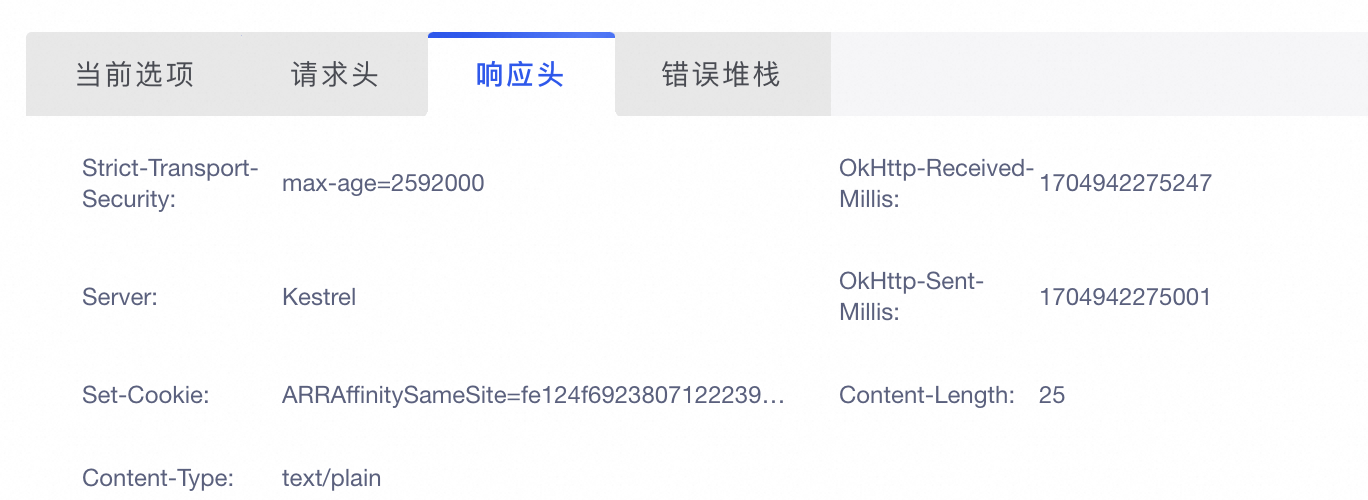
View the response header
This tab displays the response header of the network request.
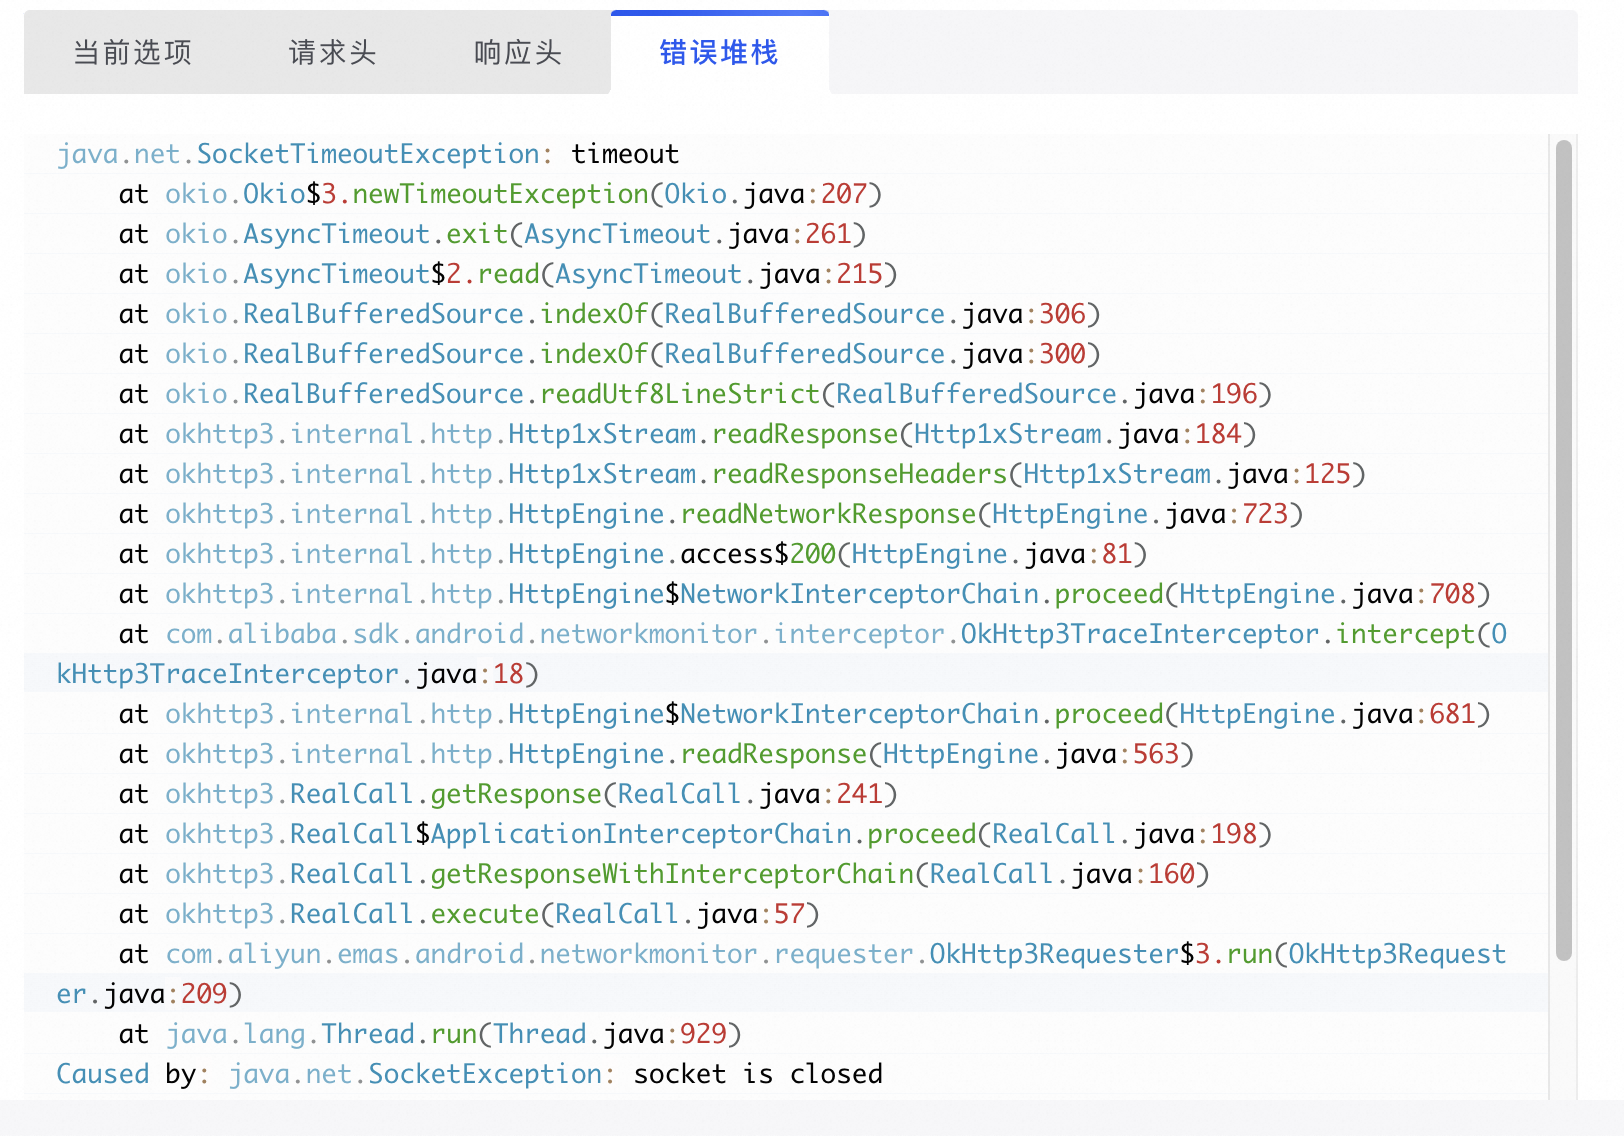
View the error stack
This tab displays the error stack log that was reported when the error occurred.