Network analysis
Network Analysis lets you query various metrics for network requests from your mobile application under specified conditions.
Key concepts
Network analysis aggregates and displays data for a specified time period at intervals of 1 minute, 5 minutes, 1 hour, or 1 day.
For example, if the aggregation interval is 1 day, the feature displays data for the last 7 days at a 1-day granularity.
By default, for 1-minute and 5-minute intervals, data from the last 15 minutes is displayed.
By default, for the 1-hour interval, data from the last day is displayed.
By default, for the 1-day interval, data from the last 7 days is displayed.
View data analysis
This section describes how to view data in network analysis.
Log on to the EMAS console, find and click your project to open the EMAS overview page.
In the top navigation bar, select developer tools.
In the left-side navigation pane, select performance analysis, and then select network analysis.
Set the filters and click Query. For more filtering options, see More Search. The following example uses a 1-day aggregation interval over the last 7 days.
View detailed data in the domain name list, network trend, error list, and error distribution sections.
View the domain name list
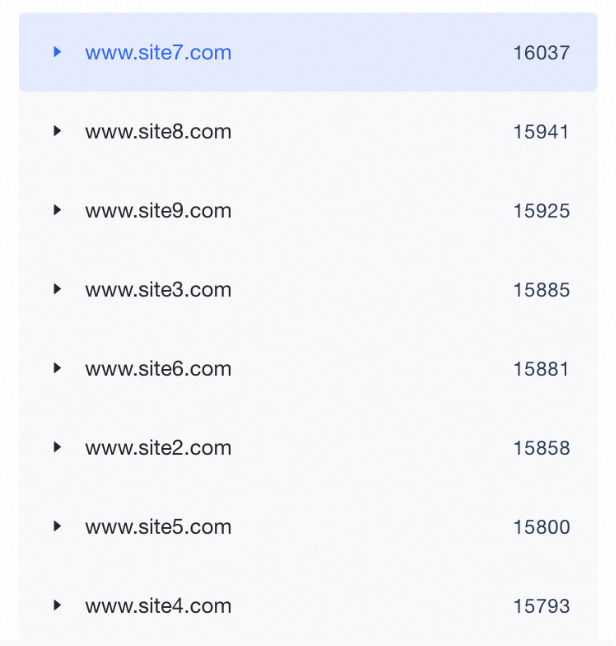
This section displays a list of domains or paths for network requests that match your filter criteria.
Parameter |
Description |
All |
Displays all domains. |
Connection reuse rate |
The number of requests that reused a connection divided by the total number of requests. |
HTTP errors |
Displays the domains or paths with HTTP errors and the corresponding error count. |
Network errors |
Displays the domains or paths with network errors and the corresponding error count. |
Network request latency |
Lists domains or paths and their average network request latency. |
DNS latency |
Lists domains or paths and their average DNS latency. |
SSL latency |
Lists domains or paths and their average SSL latency. |
TCP connection time |
Lists domains or paths and their average TCP connection time. |
Sending duration |
The duration of the request transmission. |
Time to first byte (TTFB) |
The time from when a request is fully sent until the first byte of the response is received. |
Content download time |
The time from when the first byte of the response is received until the download is complete. |
Request size |
Lists domains or paths and their average request size. |
Response size |
Lists domains or paths and their average response size. |
View the network trend
The network trend section shows the following data:
Subtab |
Description |
Displays HTTP errors, their trends over time, and error details. |
|
Displays network errors, their trends over time, and error details. |
|
Displays network request latency and its trend over time. |
|
Displays DNS latency and its trend over time. |
|
Displays SSL latency and its trend over time. |
|
Displays TCP connection time and its trend over time. |
|
Displays request size and its trend over time. |
|
Displays response size and its trend over time. |