The Sharing Analysis page displays sharing data (T+1) for the selected mini program, H5 app, or mini game, including five metrics such as number of sharers, sharing times, and sharing back traffic. Use these metrics to evaluate viral sharing effectiveness over the past 1, 7, or 30 days.
To view Sharing Analysis data, follow these steps:
-
From the Mini Program Open Platform > Admin Backend, access Data Statistics > Sharing Analysis page from the navigation pane on the left.
-
From the dropdown box in the upper left corner of the page, select the target mini program/H5 App/mini game.
-
Select a time range to view statistical data for the corresponding period.
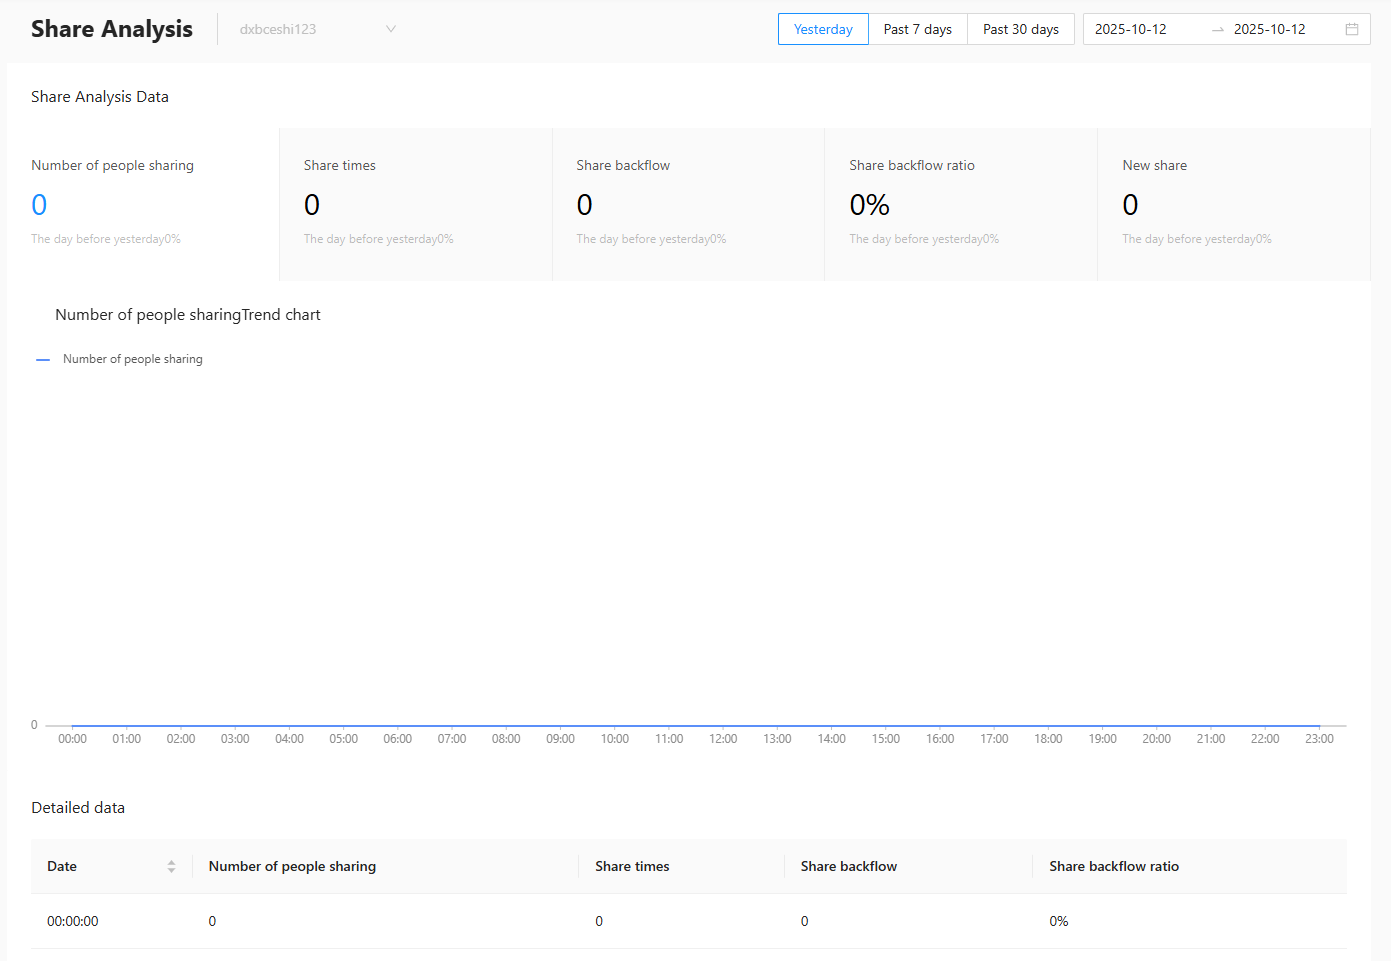
Sharing analysis overview
Shows five metrics for the selected mini program, H5 app, or mini game during the specified period: number of sharers, sharing times, sharing back traffic, sharing back rate, and new sharing, along with growth rates compared to the previous day, same period last week, or same period last month.
The following table describes each metric.
|
Metric |
Description |
|
Number of Sharers |
The total number of users who shared mini program, H5 app, or mini game pages. Each user is counted only once regardless of how many times they shared. |
|
Sharing Times |
The total number of times mini program, H5 app, or mini game pages were shared. |
|
Sharing Back Traffic |
The number of times users accessed the mini program, H5 app, or mini game by clicking shared links. |
|
Sharing Back Rate |
Measures sharing propagation effectiveness. Sharing back rate = sharing back traffic / sharing times × 100%. |
|
New Sharing |
The number of new users who entered the mini program, H5 app, or mini game for the first time through shared links. |
|
Previous day (%) |
The growth rate of the selected day's cumulative data compared to the previous day's cumulative data. Previous day comparison = (Sharing data of the specified date - Sharing data of the previous day)/Sharing data of the previous day. When the denominator is 0, it is calculated as 1. Only the integer part before the percentage sign is retained. |
|
Same period last week (%) |
The growth rate of the past 7 days' cumulative data compared to the cumulative data from 8-14 days ago. Same period last week = (Sharing data of the past 7 days - Sharing data of the same period last week)/Sharing data of the same period last week. When the denominator is 0, it is calculated as 1. Only the integer part before the percentage sign is retained. |
|
Same period last month (%) |
The growth rate of the past 30 days' cumulative data compared to the cumulative data from 31-60 days ago. Same period last month = (Sharing data of the past 30 days - Sharing data of the same period last month)/Sharing data of the same period last month. When the denominator is 0, it is calculated as 1. Only the integer part before the percentage sign is retained. |
Sharing trend
Shows each metric as a line chart over the specified period. Click a metric card to display its data trend.
Detailed data
Lists sharing metrics in a table with time-based sorting.
Time granularity depends on the selected range: hourly for a 1-day range, or daily for 7-day and 30-day ranges.