View user access data (T+1 timeliness) for your mini program, H5 App, or mini game across seven metrics, including new users, active users, opens, and page visits. You can view statistics for the past 1, 7, or 30 days to track user trends at each stage.
To view user analysis data, follow these steps:
-
In the Mini Program Open Platform > Admin Backend, go to Data Statistics > User Analysis page from the navigation pane on the left.
-
From the dropdown box in the upper left corner of the page, select the target mini program/H5 App/mini game.
-
Select a time range to view the statistical data for the corresponding period.
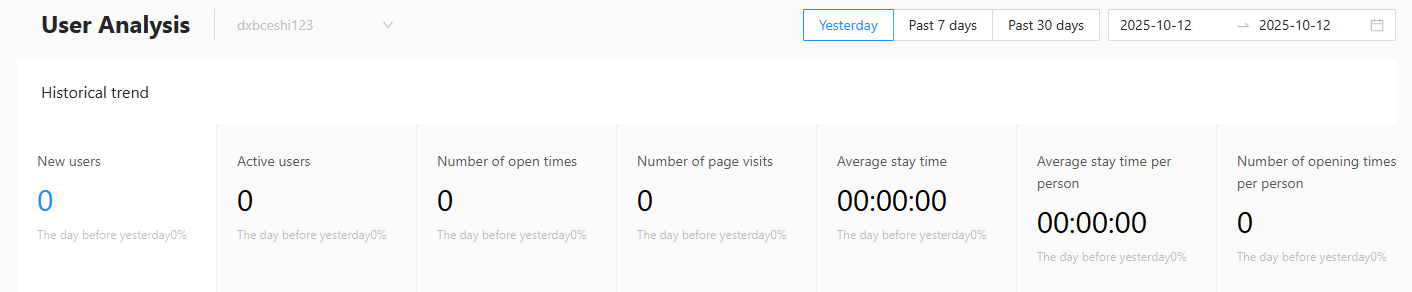
User analysis overview
Seven metrics are displayed for the selected period: new users, active users, opens, page visits, average duration per open, average duration per user, and average opens per user, along with growth rates compared to the previous day, same period last week, or same period last month.
The metrics are described in the following table.
|
Metric |
Description |
|
New Users |
The number of users who access the mini program, H5 App, or mini game for the first time. Multiple visits by the same user are counted only once. |
|
Active Users |
The total number of users who access the mini program, H5 App, or mini game. Multiple visits by the same user are counted only once. |
|
Number of Opens |
The total number of times the mini program, H5 App, or mini game is opened. Each session from opening to exiting to the background counts as one open. If two consecutive opens occur less than 30 seconds apart, they are counted as a single open. |
|
Page visit count |
The total number of visits to all pages within the mini program, H5 App, or mini game. Navigation between pages and repeated visits to the same page each count as separate visits. |
|
Average duration per open |
The average time spent per open session during the selected period. Formula: average duration per open = total stay duration of all users / number of opens. |
|
Average duration per user |
The average time each user spends on the mini program, H5 App, or mini game. Formula: average duration per user = total stay duration / number of active users. |
|
Average opens per user |
The average number of times each user opens the mini program, H5 App, or mini game during the selected period. Formula: average opens per user = total opens / total active users. |
|
Previous day (%) |
The growth rate of the selected day's data compared to the previous day. Formula: previous day comparison = (data for the specified date - data for the previous day) / data for the previous day. A divisor of 0 is treated as 1. The result is rounded to an integer percentage. |
|
Same period last week (%) |
The growth rate of data for the past 7 days compared to data for the preceding 7-day period (days 8-14). Formula: same period last week = (data for the past 7 days - data for the same period last week) / data for the same period last week. A divisor of 0 is treated as 1. The result is rounded to an integer percentage. |
|
Same period last month (%) |
The growth rate of data for the past 30 days compared to data for the preceding 30-day period (days 31-60). Formula: same period last month = (data for the past 30 days - data for the same period last month) / data for the same period last month. A divisor of 0 is treated as 1. The result is rounded to an integer percentage. |
User access trends
The trend of each metric over the selected period is shown as a line chart. Click a metric card to display the corresponding data trend.
Detailed data
User analysis statistics for each hour or day within the selected period are displayed in a table. You can sort the data by time.
The time granularity depends on the selected range: a 1-day range shows hourly data, while a 7-day or 30-day range shows daily data.